Aha! Develop Advanced plan required. Contact us if you want a demo, or to try using this in your account. No salespeople here at Aha! — just product experts.
Aha! Develop | Introduction to reports (Advanced plan)
Your team's decisions are only as good as the data that informs them. Reports in Aha! Develop visualize your team's ability to complete work efficiently and suggest your capacity to commit to more. Use them to uncover insights and highlight performance trends for either your entire team or individual members.
Reports in Aha! Develop show you at-a-glance insights. If you want to dig deeper, hover over a data point for an event summary. Click on a data point to generate a pre-built list report of the affected records and events. You can adjust this list report for further analysis, then close the tab when you are ready to return to the original report.
Click any of the following links to skip ahead:
Library
Planning
In development
Delivered
Library
Overview (Aha! Roadmaps integration)
If you have integrated your Aha! Develops account with Aha! Roadmaps, you have access to the reports Overview page. From here, you can quickly locate and organize your reports using folders, search, filters, and favorites.
By default, the reports overview shows you your most recently created saved reports. If you have administrator permissions, you can also see and organize reports across your Aha! account.
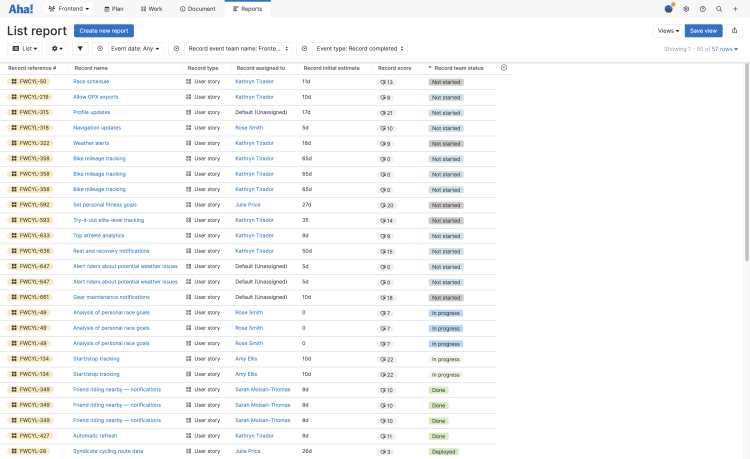
Custom list
Aha! Develop includes many pre-built list reports — but if your curiosity leads you in new directions, you can always create your own. With the list report, you can add column headers for every data object, then filter and sort the data to present different perspectives on your work.
Custom pivot (Aha! Roadmaps integration)
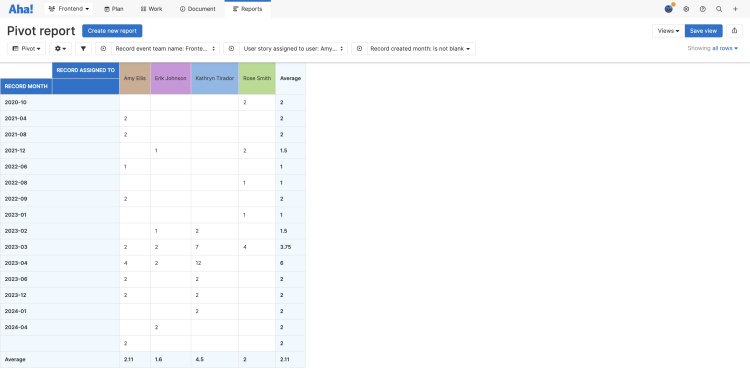
If you have integrated your Aha! Develops account with Aha! Roadmaps, you have access to custom pivot tables. Just like list reports, pivots allow you to manipulate data from hundreds of different data objects. You can use them to summarize data, visualize it in new ways, and perform calculations on pivoted data sets.
Custom chart (Aha! Roadmaps integration)
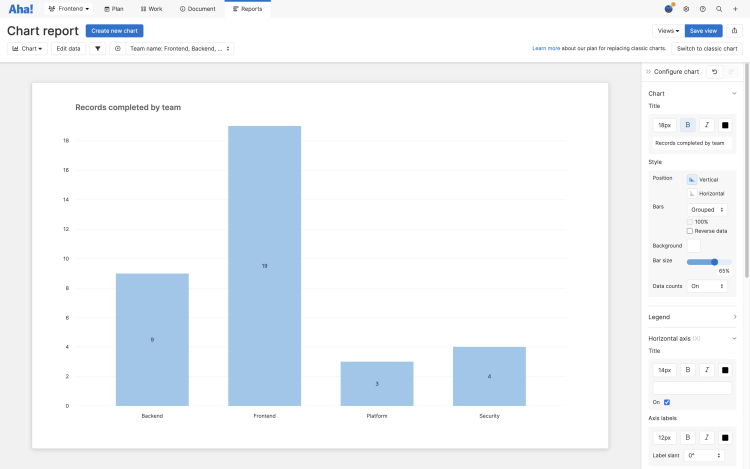
If you have integrated your Aha! Develops account with Aha! Roadmaps, you have access to custom charts. A chart is a beautiful way to visualize data. Use them to highlight the most important aspects of your reports for your team and stakeholders.
Dashboards (Aha! Roadmaps integration)
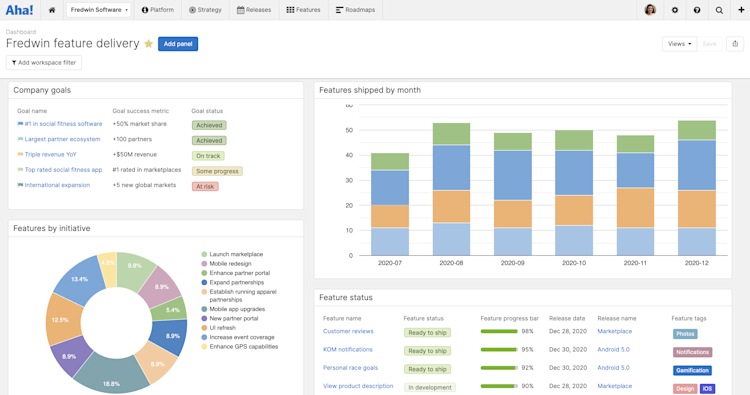
If you have integrated your Aha! Develops account with Aha! Roadmaps, you have access to dashboards. Use dashboards to organize reports, charts, and roadmaps into a single view. Because dashboards are collections of Aha! Roadmaps views, you can click into any of the data they display to open a record's drawer view. This way, you can adjust details, answer questions, or analyze more deeply without ever leaving the page.
Planning
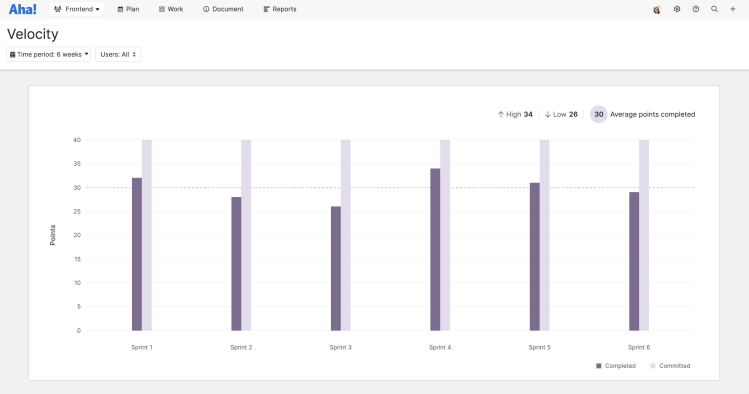
Velocity report
Use the velocity report to analyze your team's capacity. Whether you estimate in time or story points, historical velocity will suggest the amount of work your team should commit to in the next sprint. By default, the velocity report shows your average estimates completed for the last six sprints and for your entire team. You can filter it for a different time frame or for specific team members.
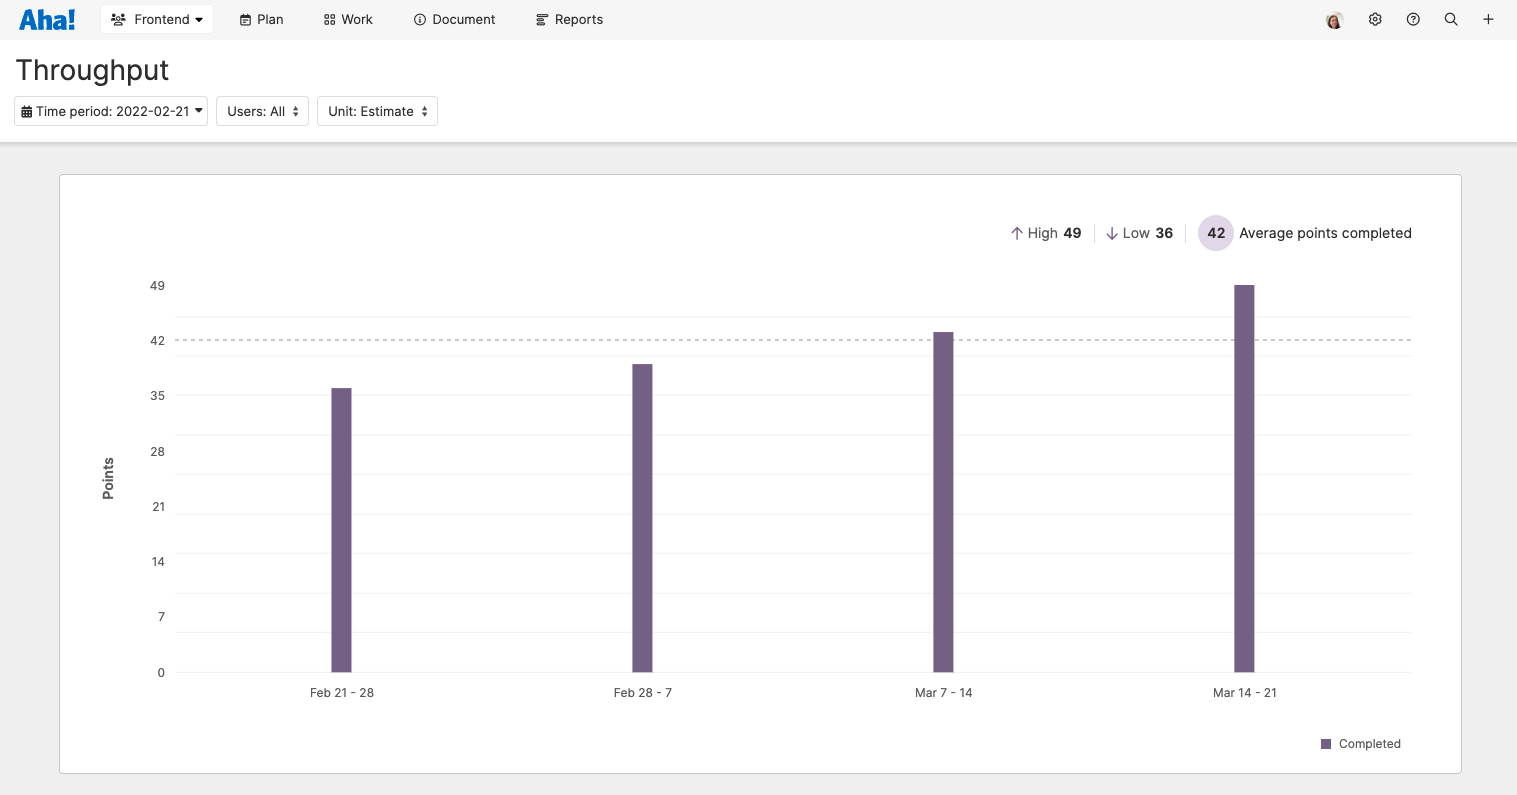
Throughput report
Use the throughput report to visualize your team's performance trends. If your team uses the workflow board, this report will show you how much work your team completes in an average week. By default, the throughput report shows your entire team's throughput over the last six weeks. You can filter it for a different time frame or for specific team members.
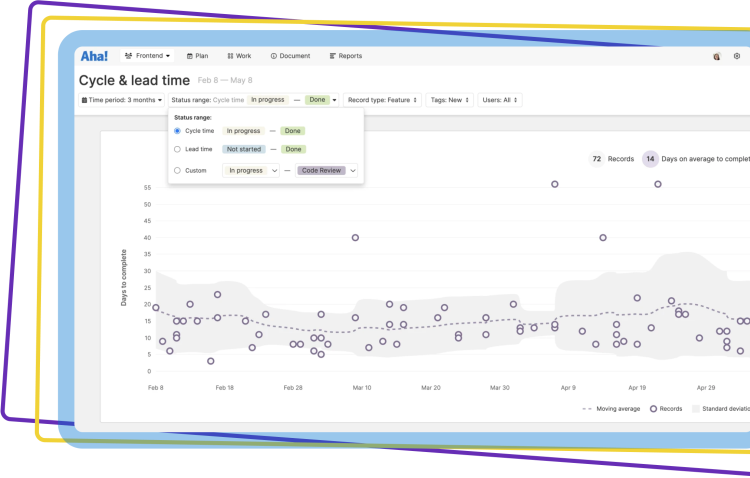
Cycle and lead time report
Use the cycle time report understand how quickly your team delivers new functionality and forecast future performance. This report works for teams that rely on either sprints or the workflow board, and includes several filters to help you focus on the appropriate time period and work. Filter the report for a specific workflow status range, record type, or tag.
In development
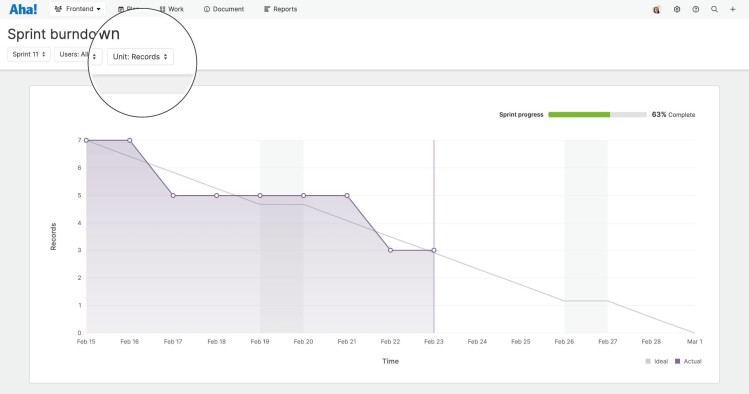
Burndown chart
Use the burndown chart to track sprint progress. Each sprint detail view includes a burndown of the current sprint. For deeper analysis, navigate to Reports Burndown and report on a past or current sprint. You can filter any burndown chart by individual team members, or focus on your entire team's progress.
Delivery risks
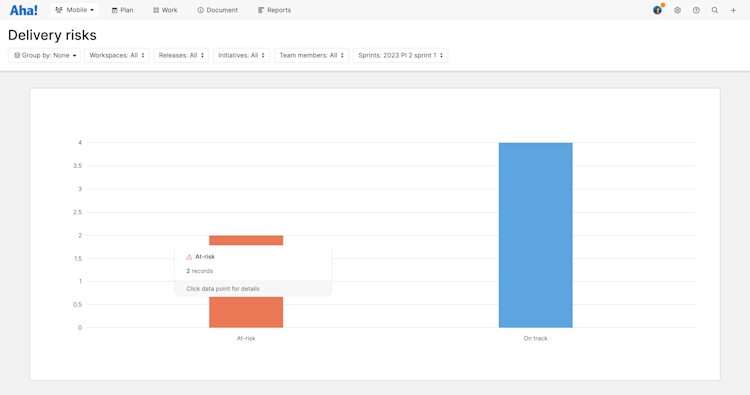
The delivery risks report highlight at-risk records so that you can resolve, own, accept, or mitigate trouble while it is still in your control. Thanks to alerts on the program increments view, this report is especially effective for teams that use the Scaled Agile Framework® (SAFe) for planning and delivering software. But it will work equally well for any team that uses automatic or manually flagged risk alerts.
Delivered
Work delivered report
Use the work delivered report to visualize completed records from an Aha! Roadmaps workspace — or expand it to visualize any records affected by a particular record event type. Filter it by Time frame, Team, or Event type, then save and share it with interested stakeholders.
Value delivered report
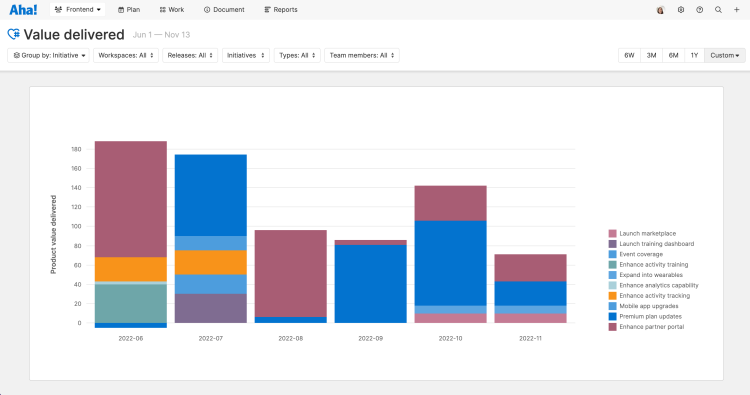
Use the value delivered report to highlight the product value that your team has delivered over a given time period. Group records by a particular release or strategic initiative, filter for specific record types, individual team members, or time frame. Click on any column to open a pre-built work delivered report of individual records, or stay in a high-level view of the value your team has delivered.
This report pairs well with the Aha! Roadmaps product value report. Like the Aha! Develop value delivered report, that report shows you a summary of the value delivered, but at every stage of your product development journey — so you can focus on delivering what customers truly care about.
Sprint retrospective report
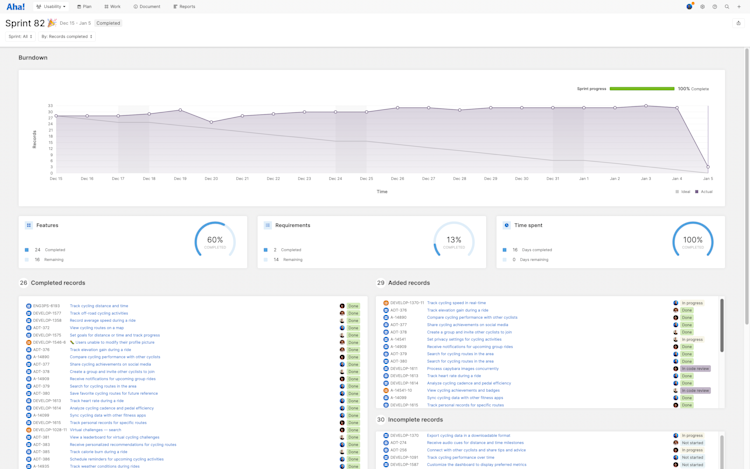
Use the sprint retrospective report to gather all the information you need to review your team's sprint. This report combines several other reports — burndown chart, velocity, and custom list — with overview and performance statistics so that you have all the information you need for a successful retrospective. Filter the report by sprint (including sprints still in progress) and by estimation units.
This report pairs perfectly with the Aha! Roadmaps release retrospective report.
- Documents
- Share documents
- Guest access
- Template library
- Notes
- AI writing assistant
- Introduction to whiteboards
- The whiteboard toolbar
- Add and edit whiteboard content
- Advanced whiteboard shapes
- Add media to whiteboards
- Collaborate on whiteboards
- Convert whiteboard content to Aha! records
- View Aha! records on whiteboards
- Create a whiteboard presentation
- Run a successful Aha! trial
- Get started with your new account
- How to build a roadmap in five steps
- Import data
- Explore a demo workspace in your account
- Explore a product workspace in your account
- Explore an IT workspace in your account
- Explore a project workspace in your account
- Explore a services workspace in your account
- Explore a business operations workspace in your account
- Explore a marketing workspace in your account
- How to create a custom whiteboard template
- How to build a roadmap in five steps
- How to visualize linked dependency statuses at scale
- How to import your backlog from Jira
- How to show the strategic progress at multiple levels
- How to identify schedule risks with calculation columns
- How to visualize cross-team capabilities with custom tables (Enterprise+)
- How to add a custom field
- How to pull work from Aha! Roadmaps into Aha! Develop
- How to share a report, roadmap, or view
- How to identify and prioritize high-value ideas
- How to import a Jira backlog into your Aha! account as ideas
- How to edit a status workflow
- How to build your product strategy
- How to host a collaborative brainstorming session
- Workspaces
- Workspaces and workspace lines
- Differences between workspace types
- Create a single-workspace hierarchy
- Create a multi-workspace hierarchy
- Create a portfolio hierarchy
- Workspace templates (Enterprise+)
- Archive or delete a workspace or workspace line
- How to define your product workspace
- Duplicate workspace and workspace line prefix error
- Account settings
- Account billing settings
- Account customization settings
- Workspace settings
- Workspace ideas settings
- Workspace import settings
- Integration settings
- Manage your workspace settings
- Personal settings
- Shortcuts
- Import data from a CSV file
- Import notes from Confluence
- Getting started with capacity planning (Enterprise+)
- Individual capacity planning
- Configure team capacity planning (Enterprise+)
- Estimate work for capacity planning (Enterprise+)
- Automation (Enterprise+)
- Introduction to ideas
- Proxy votes
- Configure your ideas portal
- Manage ideas portal users
- Manage submitted ideas
- Ideas prioritization page
- Emailed ideas
- Submit-only ideas portal
- Private ideas portal
- Public ideas portal
- Ideas overview page
- Ideas chart page
- Create a central workspace to manage all ideas
- How promoted record status drives idea status
- Configure your own ideas portal URL with a CNAME (Ideas Advanced plan)
- Carry over custom field values from ideas to other record types
- "Filter by status" displays duplicate statuses on ideas portal
- Create one ideas portal for all of your workspaces
- Advanced custom portal design
- Import ideas and portal users
- Custom fields for ideas
- Idea management notifications
- Ideas portal weekly summary email
- Manage portal spam
- Analyze ideas with AI
- Introduction to features
- Introduction to epics
- Introduction to requirements
- Tips for managing and prioritizing features
- User story maps
- Workflow board
- Feature scores
- Features prioritization page
- Mockups
- Copy, move, or bulk edit features
- When to use initiatives vs. epics
- Convert features to other record types
- Carry custom field values from requirements to features
- Estimate effort using custom scorecards
- Add feature start and due dates
- Create templates for features and requirements
- Should I put bugs on my product roadmap?
- Customize feature cards
- Use epics across releases and workspaces
- Introduction to analytics
- Dashboards
- Reports overview
- Step-by-step examples: List reports, pivot tables, and custom roadmaps
- Filter your reports and roadmaps
- List report
- Perform calculations on data in list reports
- Pivot table
- Charts
- Product value report
- Individuals capacity report
- Team capacity report (Enterprise+)
- Resolve capacity conflicts (Enterprise+)
- Troubleshoot missing records on the team capacity report (Enterprise+)
- Dependency report
- Hierarchy report
- Diagram report
- Bulk edit records
- Report on workspace documents
- Knowledge menu
- Documents
- Control workspace document access
- Frameworks
- Meetings
- Share documents
- Guest access
- Notes
- AI writing assistant
- Template library
- Introduction to whiteboards
- The whiteboard toolbar
- Add and edit whiteboard content
- Advanced whiteboard shapes
- Add media to whiteboards
- Collaborate on whiteboards
- Convert whiteboard content to Aha! records
- View Aha! records on whiteboards
- Add Jira records to whiteboards
- Add ADO work items to whiteboards
- Create a whiteboard presentation
- Files
- Statuses and workflows
- Workflow approvals
- Scorecard equations
- Automated scorecard metrics (Enterprise+)
- Custom fields
- Custom layouts
- Advanced custom layouts (Enterprise+)
- Introduction to advanced equations
- Field identifiers for advanced equations
- Custom equation functions and operators
- Filter arrays with logical operators
- Custom tables (Enterprise+)
- Custom worksheets (Enterprise+)
- Manage at-risk work
- Reference Aha! Roadmaps fields in custom worksheet equations (Enterprise+)
- Link custom tables to each other (Enterprise+)
- Use custom tables to manage strategic opportunities
- Track special customer information
- Best practices for stakeholder alignment: Set product strategy
- Best practices for stakeholder alignment: Review customer feedback
- Best practices for stakeholder alignment: Prioritize the best ideas
- Best practices for stakeholder alignment: Create your product roadmap
- Best practices for stakeholder alignment: Manage product launches
- Best practices for stakeholder alignment: Communicate roadmap progress
- Best practices for linking your work to strategy
- Best practices for tracking OKRs
- Best practices for configuring Aha! to support SAFe®
- Best practices for configuring Aha! to support the Pragmatic Framework
- Best practices for tracking product development risks
- Best practices for managing cross-functional requests
- Best practices for setting product strategy
- Best practices for capturing and prioritizing customer ideas
- Best practices for launching your ideas portal
- Best practices for managing product platforms
- Best practices for managing solution offerings
- Best practices for managing product components
- Best practices for managing complex product bundles
- Best practices for creating a product information hub
- Best practices for using documents to collaborate with stakeholders
- Enterprise+ plan features
- Advanced custom layouts (Enterprise+)
- Automated scorecard metrics (Enterprise+)
- Automation (Enterprise+)
- Back up your account (Enterprise+)
- Configure team capacity planning (Enterprise+)
- Custom roles (Enterprise+)
- Custom tables (Enterprise+)
- Custom worksheets (Enterprise+)
- Enable IP address based access control (Enterprise+)
- Estimate work for capacity planning (Enterprise+)
- Getting started with capacity planning (Enterprise+)
- Integrate with security webhooks (Enterprise+)
- Link custom tables to each other (Enterprise+)
- Monitor your account activity (Enterprise+)
- Reference Aha! Roadmaps fields in custom worksheet equations (Enterprise+)
- Resolve capacity conflicts (Enterprise+)
- Team capacity report (Enterprise+)
- Work requests (Enterprise+)
- Workspace templates (Enterprise+)
- Account SSO | SAML 2.0
- Account SSO | Google Cloud Identity
- Account SSO | Okta
- Account SSO | OneLogin
- Account SSO | Microsoft Entra ID
- Account SSO | Microsoft Active Directory Federation Services (ADFS)
- Account SSO | Bitium
- Portal SSO | SAML 2.0
- Portal SSO | OpenID Connect
- Portal SSO | JSON Web Token
- Portal SSO | Google Cloud Identity
- Portal SSO | OneLogin
- Portal SSO | Entra ID
- Portal SSO | Microsoft Active Directory Federation Services (ADFS)
- Portal SSO | Salesforce
- Portal SSO | Link portal users to organizations (Advanced plan)
- Knowledge base SSO | SAML 2.0 (Aha! Knowledge Advanced plan)
- Knowledge base SSO | OpenID Connect (Aha! Knowledge Advanced)
- Knowledge base SSO | JSON Web Token (Aha! Knowledge Advanced)
- Knowledge base SSO | Google Cloud Identity (Aha! Knowledge Advanced)
- Knowledge base SSO | OneLogin (Aha! Knowledge Advanced)
- Knowledge base SSO | Entra ID (Aha! Knowledge Advanced)
- Knowledge base SSO | Microsoft Active Directory Federation Services (ADFS) (Aha! Knowledge Advanced)
- Knowledge base SSO | Salesforce (Aha! Knowledge Advanced)
- Troubleshoot single sign-on issues
- How to think about integrating Aha! Roadmaps with your development tool
- Manage your integrations
- Create multiple development tool integrations for a single workspace
- Integrate one workspace with multiple third-party systems
- Integrate with your calendar application
- Allow list IP addresses for on-premises development tools
- Manually send Aha! Roadmaps records to development tools
- Import data from your development system
- Create an integration template
- Map fields between Aha! Roadmaps and your development system
- Configure links between integrated records
- View integration log messages
- How to diagnose development tool integration log messages
- Convert an integration from 1.0 to 2.0
- Move records with Jira or Rally
- Link records in Aha! Roadmaps with existing records in another system
- Send changes and accept imports from another system
- Resync Aha! Roadmaps with your development tool
- Move a linked record to another workspace
- Map a single Aha! Roadmaps record type to multiple development system record types
- Integrate a single workspace with multiple projects from the same development tool
- Send records in bulk to integrated tools
- Import error: no valid relationship link
- Integrate with Azure DevOps
- Recommended Azure DevOps mappings
- Sync sprints with Azure DevOps
- Azure DevOps Services Error: "Configuration error for 'installed': getaddrinfo: Name or service not known"
- Integrate with Azure DevOps Services or Azure DevOps Server (version 1.0)
- Use the Azure DevOps integration through a web proxy
- Integration guides
- Integrate with Jira
- Detailed Jira integration instructions
- Recommended Jira mappings
- Integrate with Jira Server on-premises
- Migrate from Jira Server to Jira Cloud
- Use the Jira integration through a web proxy
- Integrate with Jira next-gen projects
- Sync sprints between Aha! Roadmaps and Jira
- Track capacity between Aha! Roadmaps and Jira
- Use webhooks for Jira integrations
- When multiple webhooks are needed and why
- Integrate a single Aha! Roadmaps workspace with multiple Jira projects
- Integrate with Jira when each project has one record type
- Map records between Aha! Roadmaps and Jira Core
- Integrate with Jira (version 1.0)
- Jira integration guides
- Integrate with Salesforce (Advanced plan)
- Gather customer feedback with Salesforce (Advanced plan)
- Link Aha! Roadmaps and Salesforce records in bulk (Advanced plan)
- Integrate with Salesforce for idea capture (Legacy access)
- Salesforce application release notes
- Import Salesforce links by CSV (Advanced plan)
- Introduction to idea management
- Ideas overview page
- Idea visibility
- Ideas prioritization page
- Priorities chart
- Manage submitted ideas
- Idea management notifications
- Emailed ideas
- Proxy votes (Advanced plan)
- Segments (Advanced plan)
- Organizations (Advanced plan)
- Contacts (Advanced plan)
- AI-powered idea exploration (Advanced plan)
- Salesforce opportunity report (Advanced plan)
- Analyze ideas with AI (Advanced plan)
- Introduction to ideas portals
- Configure your ideas portal
- Advanced custom portal design
- Manage ideas portal users
- Import users and data
- Public ideas portal
- Private ideas portal
- Submit-only ideas portal
- Ideas portal weekly summary email
- Display multiple languages in your portal (Advanced plan)
- Create a custom ideas portal domain (Advanced plan)
- Custom pages (Advanced plan)
- Polls (Advanced plan)
- Manage portal spam
- Schedule an empathy session (Advanced plan)
- Prepare an empathy session (Advanced plan)
- Run an empathy session (Advanced plan)
- Introduction to the community feedback widget (Advanced plan)
- Introduction to the polls widget (Advanced plan)
- Introduction to the in-app idea submission widget (Advanced plan)
- Install in-app feedback widgets in your web application (Advanced plan)
- Frequently asked questions about in-app feedback widgets (Advanced plan)
- Documents
- Share documents
- Guest access
- Template library
- Notes
- AI writing assistant
- Meetings
- Introduction to whiteboards
- Add and edit whiteboard content
- Advanced whiteboard shapes
- Add media to whiteboards
- The whiteboard toolbar
- Collaborate on whiteboards
- Convert whiteboard content to ideas
- View Aha! records on whiteboards
- Create a whiteboard presentation
- Portal SSO | SAML 2.0
- Portal SSO | JSON Web Token
- Portal SSO | OpenID Connect
- Portal SSO | Google Cloud Identity
- Portal SSO | Salesforce
- Portal SSO | OneLogin
- Portal SSO | Entra ID
- Portal SSO | Microsoft Active Directory Federation Services (ADFS)
- Share your SSO configuration between ideas portals (Advanced plan)
- Portal SSO | Troubleshoot single sign-on issues
- Portal SSO | Link portal users to organizations (Advanced plan)
- Add a new whiteboard
- Annotation shapes
- Bulk edit
- Clip images
- Copy or paste style
- Crop images
- Custom colors
- Custom templates
- Edit image opacity and overlay
- Frames
- Group, align, and reorder content
- How to create a custom template
- Icons
- Images and media
- Lines and connectors
- Milestones shapes
- Navigate whiteboards
- Pen tool
- Progress bars
- Shapes
- Show whiteboard grid
- Show sticky note author
- Sticky notes
- Templates
- Text boxes
- The whiteboard toolbar
- Timeline shapes
- Whiteboard shortcuts
- Whiteboard tables
- Wireframes
- Account profile settings
- Account billing settings
- Account customization settings
- Team settings
- Team status automation settings (Develop Advanced)
- Team import settings
- Personal settings
- Shortcuts
- Import data from a CSV file
- Import notes from Confluence
- Import Trello cards and lists
- Automation (Advanced plan)
- Introduction to extensions
- Extension library
- Build your first extension
- Build your first importer extension
- Create an extension
- Extension contribution types
- Importer extension contributions
- View extension contributions
- Command extension contributions
- Event handler extension contributions
- Endpoint extension contributions
- Settings extension contributions
- Store extension data
- Write extension contribution code
- Install an extension
- Debug an extension
- Package.json file format
- Extension API reference
- CLI reference
- GraphQL API
- Model API
- Extension fields
- Extensions security model
- Documents
- Share documents
- Guest access
- Template library
- Notes
- AI writing assistant
- The text editor
- Introduction to whiteboards
- The whiteboard toolbar
- Add and edit whiteboard content
- Advanced whiteboard shapes
- Add media to whiteboards
- Collaborate on whiteboards
- Create wireframes on whiteboards
- Convert whiteboard content to Aha! records
- View Aha! records on whiteboards
- Introduction to reports (Advanced plan)
- Velocity report (Advanced plan)
- Throughput report (Advanced plan)
- Cycle time report (Advanced plan)
- Burndown chart (Advanced plan)
- Delivery risk report (Advanced plan)
- Value delivered report (Advanced plan)
- Work delivered report (Advanced plan)
- Sprint retrospective report (Advanced plan)
- Report on team documents
- Learn about how we build software at Aha!
- Take control of your technical product info
- Streamline PI planning
- When to use the Now, Next, Later roadmap (or not)
- Launch an ideas portal for your customers
- Drive launch success with the new Gantt chart
- Go from whiteboards to your roadmap — and back
- KPI dashboards for product managers
- Gain executive alignment on your product roadmap
- How to build your 2024 product roadmap
- Is bad capacity planning destroying your roadmap?
- Boost customer research with AI
- How to integrate with Salesforce
- One place for your product notes and whiteboards
- Better ways to track dependencies
- Explore the world of advanced reporting
- Create reports like a product pro
- Aha! and Pragmatic Marketing = Product management success
- How to integrate with Jira
- Learn the newest way to score features
- How to keep product managers and engineers in sync
- Build impressive roadmaps with the right details
- Understand the customers behind the ideas
- Build your best roadmap presentation
- The best new ways to gather feedback
- Create a beautiful ideas portal
- Say "yes" or "no" to features
- Organize your work with custom layouts
- Advanced features for complex work
- 3 most popular new roadmap features
- How to create the perfect workflow
- Roadmaps overview
- Data model overview
- Set up your Aha! Roadmaps account
- Set up your workspace
- Build your first roadmap
- Launch your ideas portal
- Integrations overview
- Features overview
- Releases overview
- Strategy overview
- Getting started
- Notes overview
- Reports overview
- Presentations overview
- Notifications overview
- Idea management overview
- How to import your data
- How to set strategic goals
- How to estimate and track product value
- How to build a strategy roadmap
- How to research and evaluate competitors
- How to configure your Jira integration
- How to edit a status workflow
- How to prioritize work with the Aha! score
- How to visualize dates and dependencies
- How to import your Jira backlog
- How to create a release template
- How to include calculation columns in pivot tables
- How to create a calendar report
- How to create a features roadmap
- How to create a portfolio roadmap
- How to customize feature cards
- How to organize your hierarchy report
- How to create a clear vision
- How to customize your ideas portal
- How to share visual roadmaps via your ideas portal
- How to identify and prioritize high-value ideas
- How to promote ideas to your roadmap
- How to import ideas into your account
- Customize your ideas portal
- How to integrate with Salesforce
- Boost customer research with AI
- How to configure your Salesforce integration (Ideas Advanced)
- How to import organizations from Salesforce (Ideas Advanced)
- Drive more revenue with the Salesforce opportunity report (Ideas Advanced)
- July 26, 2024 release notes
- July 19, 2024 release notes
- July 12, 2024 release notes
- June 28, 2024 release notes
- June 21, 2024 release notes
- June 14, 2024 release notes
- June 7, 2024 release notes
- May 31, 2024 release notes
- May 24, 2024 release notes
- May 17, 2024 release notes
- May 9, 2024 release notes
- May 3, 2024 release notes
- April 26, 2024 release notes
- April 19, 2024 release notes
- April 12, 2024 release notes
- April 5, 2024 release notes
- March 29, 2024 release notes
- March 28, 2024 Pending replacement of mockups
- March 22, 2024 release notes
- March 15, 2024 release notes
- March 12, 2024 Announcing Aha! Whiteboards and Aha! Knowledge
- March 8, 2024 release notes
- March 1, 2024 release notes
- February 29, 2024 Pending Jira parent field deprecation
- February 23, 2024 release notes
- February 16, 2024 release notes
- February 9, 2024 release notes
- February 2, 2024 release notes
- January 26, 2024 release notes
- January 19, 2024 release notes
- January 12, 2024 release notes
- January 5, 2024 release notes
- July 25, 2024 Give your product docs more visual flair
- July 18, 2024 Enable SSO in your Aha! Knowledge or Aha! Whiteboards account
- July 11, 2024 Control who can modify and view product documentation
- July 9, 2024 Consolidate idea research in one place
- June 27, 2024 Add custom fields to documents
- June 18, 2024 A breakthrough way to define how you work
- June 11, 2024 Share interactive Now, Next, Later roadmaps
- June 6, 2024 Import ideas and features directly onto your whiteboard
- May 28, 2024 Run confidence voting sessions during PI planning
- May 23, 2024 Add interactive roadmap views to whiteboards
- May 21, 2024 Introducing the Salesforce opportunity report
- May 16, 2024 More efficient product meetings
- May 14, 2024 New Slack integration
- May 9, 2024 New Aha! Whiteboards + Jira integration
- May 7, 2024 A new way to view dependencies
- April 25, 2024 Craft compelling presentations on whiteboards
- April 18, 2024 Single sign-on (SSO) for your product knowledge base
- April 16, 2024 Share more information with customers about their ideas
- April 9, 2024 AI-powered feature research is here 🪄
- March 26, 2024 New filters for Gantt charts
- March 7, 2024 OKRs are here
- February 28, 2024 Track changes to your features roadmap
- February 13, 2024 New product value report
- January 30, 2024 Improved ideas portal filter
- January 23, 2024 Releases + epics + features in a single Gantt
- January 16, 2024 Estimate work in custom ways
- January 9, 2024 Link to external research to consolidate your customer insights
- December 29, 2023 release notes
- December 22, 2023 release notes
- December 15, 2023 release notes
- December 8, 2023 release notes
- December 1, 2023 release notes
- November 17, 2023 release notes
- November 10, 2023 release notes
- November 3, 2023 release notes
- October 27, 2023 release notes
- October 20, 2023 release notes
- October 13, 2023 release notes
- October 6, 2023 release notes
- September 29, 2023 release notes
- September 22, 2023 release notes
- September 15, 2023 release notes
- September 8, 2023 release notes
- September 1, 2023 release notes
- August 25, 2023 release notes
- August 18, 2023 release notes
- August 11, 2023 release notes
- August 4, 2023 release notes
- July 28, 2023 release notes
- July 21, 2023 release notes
- July 14, 2023 release notes
- July 7, 2023 release notes
- June 30, 2023 release notes
- June 30, 2023 removing Google Analytics integration
- June 23, 2023 release notes
- June 16, 2023 release notes
- June 9, 2023 release notes
- June 2, 2023 release notes
- May 26, 2023 release notes
- May 19, 2023 release notes
- May 12, 2023 release notes
- May 5, 2023 release notes
- April 28, 2023 release notes
- April 21, 2023 release notes
- April 14, 2023 release notes
- April 7, 2023 release notes
- March 31, 2023 release notes
- March 24, 2023 release notes
- March 17, 2023 release notes
- March 10, 2023 release notes
- March 6, 2023 upcoming navigation change
- March 3, 2023 release notes
- February 23, 2023 release notes
- February 17, 2023 release notes
- February 10, 2023 release notes
- February 3, 2023 release notes
- January 27, 2023 release notes
- January 20, 2023 release notes
- January 13, 2023 release notes
- January 6, 2023 release notes
- December 19, 2023 Capture more product feedback in Salesforce
- December 12, 2023 Set default views for each workspace
- December 7, 2023 Introducing wireframes in whiteboards
- November 30, 2023 Invite guests to collaborate on documents
- November 16, 2023 Export pivot reports to whiteboards
- November 14, 2023 Encourage more feedback with the new idea visibility setting
- November 9, 2023 Create personal document templates
- October 31, 2023 Draft release notes with AI
- October 26, 2023 View dependencies on whiteboards
- October 19, 2023 Embed videos and GIFs in whiteboards
- October 17, 2023 The new prioritization view for initiatives is here
- October 12, 2023 Add a template to an existing note
- October 10, 2023 New retrospective reports
- October 3, 2023 See what launched in Q3
- September 28, 2023 Add emoji reactions on whiteboards
- September 26, 2023 New template to help customers share their ideas with you
- September 21, 2023 Improved tables in whiteboards
- September 19, 2023 Your features roadmap has a new look
- September 14, 2023 Capture feedback directly in whiteboards
- September 12, 2023 Aha! Ideas Advanced + Salesforce
- September 7, 2023 New ways to collaborate with key stakeholders
- August 24, 2023 Finally, one place for your notes and whiteboards
- August 22, 2023 Set up recurring to-dos
- August 15, 2023 Introducing AI-powered ideas exploration
- August 8, 2023 Fresh look for Gantt charts
- August 3, 2023 Create custom whiteboard templates
- July 27, 2023 New whiteboard features to streamline teamwork
- July 25, 2023 We refreshed your Ideas Overview page
- July 20, 2023 Introducing Aha! Knowledge for teams
- July 18, 2023 Set realistic limits for product work
- July 13th, 2023 Access your previous prompts in the AI writing assistant
- July 11, 2023 Manage feature research in one place
- July 6, 2023 Highlights from Q2
- June 29, 2023 New ways to format text
- June 20, 2023 Drive more engagement in your ideas portal
- June 14, 2023 Visual refresh for custom roadmaps
- June 6, 2023 Streamline tasks with focused automations
- May 31, 2023 Now add notes and whiteboard users to your account
- May 31, 2023 Aha! Knowledge — Your Product Documents, Whiteboards, and Tasks in One Place
- May 25, 2023 Embed media files in documents
- May 23, 2023 New ServiceNow integration
- May 11, 2023 6 new whiteboard templates for business planning
- May 9, 2023 Better visibility into proxy votes for ideas
- May 4, 2023 New clip tool to cut images in whiteboards
- April 20, 2023 Introducing our new AI writing assistant
- April 18, 2023 New way to manage dependencies
- April 13th, 2023 40 Note and whiteboard templates for product managers
- April 11, 2023 Manage risks at scale
- April 4, 2023 11 most popular Aha! software features launched in Q1 2023
- March 30, 2023 6 New whiteboard templates to start building your product roadmap
- March 28, 2023 New customer revenue insights
- March 23, 2023 Add timelines and progress bars to whiteboards
- March 21, 2023 Coming soon! Feature cards get a fresh look
- March 16, 2023 Add tables to whiteboards
- March 14, 2023 New poll options to gather feedback
- March 9, 2023 More improvements to whiteboards
- March 8, 2023 A new way to share priorities with engineering
- February 23, 2023 Introducing a new program board for PI planning
- February 15, 2023 Private comments now supported in ideas portals
- February 8, 2023 Manage risks and release on schedule
- February 2, 2023 Manage team schedule changes
- January 25, 2023 Share workspace documents broadly
- January 19, 2023 Do more with whiteboards
- January 11, 2023 Catch up with the latest Aha! updates
- December 30, 2022 release notes
- December 23, 2022 release notes
- December 16, 2022 release notes
- December 9, 2022 release notes
- December 2, 2022 release notes
- November 18, 2022 release notes
- November 11, 2022 release notes
- November 4, 2022 release notes
- October 28, 2022 release notes
- October 25, 2022 Aha! Create is now available for everyone
- October 21, 2022 release notes
- October 14, 2022 release notes
- October 7, 2022 release notes
- September 30, 2022 release notes
- September 23, 2022 release notes
- September 16, 2022 release notes
- September 9, 2022 release notes
- September 2, 2022 release notes
- August 31, 2022 saved list views scheduled migration
- August 26, 2022 release notes
- August 19, 2022 release notes
- August 12, 2022 release notes
- August 5, 2022 release notes
- July 29, 2022 release notes
- July 22, 2022 release notes
- July 15, 2022 release notes
- July 8, 2022 release notes
- July 1, 2022 release notes
- June 24, 2022 release notes
- June 17, 2022 release notes
- June 10, 2022 release notes
- June 3, 2022 release notes
- May 27, 2022 release notes
- May 20, 2022 release notes
- May 13, 2022 release notes
- April 29, 2022 release notes
- April 22, 2022 release notes
- April 15, 2022 release notes
- April 8, 2022 release notes
- April 1, 2022 release notes
- March 25, 2022 release notes
- March 18, 2022 release notes
- March 11, 2022 release notes
- March 4, 2022 release notes
- February 25, 2022 release notes
- February 18, 2022 release notes
- February 11, 2022 release notes
- February 4, 2022 release notes
- January 28, 2022 release notes
- January 21, 2022 release notes
- January 14, 2022 release notes
- January 7, 2022 release notes
- December 21, 2022 New roadmaps and reports for dashboards
- December 7, 2022 Visualize how all layers of strategy connect to your everyday work
- November 30, 2022 Start gathering more customer feedback with in-app polls
- November 16, 2022 A better way to measure engineering impact
- November 9, 2022 Share personal whiteboards with anyone
- November 3, 2022 See cross-team dependencies on timeline views
- October 25, 2022 Aha! Knowledge is now available for everyone
- October 19, 2022 Introducing program increments for SAFe® teams
- October 13, 2022 Highlights from Q3
- October 5, 2022 Bring individual and team capacity planning together
- September 28, 2022 Better estimate engineering work
- September 22, 2022 Plan work your team can actually complete
- September 21, 2022 Sync user fields in Salesforce with Aha! Ideas
- September 14, 2022 New prioritization page for scoring and ranking work
- September 9, 2022 Scheduled system upgrade
- August 31, 2022 Scheduled migration of saved list views
- August 25, 2022 Quickly identify stalled work
- August 18, 2022 Organize notes by date with a new calendar view
- August 10, 2022 Work more efficiently with new right-click menus
- August 3, 2022 SSO for shared webpages
- July 27, 2022 A new "My organization" view for ideas portal users
- July 21, 2022 Sync feature statuses with your dev tools
- July 15, 2022 New ways to customize feature cards in Aha! software
- July 6, 2022 The Most Popular Aha! Software Features From Q2 2022
- June 29, 2022 Estimate work by team member during capacity planning
- June 15, 2022 Introducing Whiteboards For Product Builders
- June 8, 2022 Introducing polls for quantitative feedback
- June 2, 2022 Connect Aha! Develop to GitHub Actions
- May 27, 2022 Try these productivity boosters
- May 26, 2022 Sync Salesforce opportunity details with Aha! Ideas
- May 19, 2022 New ideas importer for Aha! Develop
- May 18, 2022 Create Custom Workspace Templates in Aha! Roadmaps
- May 12, 2022 How quickly do you deliver work
- May 11, 2022 New reports for idea management
- April 28, 2022 Enhanced reporting
- April 27, 2022 Automate the sending of reports
- April 22, 2022 Are your product and engineering teams in sync?
- April 21, 2022 Integrate Aha! Develop with Salesforce Service Cloud
- April 20, 2022 Automatically Update Scorecard Metrics
- April 14, 2022 Connect Aha! Develop to Azure Pipelines
- April 13, 2022 The new product value scorecard
- April 7, 2022 More tailored workflow views
- April 6, 2022 Sync accounts in Salesforce with organizations in Aha! Ideas
- April 1, 2022 Live tutorial: Build impressive roadmaps with the right details
- March 30, 2022 The top 9 Aha! launches in Q1 2022
- March 24, 2022 New throughput report for kanban teams
- March 23, 2022 Capacity planning views for agile teams
- March 17, 2022 Filter completed work on the workflow board
- March 8, 2022 New product — Aha! Knowledge
- March 3, 2022 New design extensions for Aha! Develop
- February 24, 2022 New burndown by record count
- February 17, 2022 Integrate Aha! Develop with Azure Repos
- February 16, 2022 Three new note templates for idea management
- February 10, 2022 Visualize and limit work in progress (WIP)
- February 9, 2022 Plan capacity across teams in story points
- February 3, 2022 Analyze team performance with the new velocity report
- January 27, 2022 Speed up sprint planning
- January 26, 2022 Add custom tabs to record layouts
- January 20, 2022 Bulk assign features to engineering
- January 19, 2022 Share your roadmap in your ideas portal
- January 13, 2022 Connect Aha! Develop to CircleCI
- January 5, 2022 Release templates now skip weekends
- December 30, 2021 release notes
- December 25, 2021 maintenance notice
- December 17, 2021 release notes
- December 10, 2021 release notes
- December 3, 2021 release notes
- November 19, 2021 release notes
- November 12, 2021 release notes
- November 5, 2021 release notes
- November 4, 2021 Aha! presentations update
- October 29, 2021 release notes
- October 22, 2021 release notes
- October 15, 2021 release notes
- October 8, 2021 release notes
- October 1, 2021 release notes
- September 27, 2021 terms of service update
- September 24, 2021 release notes
- September 17, 2021 release notes
- September 10, 2021 release notes
- September 3, 2021 release notes
- August 27, 2021 release notes
- August 20, 2021 release notes
- August 13, 2021 release notes
- August 6, 2021 release notes
- July 30, 2021 release notes
- July 23, 2021 release notes
- July 16, 2021 release notes
- July 9, 2021 release notes
- July 2, 2021 release notes
- June 29, 2021 Removing inbound TLS 1.0/1.1 support
- June 25, 2021 release notes
- June 18, 2021 release notes
- June 11, 2021 release notes
- June 4, 2021 release notes
- May 28, 2021 release notes
- May 21, 2021 release notes
- May 14, 2021 release notes
- May 7, 2021 release notes
- April 30, 2021 release notes
- April 23, 2021 release notes
- April 16, 2021 release notes
- April 14, 2021 Update to chart design
- April 9, 2021 release notes
- April 9, 2021 API update for ideas coming April 17
- April 2, 2021 release notes
- March 26, 2021 release notes
- March 19, 2021 release notes
- March 12, 2021 release notes
- March 5, 2021 release notes
- February 26, 2021 release notes
- February 19, 2021 release notes
- February 12, 2021 release notes
- February 5, 2021 release notes
- January 29, 2021 release notes
- January 22, 2021 release notes
- January 15, 2021 release notes
- January 8, 2021 release notes
- December 16, 2021 Is your current sprint on track?
- December 15, 2021 Promote ideas to requirements
- December 9, 2021 New Aha! Develop and GitLab integration
- December 8, 2021 Analyze customer feedback by segment
- December 2, 2021 Unify product and engineering work into a prioritized backlog
- November 19, 2021 Add custom swimlanes to your workflow board
- November 17, 2021 Track and report on progress more reliably
- November 10, 2021 Enhanced Aha! Ideas + Salesforce Lightning integration
- November 4, 2021 Import issues from Sentry into Aha! Develop
- November 3, 2021 Help your audience view the data they care about
- October 28, 2021 Align product and engineering teams on the status of work
- October 21, 2021 Have you tried our GitHub extension?
- October 20, 2021 Automation is now part of Aha! Ideas Advanced
- October 14, 2021 Try new note templates and build better docs
- October 13, 2021 Visualize capacity by person in story points
- October 7, 2021 Try Aha! Develop in dark mode
- October 6, 2021 New! Interactive roadmap presentations
- September 29, 2021 The best new features from Q3
- September 23, 2021 Set estimates in time
- September 22, 2021 A new way to link customers to features
- September 16, 2021 Move data into Aha! Develop from anywhere
- September 9, 2021 No-code automation in Aha! Develop
- September 8, 2021 Better capacity planning for teams
- September 2, 2021 Quickly get data from Rally into Aha! Develop
- September 1, 2021 Aha! + Azure DevOps enhancement
- August 26, 2021 Add code-based automations to extensions
- August 19, 2021 Single sign-on (SSO) is available
- August 18, 2021 View dependencies on custom roadmaps
- August 11, 2021 Aha! Develop is now available for everyone
- August 4, 2021 More options for creating the perfect dashboard
- July 28, 2021 New insights about every captured idea
- July 21, 2021 A new way to manage work requests
- July 14, 2021 New! Custom templates for initiatives and epics
- June 30, 2021 6 new features you might have missed
- June 16, 2021 Faster report filtering is here
- June 9, 2021 New ways to organize and format text
- June 3, 2021 Track feedback by person
- May 26, 2021 New product for agile development teams
- May 19, 2021 Highlight important requests in your ideas portal
- May 5, 2021 Different ideas forms for each portal
- April 28, 2021 Enhanced capacity report for teams
- April 21, 2021 A better way to view requirements
- April 14, 2021 A totally new charting experience
- April 7, 2021 New record type — "organization"
- March 31, 2021 The top 6 new Aha! features in Q1 2021
- March 24, 2021 Automatically sync the status of epics and features
- March 19, 2021 Live tutorial: Create a beautiful ideas portal
- March 17, 2021 Include strategy roadmaps and Gantt charts in your reporting dashboards
- March 10, 2021 Enhanced visibility options for ideas portals
- March 03, 2021 Lock fields based on the status of the record
- February 24, 2021 Create and share custom note templates
- February 17, 2021 Introducing in-app idea submission
- February 3, 2021 Improved single sign-on for multiple ideas portals
- January 27, 2021 Better idea management with dynamic forms
- January 14, 2021 Text editor improvements
- January 7, 2021 New ways to manage custom fields
- December 18, 2020 release notes
- December 4, 2020 release notes
- November 20, 2020 release notes
- November 13, 2020 release notes
- November 6, 2020 release notes
- October 30, 2020 release notes
- October 23, 2020 release notes
- October 20, 2020 release note
- October 16, 2020 release notes
- October 9, 2020 release notes
- October 2, 2020 release notes
- September 25, 2020 release notes
- September 18, 2020 release notes
- September 11, 2020 release notes
- September 4, 2020 release notes
- August 28, 2020 release notes
- August 21, 2020 release notes
- August 14, 2020 release notes
- August 7, 2020 release notes
- July 31, 2020 release notes
- July 17, 2020 release notes
- July 10, 2020 release notes
- July 1, 2020 release notes
- June 26, 2020 release notes
- June 19, 2020 release notes
- June 12, 2020 release notes
- June 5, 2020 release notes
- June 4, 2020 retiring support for Internet Explorer 11 on August 4, 2020
- May 29, 2020 release notes
- May 22, 2020 release notes
- May 14, 2020 release notes
- May 8, 2020 release notes
- May 1, 2020 release notes
- April 24, 2020 release notes
- April 17, 2020 release notes
- April 10, 2020 release notes
- April 3, 2020 release notes
- March 27, 2020 release notes
- March 20, 2020 release notes
- March 13, 2020 release notes
- March 6, 2020 release notes
- February 28, 2020 release notes
- February 21, 2020 release notes
- February 19, 2020 Azure DevOps Services authentication update
- February 14, 2020 release notes
- February 7, 2020 release notes
- January 31, 2020 release notes
- January 23, 2020 release notes
- January 17, 2020 release notes
- January 10, 2020 release notes
- January 3, 2020 release notes
- December 16, 2020 New Workspace Filters in Dashboards
- December 13, 2020 Tutorial reminder: Organize your work with custom layouts
- December 6, 2020 Live tutorial: Organize your work with custom layouts
- December 2, 2020 New Ways to Understand Customers Through Empathy Sessions
- November 18, 2020 Improved Layouts for Managing Requirements and Initiatives
- November 11, 2020 Aha! Welcomes Industry Leaders to New Partner Program
- November 4, 2020 Introducing In-App Community Feedback
- October 28, 2020 Introducing Empathy Sessions
- October 20, 2020 Aha! Launches New Idea Management Software
- October 15, 2020 Embed Visual Roadmaps, Tables, And Charts in Notes
- October 6, 2020 Customize Your Roadmap With Precise Date Range Controls
- September 30, 2020 Customize your layout
- September 23, 2020 Map New Fields From Jira and Rally to Aha!
- September 9, 2020 Coming soon! — a fresh new way to view detailed information in Aha!
- September 2, 2020 Share your product KPIs via a dashboard
- August 26, 2020 Quickly customize and brand your ideas portal
- August 19, 2020 Manage initiatives from the My work page
- August 12, 2020 Aha! + Confluence Data Center
- August 5, 2020 Organize Initiatives on the Strategy Roadmap
- July 21, 2020 New reporting dashboards
- July 19, 2020 Live tutorial: Advanced features for complex work
- July 15, 2020 Copy release templates
- July 7, 2020 Better organize your notes
- July 1, 2020 Auto-calculate release dates for large projects
- June 26, 2020 Upcoming terminology changes
- June 23, 2020 Tutorial reminder: 3 most popular new roadmap features
- June 17, 2020 Live tutorial: 3 most popular new roadmap features
- June 10, 2020 Share notes as webpages
- June 3, 2020 Aha! + Jira next-gen projects
- June 1, 2020 Retiring support for IE11 on August 4, 2020
- May 26, 2020 Create presentation themes in Aha!
- May 20, 2020 New automation rules to dynamically assign work
- May 13, 2020 New search capabilities in Aha!
- May 7, 2020 Scenario planning in Aha!
- April 28, 2020 New capacity planning for teams
- April 22, 2020 Create personal notes in Aha!
- April 21, 2020 Tutorial reminder: Create visual reports
- April 14, 2020 Live tutorial: Create visual reports
- April 7, 2020 New strategy roadmap
- April 1, 2020 Add tables to Aha! presentations
- March 25, 2020 Show progress bars on the features roadmap
- March 18, 2020 Add comments inline with the Aha! text editor
- March 15, 2020 Tutorial reminder: How to create the perfect workflow
- March 11, 2020 Add filters inline on roadmaps and reports
- March 8, 2020 Live tutorial: How to create the perfect workflow
- March 4, 2020 Crop images in Aha! presentations
- December 27, 2019 release notes
- December 20, 2019 release notes
- December 20, 2019 terms of service update
- December 13, 2019 release notes
- December 6, 2019 release notes
- November 22, 2019 release notes
- November 15, 2019 release notes
- November 8, 2019 release notes
- November 7, 2019 custom roadmap update
- November 1, 2019 release notes
- October 25, 2019 release notes
- October 18, 2019 release notes
- October 11, 2019 release notes
- October 4, 2019 release notes
- September 27, 2019 release notes
- September 20, 2019 release notes
- September 13, 2019 release notes
- September 6, 2019 release notes
- August 30, 2019 release notes
- August 23, 2019 release notes
- August 16, 2019 release notes
- August 9, 2019 release notes
- August 2, 2019 release notes
- July 24, 2019 release notes
- July 19, 2019 release notes
- July 12, 2019 release notes
- July 3, 2019 release notes
- June 28, 2019 release notes
- June 21, 2019 release notes
- June 14, 2019 release notes
- June 7, 2019 release notes
- May 31, 2019 release notes
- May 24, 2019 release notes
- May 20, 2019 notebooks update
- May 17, 2019 release notes
- May 10, 2019 release notes
- May 3, 2019 release notes
- April 26, 2019 release notes
- April 19, 2019 Jira authentication update
- April 19, 2019 release notes
- April 12, 2019 release notes
- April 5, 2019 release notes
- March 29, 2019 release notes
- March 22, 2019 release notes
- March 15, 2019 release notes
- March 8, 2019 release notes
- March 1, 2019 release notes
- February 22, 2019 release notes
- February 15, 2019 release notes
- February 8, 2019 release notes
- February 1, 2019 release notes
- January 25, 2019 release notes
- January 22, 2019 user interface navigation change
- January 18, 2019 release notes
- January 11, 2019 release notes
- January 4, 2019 release notes
- December 28, 2018 release notes
- December 26, 2018 terms of service update
- December 21, 2018 release notes
- December 17, 2018 report filters update
- December 14, 2018 release notes
- December 7, 2018 release notes
- November 30, 2018 release notes
- November 23, 2018 release notes
- November 16, 2018 release notes
- November 9, 2018 release notes
- November 2, 2018 release notes
- October 26, 2018 release notes
- October 19, 2018 release notes
- October 12, 2018 release notes
- October 6, 2018 maintenance notice
- October 5, 2018 release notes
- September 29, 2018 maintenance notice
- September 28, 2018 release notes
- September 21, 2018 release notes
- September 14, 2018 release notes
- September 7, 2018 release notes
- August 31, 2018 release notes
- August 24, 2018 release notes
- August 17, 2018 release notes
- August 10, 2018 release notes
- August 3, 2018 release notes
- July 27, 2018 release notes
- July 20, 2018 release notes
- July 13, 2018 release notes
- July 6, 2018 release notes
- June 29, 2018 release notes
- June 22, 2018 release notes
- June 15, 2018 release notes
- June 8, 2018 release notes
- June 1, 2018 release notes
- May 25, 2018 release notes
- May 18, 2018 release notes
- May 11, 2018 release notes
- May 4, 2018 release notes
- April 27, 2018 release notes
- April 20, 2018 release notes
- April 13, 2018 release notes
- April 6, 2018 release notes
- March 30, 2018 release notes
- March 23, 2018 release notes
- March 16, 2018 release notes
- March 9, 2018 release notes
- March 2, 2018 release notes
- February 28, 2018 user interface header redesign
- February 23, 2018 release notes
- February 16, 2018 release notes
- February 9, 2018 release notes
- February 2, 2018 release notes
- January 26, 2018 release notes
- January 22, 2018 Jira Cloud webhook update
- January 19, 2018 release notes
- January 12, 2018 release notes
- January 5, 2018 release notes
- December 29, 2017 release notes
- December 23, 2017 maintenance notice
- December 22, 2017 release notes
- December 14, 2017 release notes
- December 8, 2017 release notes
- December 1, 2017 release notes
- November 24, 2017 release notes
- November 17, 2017 release notes
- November 10, 2017 release notes
- November 3, 2017 release notes
- October 27, 2017 release notes
- October 20, 2017 release notes
- October 13, 2017 release notes
- October 6, 2017 release notes
- September 29, 2017 release notes
- September 22, 2017 release notes
- September 15, 2017 release notes
- September 1, 2017 release notes
- August 25, 2017 release notes
- August 18, 2017 release notes
- August 11, 2017 release notes
- August 4, 2017 release notes
- July 21, 2017 release notes
- July 14, 2017 release notes
- June 30, 2017 release notes
- June 23, 2017 release notes
- June 16, 2017 release notes
- June 2, 2017 release notes
- May 26, 2017 release notes
- May 19, 2017 release notes
- May 17, 2017 email notifications update
- May 12, 2017 release notes
- May 5, 2017 release notes
- April 28, 2017 release notes
- April 21, 2017 release notes
- April 14, 2017 release notes
- April 7, 2017 release notes
- March 31, 2017 release notes
- March 24, 2017 release notes
- March 17, 2017 release notes
- March 10, 2017 release notes
- March 3, 2017 release notes
- February 24, 2017 release notes
- February 17, 2017 release notes
- February 10, 2017 release notes
- February 3, 2017 release notes
- January 27, 2017 release notes
- January 13, 2017 release notes
- January 6, 2017 release notes
- January 8, 2016 release notes
- January 15, 2016 release notes
- January 22, 2016 release notes
- January 29, 2016 release notes
- February 5, 2016 release notes
- February 12, 2016 release notes
- February 19, 2016 release notes
- February 26, 2016 release notes
- March 11, 2016 release notes
- March 18, 2016 release notes
- March 25, 2016 release notes
- April 1, 2016 release notes
- April 8, 2016 release notes
- April 15, 2016 release notes
- April 22, 2016 release notes
- April 29, 2016 release notes
- May 13, 2016 release notes
- May 20, 2016 release notes
- May 27, 2016 release notes
- June 3, 2016 release notes
- June 17, 2016 release notes
- June 24, 2016 release notes
- July 8, 2016 release notes
- July 15, 2016 release notes
- July 22, 2016 release notes
- July 29, 2016 release notes
- August 5, 2016 release notes
- August 12, 2016 release notes
- August 19, 2016 release notes
- August 26, 2016 release notes
- September 2, 2016 release notes
- September 9, 2016 release notes
- September 16, 2016 Release Notes
- September 23, 2016 release notes
- September 30, 2016 release notes
- October 7, 2016 release notes
- October 10, 2016 custom fields update
- October 21, 2016 release notes
- October 28, 2016 release notes
- November 4, 2016 release notes
- November 14, 2016 release notes
- November 18, 2016 release notes
- November 25, 2016 release notes
- December 2, 2016 release notes
- December 9, 2016 release notes
- December 16, 2016 release notes
- December 23, 2016 release notes
- December 29, 2016 release notes
- January 21, 2015 release notes
- February 2, 2015 release notes
- February 20, 2015 release notes
- March 6, 2015 release notes
- March 20, 2015 release notes
- March 25, 2015 Salesforce.com integration
- April 8, 2015 release notes
- May 15, 2015 release notes
- May 29, 2015 release notes
- April 24, 2015 release notes
- June 12, 2015 release notes
- June 19, 2015 release notes
- June 26, 2015 release notes
- June 27, 2015 maintenance notice
- July 3, 2015 release notes
- July 10, 2015 release notes
- July 17, 2015 release notes
- July 24, 2015 release notes
- July 30, 2015 navigation update
- July 31, 2015 release notes
- August 7, 2015 release notes
- August 13, 2015 release notes
- August 21, 2015 release notes
- August 28, 2015 release notes
- September 4, 2015 release notes
- September 11, 2015 release notes
- September 20, 2015 release notes
- September 25, 2015 release notes
- October 2, 2015 release notes
- October 9, 2015 release notes
- October 16, 2015 release notes
- October 23, 2015 release notes
- November 6, 2015 release notes
- November 13, 2015 release notes
- November 20, 2015 release notes
- November 25, 2015 release notes
- December 4, 2015 release notes
- December 11, 2015 release notes
- December 18, 2015 release notes
- December 31, 2015 release notes
- December 31, 2014 release notes
- December 15, 2014 release notes
- November 14, 2014 release notes
- November 7, 2014 release notes
- October 15, 2014 Jira enhancements
- October 14, 2014 release notes
- October 3, 2014 release notes
- September 19, 2014 release notes
- September 12, 2014 release notes
- August 26, 2014 release notes
- August 21, 2014 release notes
- August 6, 2014 release notes