Aha! Roadmaps | Best practices for tracking product development risks
Product teams use Aha! Roadmaps to manage many different types of work — including strategic planning, product launches, and software rollouts. These projects power the growth of your business, which is why it is so important to deliver them on time and on budget. This is where having a well-defined plan comes in. From defining activities to assigning work, highlighting dependencies, and setting clear due dates, there are so many moving parts to consider — which increases the risk of things going awry.
Many factors can derail your plans — resourcing issues, financial constraints, and unforeseen technical challenges to name just a few. Of course, you can not anticipate everything that might happen. But you can put an effective process in place to proactively identify, track, and manage risks. The key is making sure that risks are clearly documented and communicated, so the team can quickly assess the severity and determine how best to address them.
In this article, we recommend two solutions for tracking product development risks in your Aha! account. The first solution focuses on creating a custom workflow status to flag "At risk" work and highlights a number of core capabilities in your Aha! account — such as the Gantt chart, burndown chart, and capacity report — to help you identify and manage potential risks. The second solution provides a more advanced approach for tracking details about the severity and status of risks, so you can accurately report on the health of your project.
We will use the example of a product release to describe how to implement these solutions in Aha! Roadmaps, but you can easily apply these recommendations to other types of complex work. Of course, you can also contact our team of experts at support@aha.io for help at any time.
Click on any of the links below for recommendations on how to track risks in Aha! Roadmaps:
Core solution
Advanced solution
Core solution
Create an "At risk" workflow status
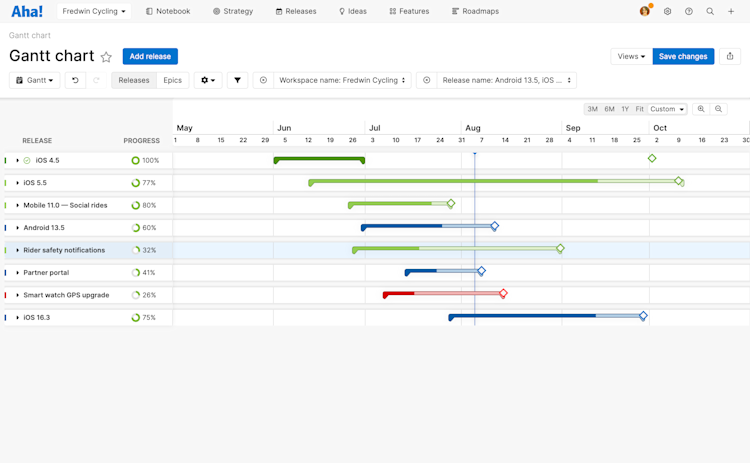
Add a custom status to your workflows so you can quick identify any work item — including initiatives, releases, epics, features, and requirements — that are at risk. We recommend adding the same custom status in all workspace lines and workspaces to help you establish a consistent approach for tracking risk across your organization. In the example below, we are using a Gantt chart to visualize the status of multiple releases. We used the "Color by status" option to immediately identify any releases that are at risk, so the team can come together to figure out a resolution plan.
Alternatively, you can create a custom field to identify work items that are at risk. This way, you can still see where the work is at in your overall workflow, while capturing the potential risk. We recommend using a predefined choice list and entering "At risk" as the only option. Display the field as a colored label to create visual attention. If you use this approach, you will need to manually add your custom field to reports so you can identify at-risk work.
Highlight potential risks
In this step, we will look at some of ways you can use Aha! Roadmaps to help you proactively identify risks. Specifically, we will focus on risks related to dependencies, work progress, capacity issues, and cost.
Enable automated risk indicators
At-risk work often has consistent symptoms: work that has not been added to a release, has not been started during the release, or has trouble moving through its status workflow smoothly. You can enable automated risk indicators in your Aha! account to track risk indicators in the Planning or Development phases of your work. You can also enable the ability to flag a record manually as at risk — and add a comment explaining the flag.
Planning indicators typically apply to the planning stage of product development, which can take place in both Aha! Roadmaps and Aha! Develop.
Development indicators typically apply to the development stage of product development, which usually takes place in Aha! Develop.
Automated risk indicators are not mappable in third-party integrations.
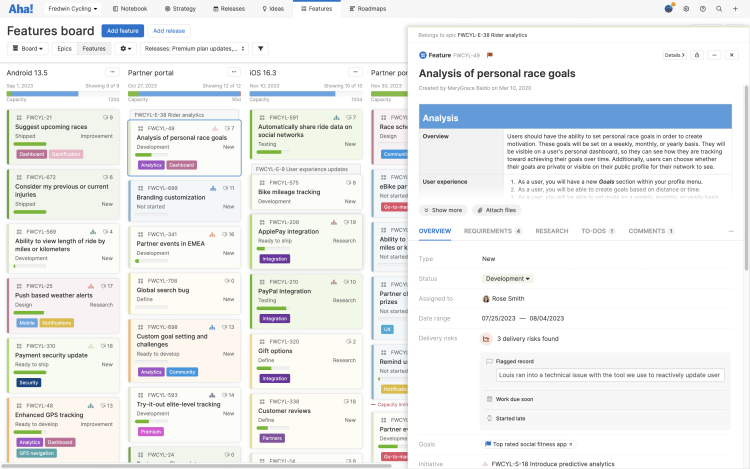
If you have integrated Aha! Roadmaps and Aha! Develop together, you can use both products to create a unified product development environment, where product and development teams share the same Aha! records and can work towards the same goals. They can also create risk profiles unique to their needs, to track important alerts in the planning and development phases of delivery.
Track dependencies
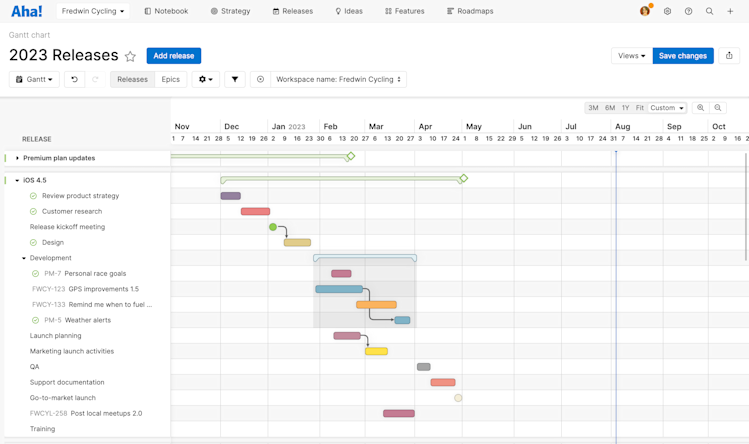
You can create links between dependent records in Aha! Roadmaps and then view those dependencies in multiple ways. For example, you can visit the Related tab on any record to view its relationships. Or you can build a dependency report, strategy roadmap, or Gantt chart to visualize dependencies across your plans. The Gantt chart below highlights critical dependencies between phases, milestones, and features for an upcoming release. The dependency line turns red when an item is behind schedule, alerting you to a potential risk.
You can also build custom reports in Aha! Roadmaps to analyze data, summarize progress, and chart risk trends.
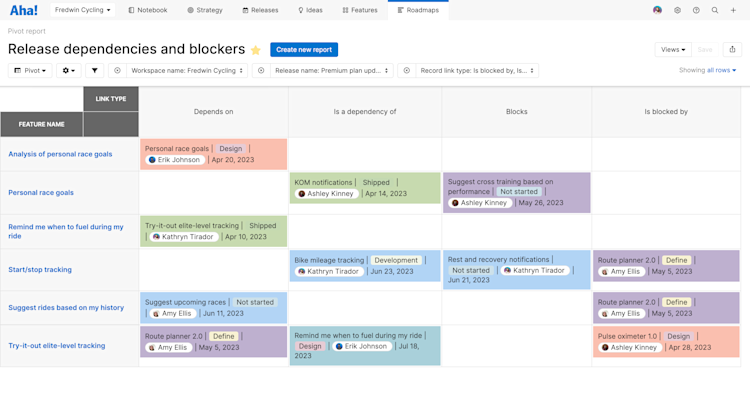
Include key details about dependent work items. Use the [Record type] record links table in any list, pivot, or chart report (or custom roadmap!). Then, add the Linked [record type] table and select any field (like Status, Assignee, or Due date) on the linked record's layout.
For a focused view of critical dependencies, filter these reports to show only records with Depends on/Dependency of relationships. You can also add information about manual and automatic risk indicators. Then, add your filtered report as a dashboard panel.
Monitor progress
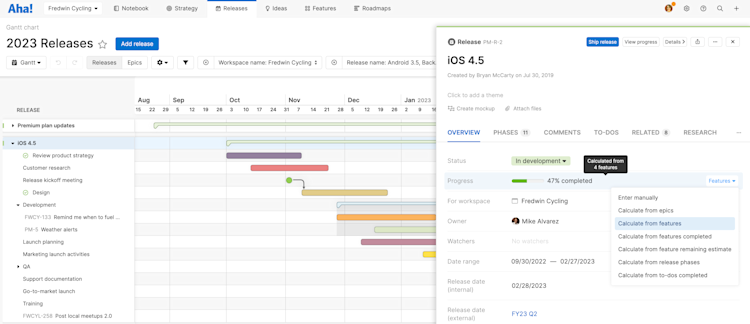
Use progress indicators to assess if a release is on track to launch on the target date. The burndown chart provides a real-time view of what the team has accomplished and what is left to be done. You can also enter the percent complete for a release manually or calculate it from related records — such as epics, features, release phases, or to-dos. Below, you can see the release is 41 percent complete based on the progress of 10 underlying features. If progress is lagging in relation to the planned delivery date, this is a clear indicator that the release is at risk.
Manage capacity
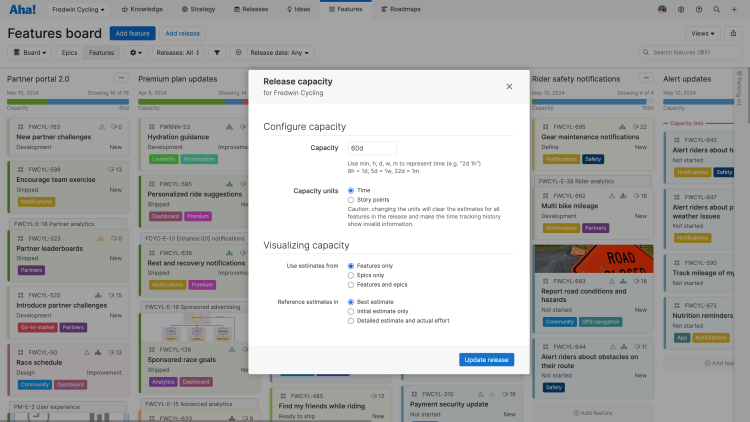
Make sure you have enough available resources to deliver your release on time. Enable capacity planning for individuals in your workspace and select whether you want to use time or story points as your estimation unit. Then set the capacity for a release and estimate the effort required to deliver each feature.
The planning bar at the top of each release on the features board displays the total estimated capacity vs. the total effort required to complete each release. If there is not enough capacity to meet the estimated effort, a section of the bar will turn red to highlight the potential risk.
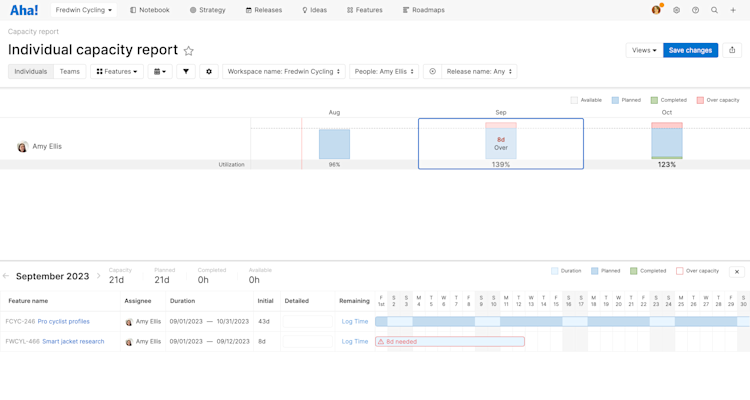
You can also use the capacity report to proactively spot resourcing conflicts. Visualize each person's workload to see who is over- or under-utilized each month — so you can resolve any resourcing issues that might put your release at risk. Enterprise+ customers can also set advanced estimates for teams and compare scenarios to better understand if it is possible to complete a major release in a specific period of time.
Track roadmap changes
On the features roadmap, use the History tab to track scope and timing changes, so that you can review what has changed. Set the date range and group changes by Release or Change type, then review as a team how your plans have evolved.
Track financial data
Capture financial metrics related to your product plans using custom fields. For example, you can store the release budget on the actual release record and track the cost of each feature directly on individual feature cards. Then use a pivot report to sum up the cost of the features and compare the total to the overall budget. This helps you quickly understand if the cost of your project will exceed the budget so you can take steps to reduce the financial risk to your business.
Enterprise+ customers can use custom worksheets to display, calculate, and report on key budget and performance data using a wide range of formulas and operations.
Communicate challenges
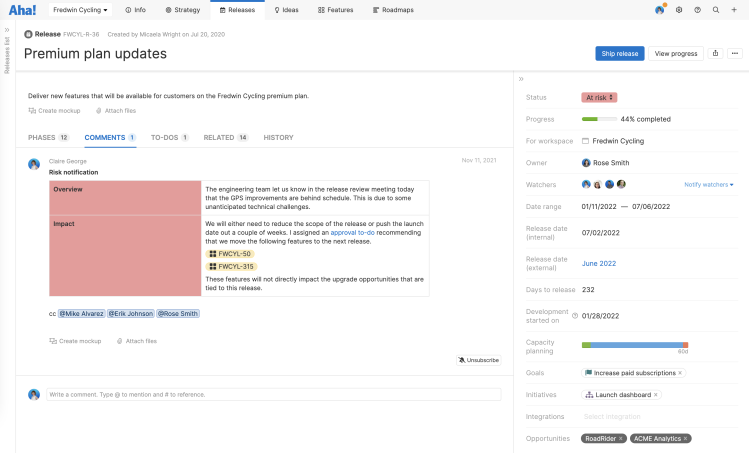
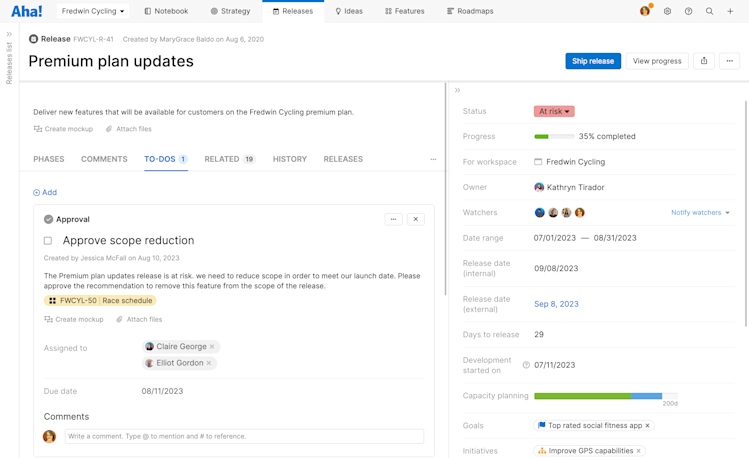
Effective risk management requires transparency and constant communication. Once you have identified a critical risk, the first step is to update the status of the release to "At risk." This action automatically notifies anyone who is participating or is a watcher on the release. Add comments to the release and @mention team members and other stakeholders to keep everyone fully informed of what is happening.
Manage and resolve risks
Create to-dos to assign risk mitigation tasks to team members. This way, everyone knows exactly what needs to be done and when to get the release back on track. We recommend adding to-dos to the same record type — such as the release record itself or to specific release phases — so you can easily find and track them. You can also create a pivot report that lists all to-dos linked to your release, along with the assigned owner, latest comment, and due date. Use this report to review actions you are taking to mitigate risks to your release.
Advanced solution
Track risk level by type
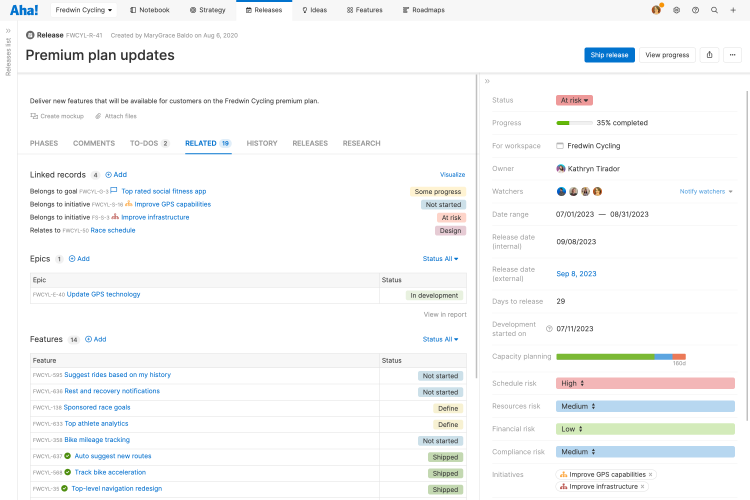
Create a risk profile for your releases. We recommend creating custom fields to represent the different types of risk that are important to your business — such as schedule, resources, financial, and compliance — and using a predefined choice list to track the severity of each one in a consistent way. For example, you might use values such as red, amber, and green or high, medium, and low. This helps you quickly assess the overall risk level for each release.
A custom field for risk severity will pair well with the standard Delivery risks field. If you are using automated risk indicators, add this field to your custom layouts so you can track risks automatically — and flag and comment on at-risk work manually. Then track the risk severity in your new custom field.
Create a risk log
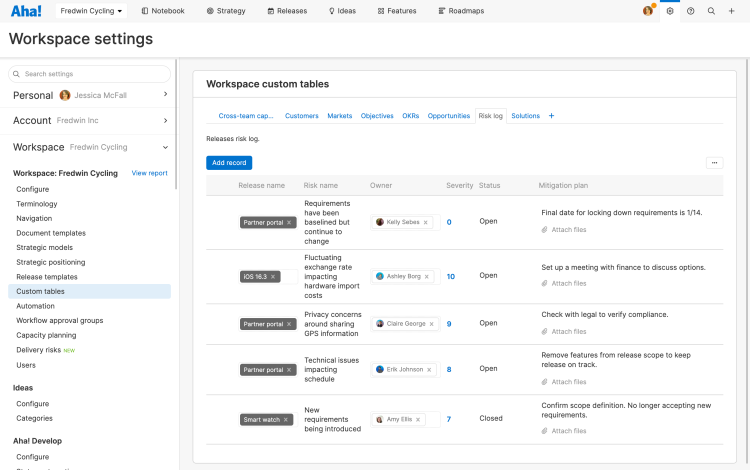
Capture details about each risk — such as the status, severity, and mitigation plan. Add a custom notes field to your release records and insert a table so you can store this information in one place. If you are on the Enterprise+ plan, consider using a custom table. This approach gives you more flexibility to structure your risk management data the way you want. For example, you can link each risk to an Aha! user to assign ownership and create a risk assessment scorecard. You can also build more granular reports to analyze and communicate risk status.
In the example below, we used a custom table to log the following information about risks for each release:
Release name
Risk name
Owner
Severity
Status
Mitigation plan
Build reports to track risks
Now it is time to create the list reports, pivot tables, and charts you need to effectively track and manage risks.
Your primary tool in this effort is the delivery risk report. Available to Aha! Develop Advanced plan customers, the delivery risks report highlights all records in a sprint that have been automatically or manually flagged as at risk. Thanks to alerts on the program increments view, this report is especially effective for teams that use the Scaled Agile Framework® (SAFe) for planning and delivering software. But any team that uses sprints will see significant benefits.
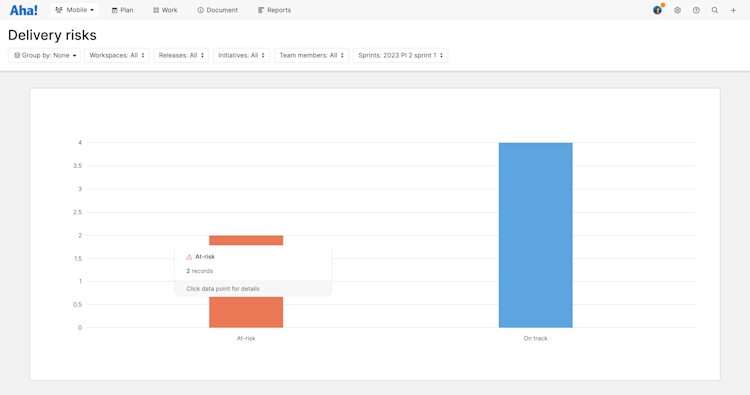
The delivery risks report separates work into At risk or On track, so you can sort records in your selected sprint(s) at a glance.
Filter the report to include specific records, and to group work by Release, strategic Initiative, Aha! Roadmaps Workspace, individual Aha! Develop Team member, or Sprint.
Hover over any column in the report to see the status, sprint, and record count of that data point.
Click on a section of the report to generate a pre-built list report of all records in that sprint. Click on any record to open a drawer view and adjust details. The report will update automatically with any new information.
Then, start conversations.
If a record was automatically flagged, was the risk alert appropriate? Does it indicate broader workflow or process trouble?
If a record was manually flagged, discuss it. Is a teammate over capacity? Is there a dependency here that has not been documented?
You can also use the full suite of Aha! reports to follow your curiosity. You can choose from more than 75 example reports to help you get started or build your own using the Aha! report builder. In the example below, we built a pivot table to help us assess risk across multiple releases. We used the custom fields we created earlier to view the level of risk by type.
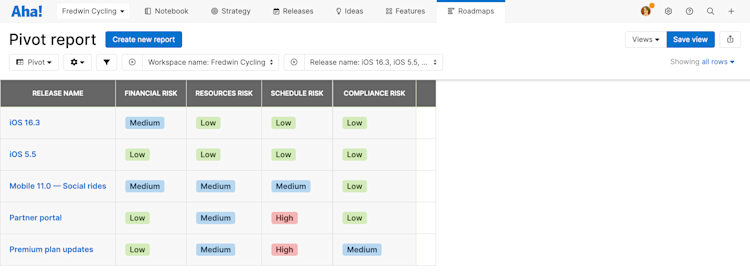
We also created a pivot table using the fields we added to our custom table for logging risks. We filtered the report by release so the team can quickly review the severity and mitigation plan.

If you have enabled automated risk indicators in your Aha! account, you can also report specifically on those using the following fields:
Use the [Record] delivery risks field for a summary of all risks on a given record.
Use the [Record] at risk: [Risk] fields to track individual risk indicators.
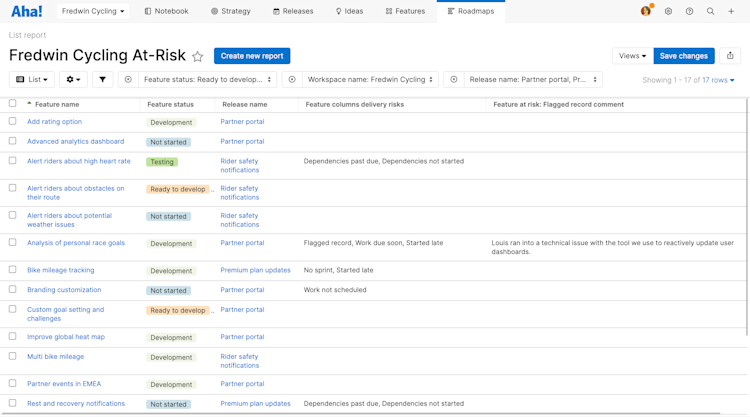
Use the [Record] at risk: Flagged record comment field to include comments on manually flagged records.
In the example below, we created a list report to track at-risk work as well as comments.
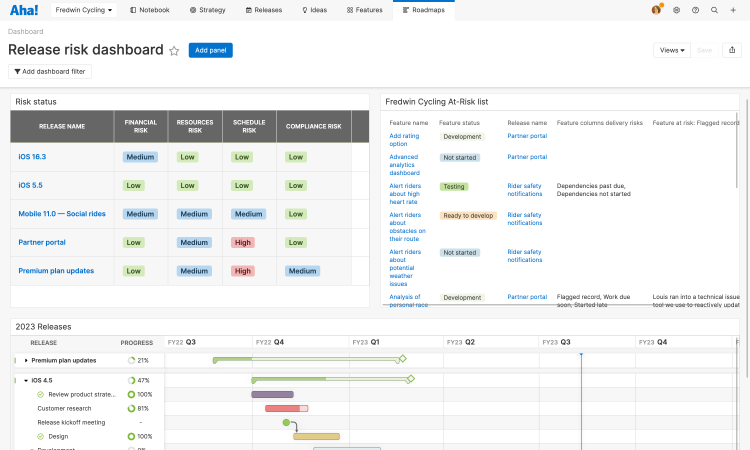
Add your saved reports to a dashboard — so you can view your risk management data in one view.
No matter what type of complex work you manage, establishing a clear approach for managing risk will help you keep your plans on track.
If you need help configuring your account to identify, track, and manage risks across your organization, contact us at support@aha.io. A member of our Product Success team will respond to your request quickly.