Explore  

10 types of diagrams and flowcharts for product managers

Imagine you have a great idea for a feature enhancement that will solve a customer problem. You envision the user flow and describe it to your team. But when you ask them for feedback, you are met with some confusion. You attempt to explain the different steps and pathways in greater detail, but this results in even more questions.

If your solution only exists in your head, then only you can see it. This is a problem — product development can be incredibly complex and requires understanding and alignment from the team. Ideas, processes, and plans often need more than a verbal explanation. This is why product teams rely on diagrams and flowcharts to clearly visualize concepts and accelerate communication and collaboration.
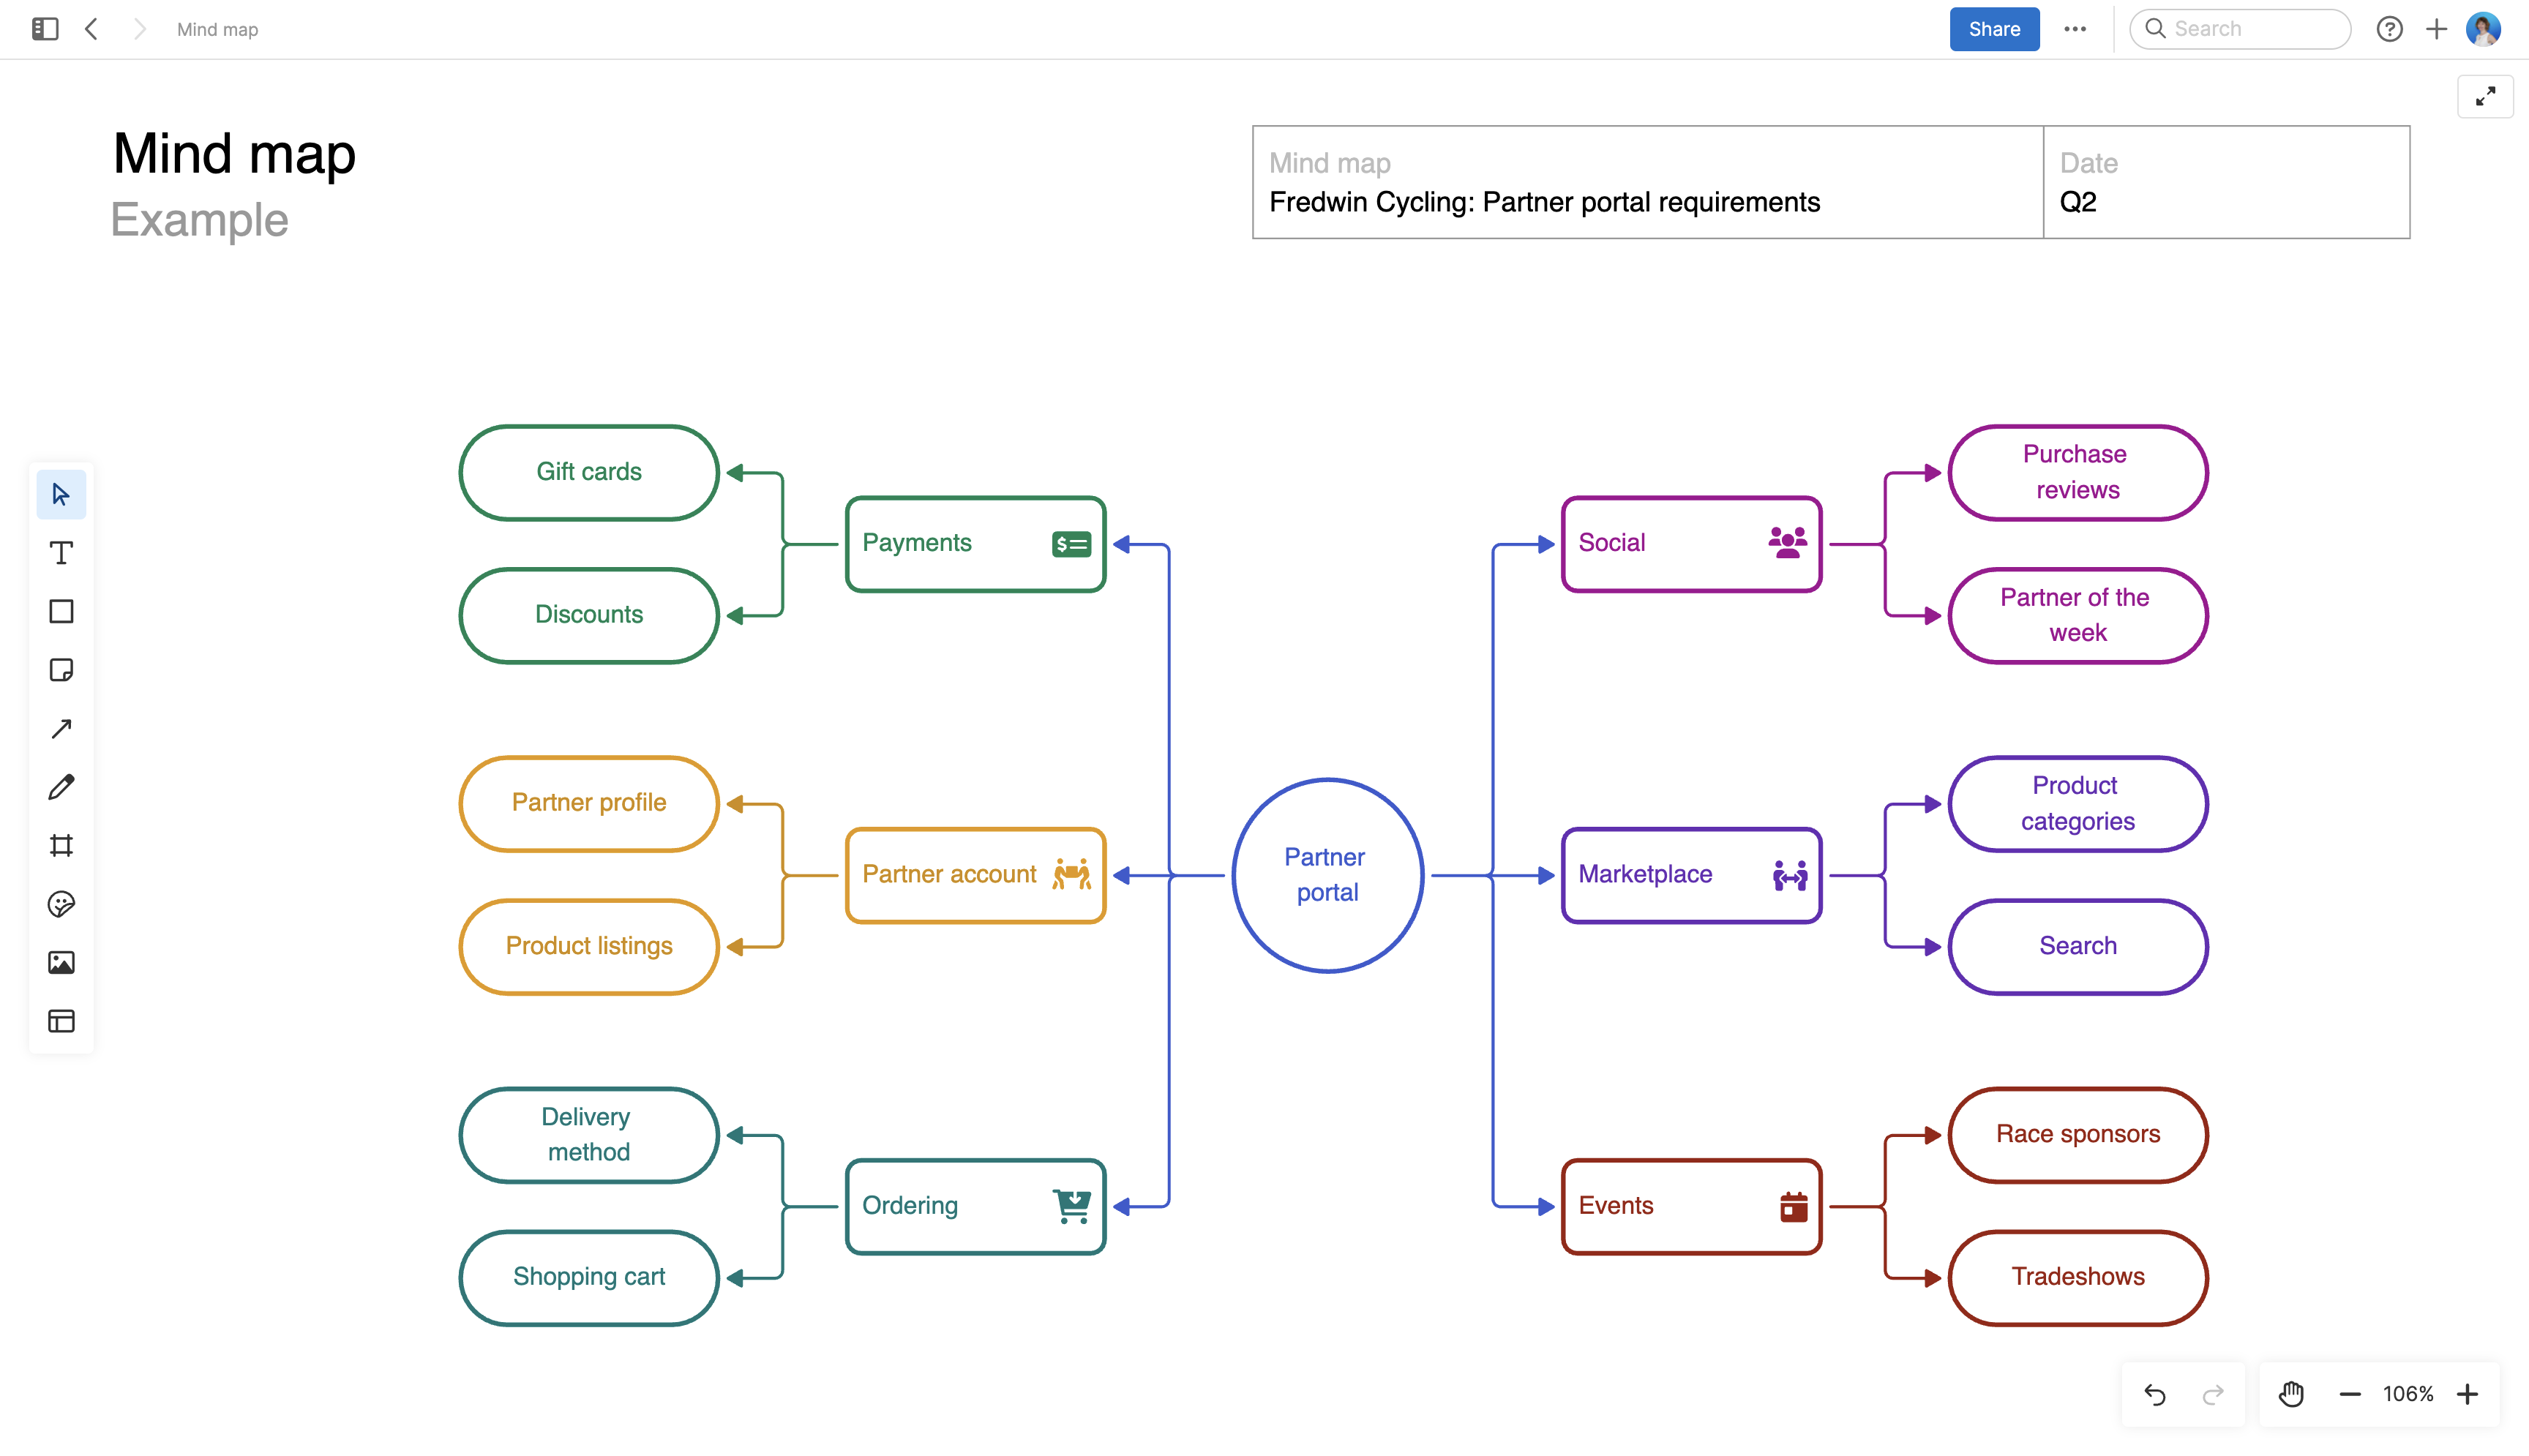
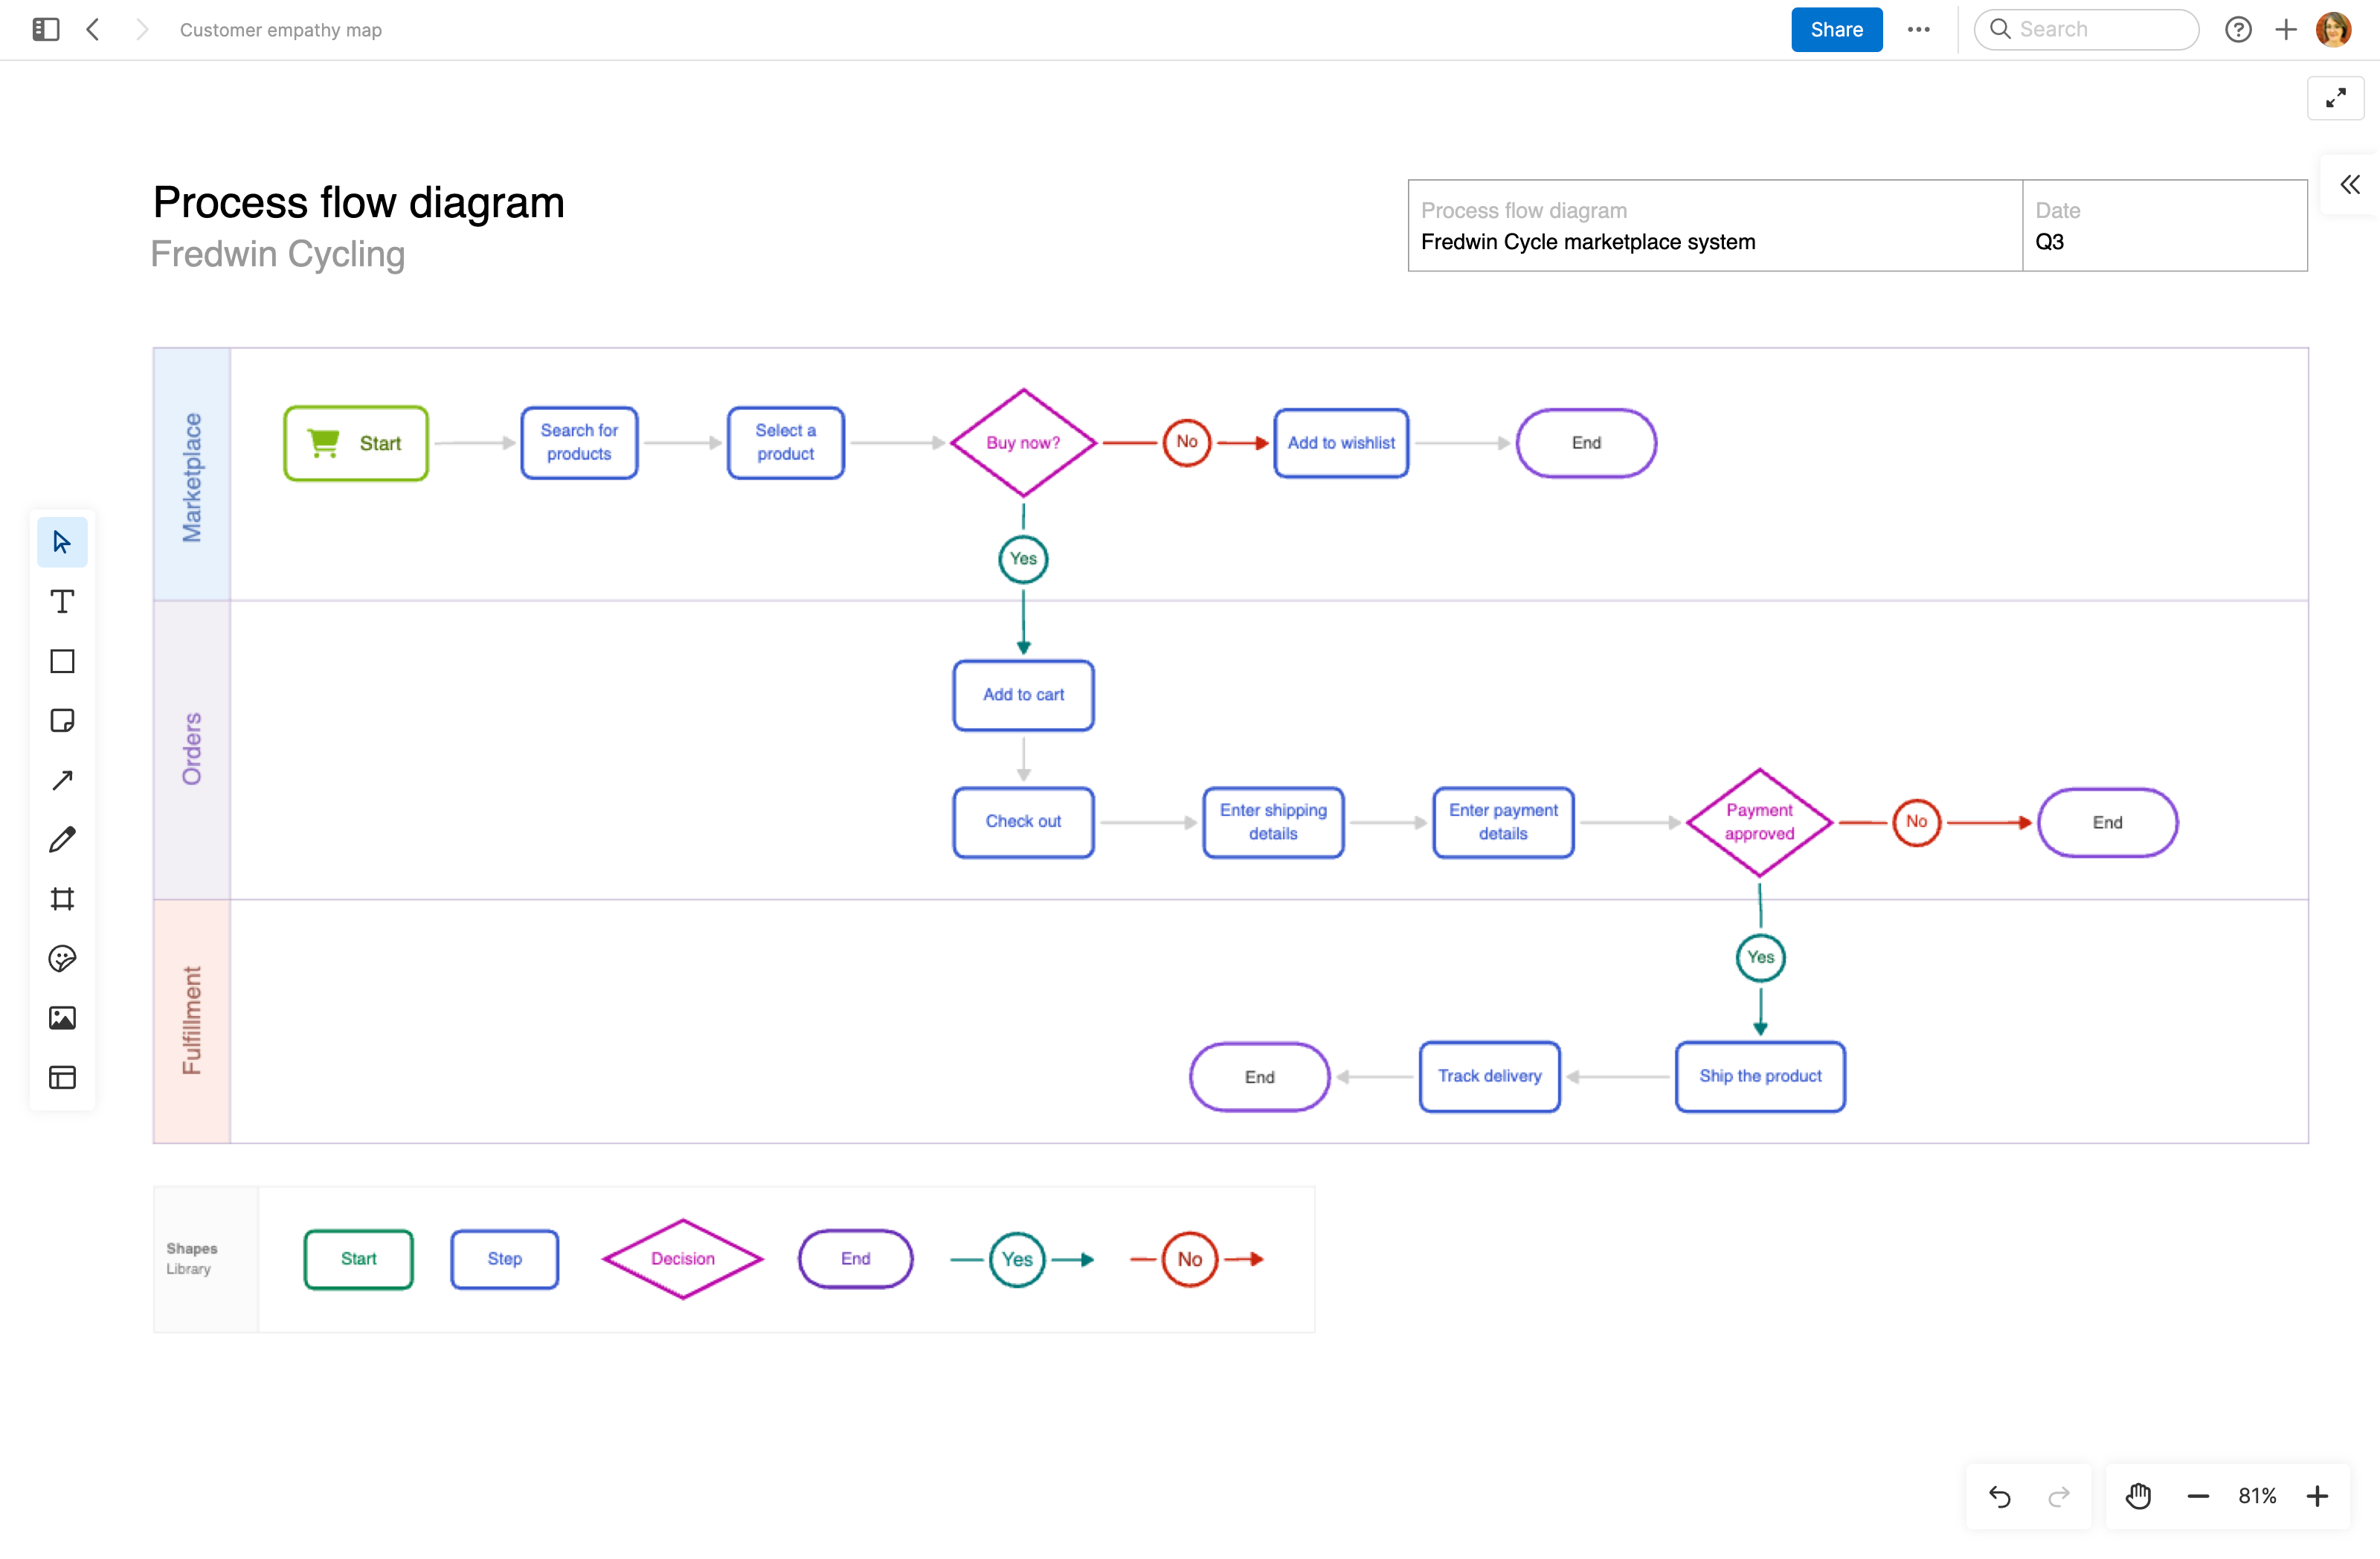
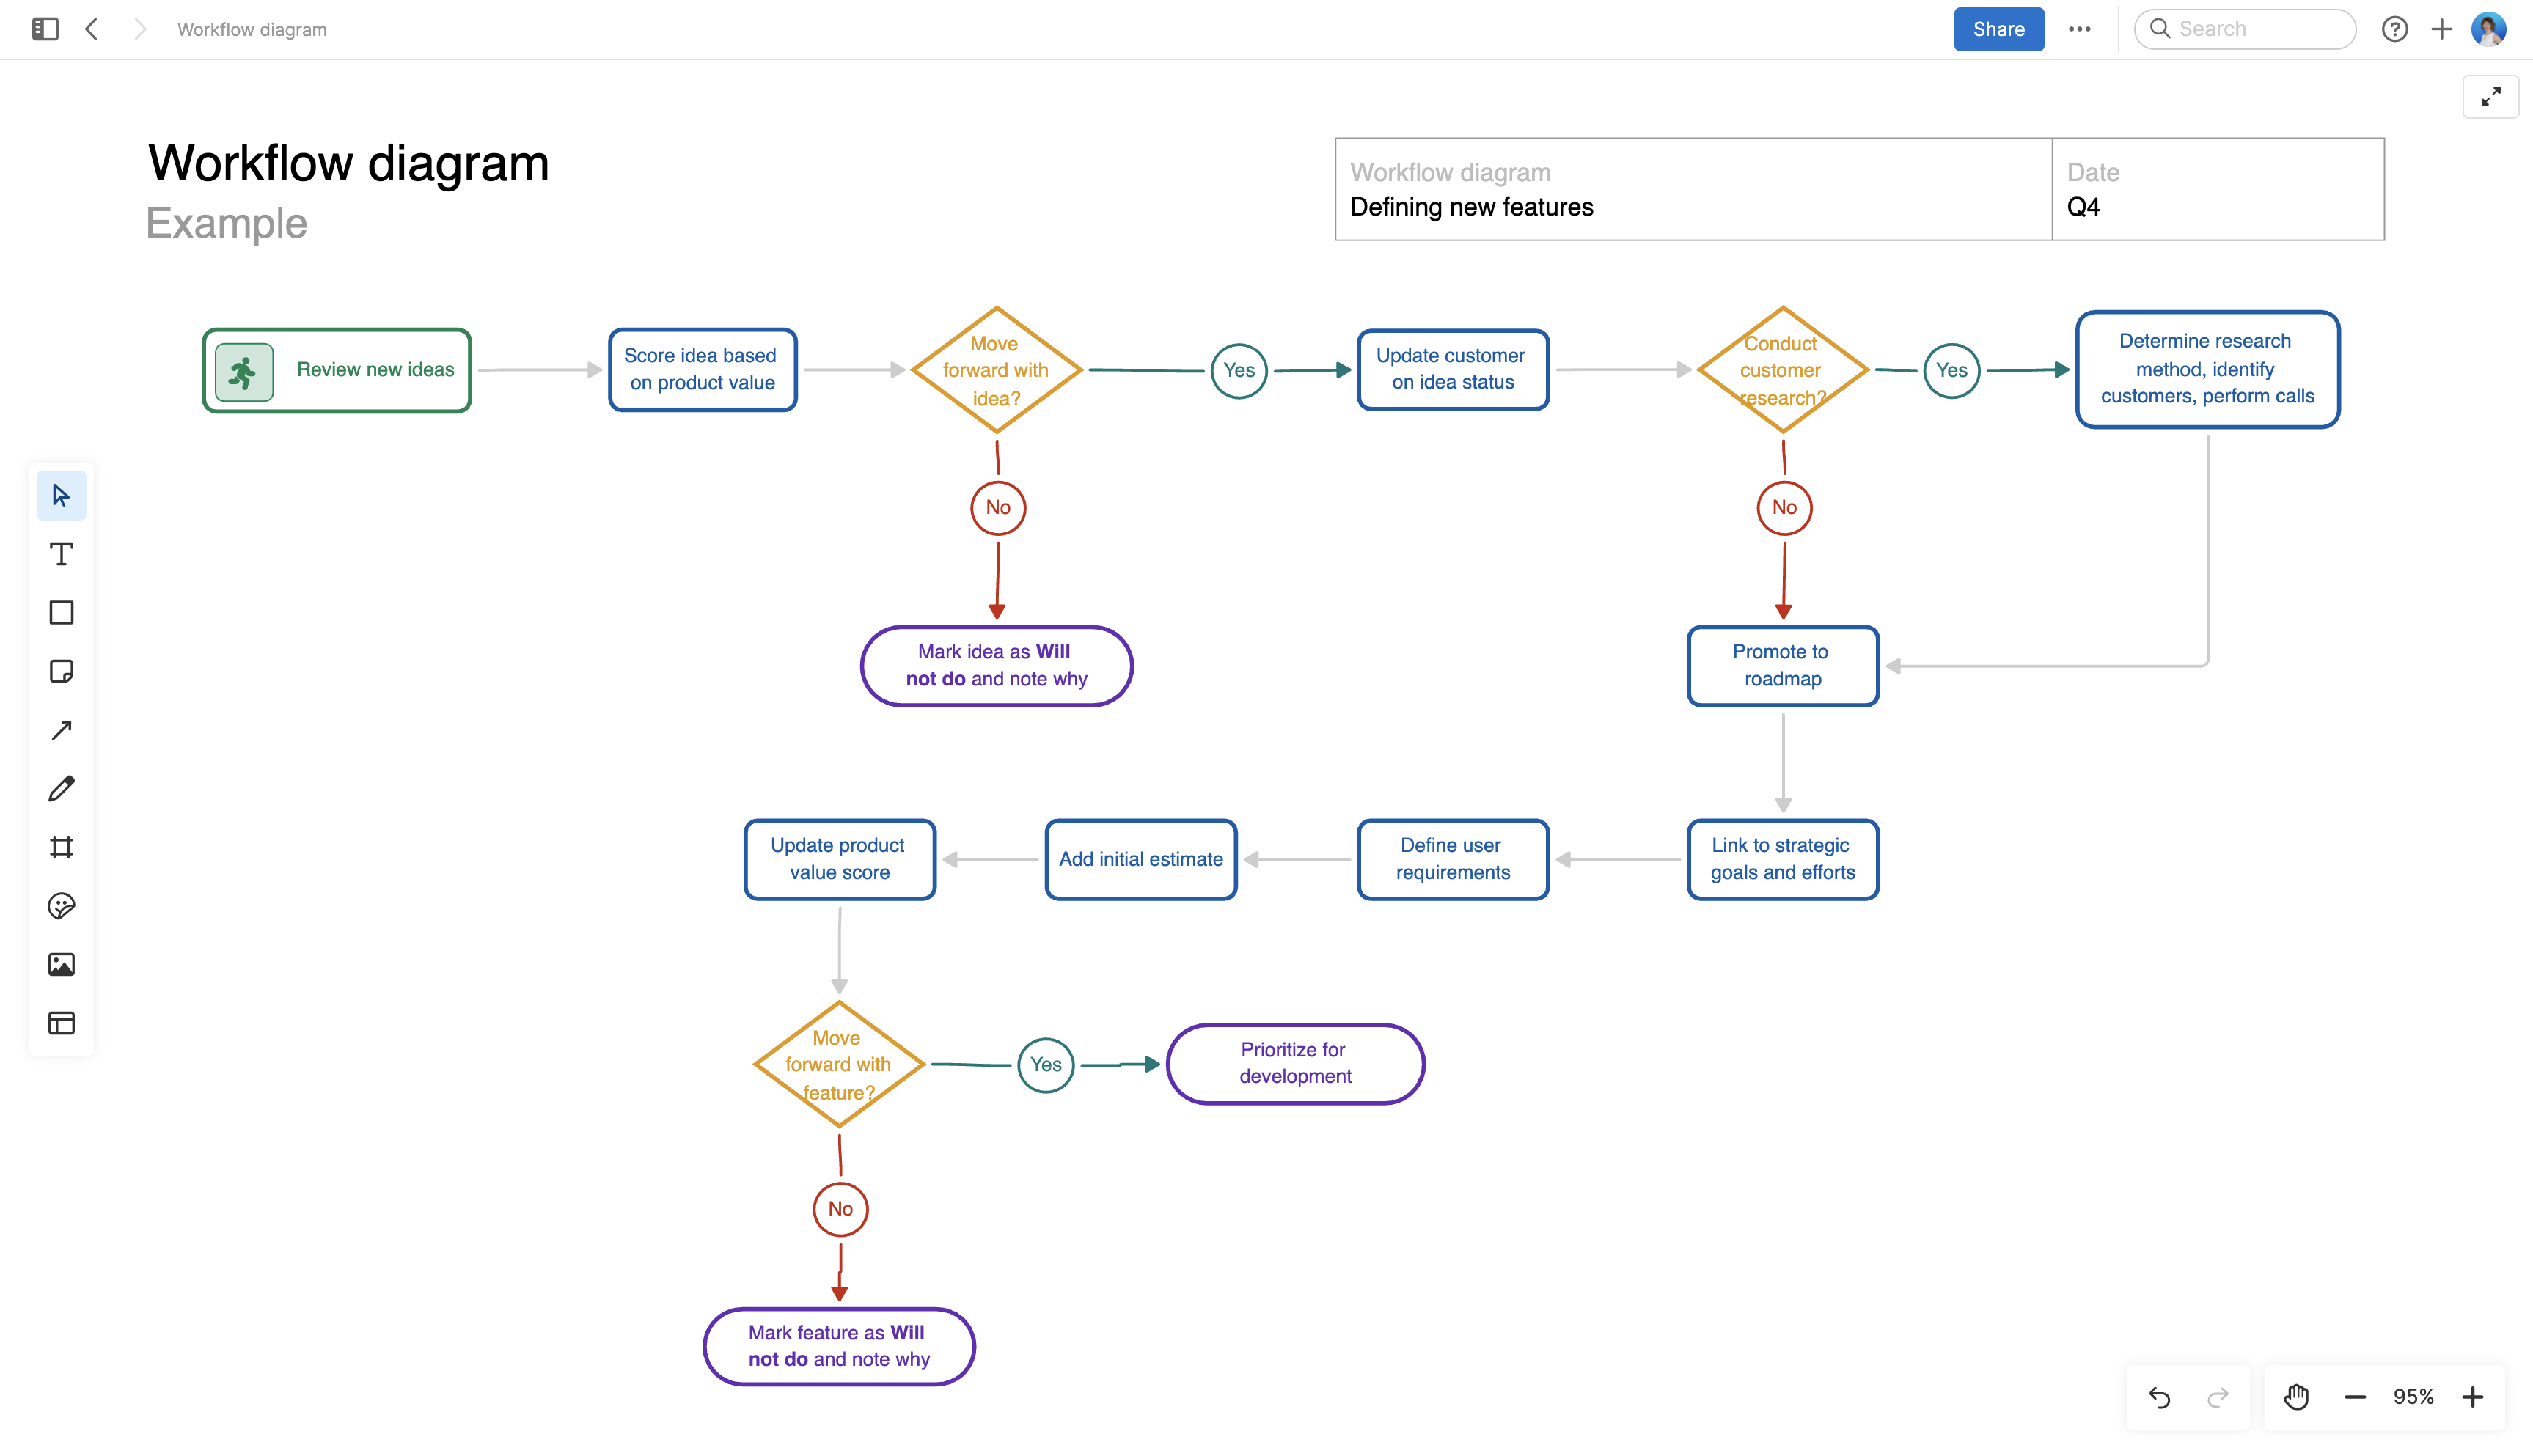
Diagrams and flowcharts are broad categories of visual aids. In the context of product development, they primarily represent product-related processes and workflows, which can be internal or user-facing. This guide will explore common types of product diagrams and flowcharts so you can get inspired to create your own.

Create product diagrams and flowcharts in Aha! software — sign up now.


Types of product diagrams and flowcharts

Product teams use diagrams and flowcharts to illustrate how concepts are connected or sequenced. With visual cues like shapes, colors, and arrows, you can convey even the most elaborate processes in an accessible way. Sometimes flowcharts can evolve into wireframes, mockups, prototypes, and even features on your product roadmap — but many times they are used simply for preliminary planning work or informational reference.

Below is a list of seven product diagrams and flowcharts you can use to sketch your thoughts on a variety of processes. Each of these examples was created in Aha! software — either from scratch or using pre-built templates, which can help you get started quickly.

Concept map

Concept maps are often used to depict a central idea and related concepts. In product management, you might have a large area of functionality at the center with different features branching out from it. This helps to showcase how various features interact — so you can get a high-level view of your product structure. This concept map template in Aha! software can help you visualize these types of relationships in a layout that is easy to follow.

Concept map large


Data flow diagram (DFD)

A DFD displays the flow of information in a process or system. Map out data inputs, outputs, and routes with simple boxes, text, and arrows. This helps product teams understand how and when customer data is collected and what happens to it. Data flow diagrams can be simple sketches or detailed, multi-layered visuals. This DFD template in Aha! software offers an easy way to start visualizing high-level system structures on a whiteboard.

Data flow diagram large


Decision tree diagram

A decision tree diagram is a type of flowchart that starts with a decision that must be made, called the root. This question branches into two or more possible outcomes and continues branching until the results of each scenario are fully mapped out. Decision trees are versatile tools for weighing alternative approaches. You can create a decision tree to help refine everything from an internal workflow to a user experience — try it using the Aha! software template below.

Decision tree large


Fishbone diagram

Product teams can use a fishbone diagram to help investigate the root cause of a specific problem — such as low product usage or declining performance. By organizing causes into categories, this type of diagram provides a visual way to examine and clarify complex issues. This fishbone diagram template in Aha! software will help you collaborate on this exercise and communicate potential solutions to stakeholders.

Fishbone diagram large


Mind map diagram

Mind mapping is both an exercise and a diagram. To start, choose a central idea or topic to focus on. Your mind map then branches out into related thoughts. As you add more and more branches, it forms a webbed hierarchy of supporting information that all connects back to your original idea. The mind map template in Aha! software gives you a simple way to get started on a digital whiteboard.

Mind map large


Process flow diagram

A process flow diagram shows sequential steps and decisions. Product teams will use this type of diagram to document a wide variety of processes — both external and internal. For example, you might map out how a customer interacts with your purchasing process. Or, you could use this diagram to illustrate how the product team works together to prioritize features. In Aha! software, this whiteboard template is easily adaptable.

Process flow diagram large


Product development process flowchart

Product development is comprised of several stages, from setting strategy all the way to measuring the success of your product. Flowcharts can help clarify your overall product development process or the sub-processes within (e.g., your go-to-market plans) so everyone is aligned on what happens during each phase.

Product development team process flowchart

A flowchart portraying how teams contribute to each stage of product development. Build your own with product development process templates

Product team workflow diagram

Product teams use workflow diagrams to promote transparency and accountability. Think of a workflow diagram as a zoomed-in view of a product development process flowchart. Workflow diagrams help you visualize all of the steps required to complete a task, including what steps to take under different conditions. For example, the Aha! software template below uses a workflow diagram to demonstrate the process of defining a new feature.

Workflow diagram large


Swimlane diagrams

Swimlane diagrams have many uses. Similar to workflow diagrams, swimlane diagrams indicate how work gets done — but they use visual "lanes" to indicate when things move between different individuals, functions, or stages. This helps product teams avoid confusion about who does what and when.

Customer Lifecycle Swimlane Diagram Whiteboard

An example of a swimlane diagram portraying different stages in the customer lifecycle. Created with Aha! whiteboards

User flow diagram

Building a user flow diagram requires deep understanding of your customers' preferences and behavior. These diagrams show how users navigate specific areas of your product — depicting start and end points, steps, and decision areas. Product teams frequently create user flow diagrams to map out the intended flow for users to follow. This can be incredibly useful for discussing different product solutions before the development team starts their work.

User flow diagram for badges

An example user flow diagram for earning badges in an app. Created with Aha! whiteboards

Tools for creating product diagrams and flowcharts

You do not need special design skills to create product diagrams and flowcharts. A simple visual tool — likely one that you already have — can offer all you need to get started. Here are a few examples:

  • Digital notebooks and diagramming apps

  • Whiteboards (physical or digital)

  • Presentation tools (e.g., PowerPoint)

  • Spreadsheet tools (e.g., Excel)

If your product team meets in person, you might prefer to workshop a product diagram or flowchart on a physical whiteboard. But in most cases it is simpler to save, share, and present these visuals with digital tools (even if you are in person). Some digital whiteboards allow for real-time collaboration and provide templates for getting started — so you can capture ideas on the fly and accelerate innovation.