The complete guide to agile metrics
Keep an eye on your agile development process by tracking clear measures of success
Last updated: January 2025
This guide breaks down what agile metrics measure — and how to choose the right ones to improve predictability, productivity, quality, and value. You will learn which metrics matter for scrum, kanban, and beyond, plus practical tips for visualizing and tracking progress so each iteration delivers more impact. |
The spirit of agile development is incremental, ongoing improvement — something that every agile team wants to embrace. But embracing this idea and implementing it are two different things. How do you know if your iterations are making an impact? How do you keep providing product value for customers over time?
This is where both quantitative and qualitative data come in. Agile metrics help agile teams set benchmarks, measure against goals, and evaluate performance. They typically assess productivity, predictability, quality, or value in some way, enabling teams to adapt quickly and deliver more value with each iteration.
The metrics you choose will vary based on your goals, organization, and development team. For example, the most common agile metrics for scrum teams are burndown and velocity, whereas kanban teams typically track cycle time, throughput, and work in progress (WIP). But in this guide, you will also find plenty of methodology-agnostic metrics to choose from.
Let's explore the world of agile metrics and which ones are most common in product development today.
Track agile development progress in Aha! Develop — get started.
Jump ahead to any section:
Why do agile metrics matter?
Agile metrics help you keep a pulse on agile development. By tracking clear measures of output, quality, and satisfaction (both internally and externally), you can better spot opportunities for improvement across the team. Predictability metrics, for example, help you plan work with greater accuracy, reducing guesswork about capacity and timelines.
Beyond monitoring team health, agile metrics also help you measure progress toward your goals. Many teams use metrics as a foundation for establishing agile key performance indicators (KPIs). KPIs provide a quantifiable way to evaluate improvement over time and showcase your success.
How to visualize agile metrics
Teams often represent agile metrics through numbers, reports, and charts that make insights more digestible. They are a reflection of people: the team's effort and even trade-offs in priorities or resources. The right metrics signal areas of strength and weakness. They promote transparency, celebrate achievements, and spark productive conversations about how to improve.
Related:
How to choose agile metrics for your team
We defined nearly 40 agile metrics in the following list, but you may only need a handful in practice. Select metrics that clearly map to your goals and that you can commit to tracking as a team. Here are some considerations for choosing which agile metrics to focus on.
Agile metrics should:
Be clearly defined: It is difficult to make measurable improvements based on a confusing jumble of numbers. Make sure the team understands what each metric means and how it will be tracked.
Be comprehensive: Choose a set of agile metrics that covers a breadth of agile performance across predictability, productivity, quality, and value.
Be evaluated together: A single agile metric does not give the full picture. For example, an increasing throughput metric indicates high productivity on the team — a positive result. But coupled with a low Net Promoter Score, it is clear that you are not delivering enough value despite the high volume of completed tasks. Examining these metrics together provides a more realistic view of your performance.
Have assigned ownership: Certain metrics will be monitored on a leadership or business level, while others will be tracked by your development team. What matters is that each metric has a dedicated owner to ensure responsibility for reporting is clear.
Instigate improvement: Reviewing metrics is not a passive activity. When you choose to track an agile metric, make sure to consider how you will actively work to improve on it and how you will define success.
Be trackable: Do not commit to complicated metrics without a reliable way to measure them. Dig in to see if your agile development tool supports the metrics you want to use.
The agile metrics you select should also align with your methodology. Some agile methods, like scrum, Kanban, and the Scaled Agile Framework® (SAFe®), come with built-in metrics. But teams often track broader business metrics as well.
For teams that do not follow these methodologies, The Aha! Framework for product development offers greater flexibility to choose the metrics that align with your unique processes and objectives. This framework emphasizes a goal-first approach, helping teams focus on metrics that truly reflect product strategy and progress.
Related:
37 agile metrics for development teams
The list below highlights a range of agile metrics for tracking progress, productivity, and performance — grouped by category and methodology. Think of it as a compendium, not a prescriptive list, and choose metrics that are meaningful for your organization and development team.
Agile business metrics
Many agile teams use broader business indicators to gauge overall performance and product quality. While the agile team may not directly own or collect data for these metrics, they represent the core agile values of customer satisfaction, value delivery, and flexibility. Tracking these metrics can help determine whether your organization truly embodies agile principles.
Customer satisfaction score (CSAT) | A general term for any survey or question that evaluates customer satisfaction. Customers typically rank their satisfaction with your product or business on a scale (e.g. 1-10 or 1-5 stars). Your CSAT score is the average of all responses. CSAT is typically owned by company leadership. |
Delivery speed | Measures the average time it takes for the agile team to complete different types of work, such as new features or bug fixes. |
Net Promoter Score (NPS) | An indicator of product quality and value based on a single question: "How likely are you to recommend this product to someone else?" Responses range from 0 ("not likely") to 10 ("very likely"). NPS is typically owned by company leadership. |
Planned-to-done ratio | A predictability metric that compares the amount of work planned for an individual or team against the work completed within a specific time period. |
Team happiness | Measures agile team satisfaction and morale, often gathered through surveys similar to CSAT. Team members rank their satisfaction on a defined scale. |
Team turnover | An indirect measure of team happiness, turnover tracks the rate at which agile team members leave the company and must be replaced. |
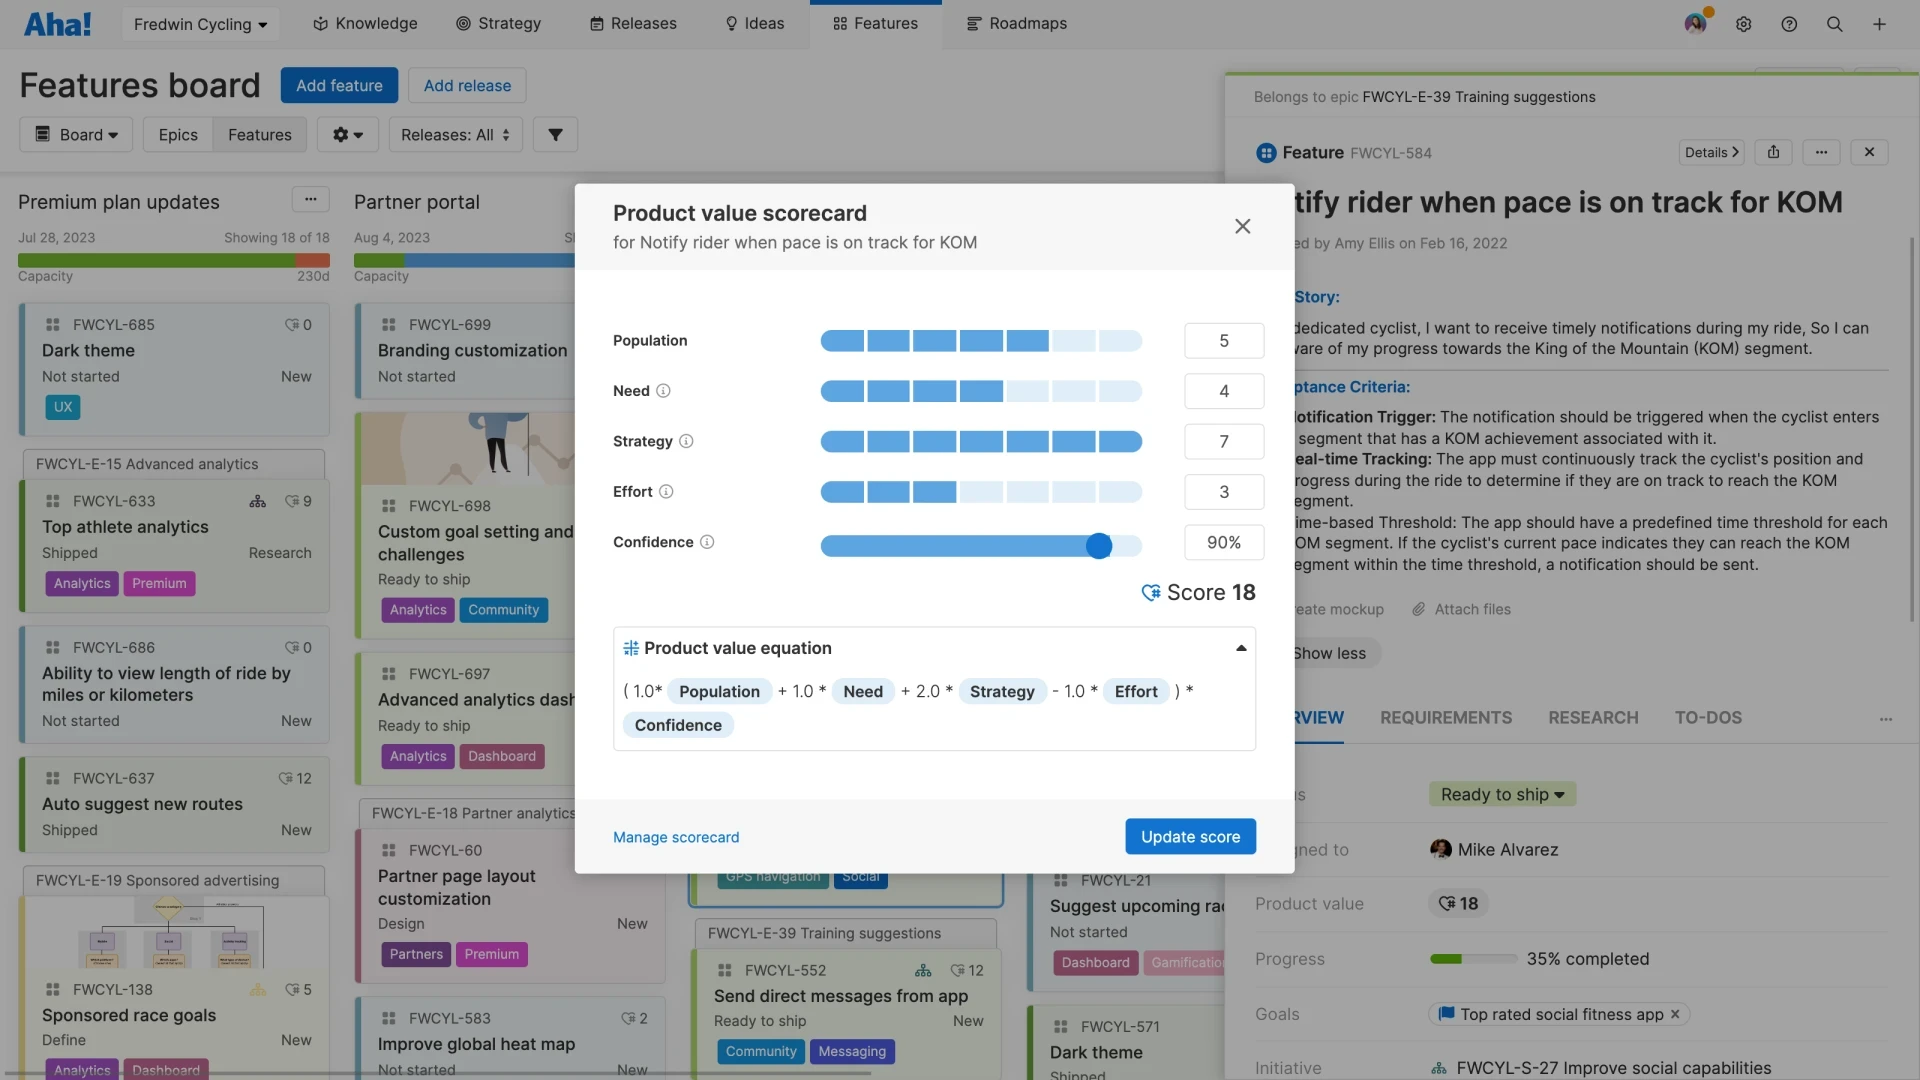
Value delivery | Value may seem abstract — but it can be measured along with any other product aspect. Assign value to tasks with money, points, or a scorecard to track how much is completed and delivered to customers over time. Value delivery is typically owned by company or product leadership. |
An example of a product value scorecard created in Aha! software
Agile methodology metrics
Some of the most common agile metrics you will encounter are related to specific methodologies (like scrum, kanban, and SAFe). But metrics such as burndown, velocity, and work in progress are just as popular among teams that do not follow one specific methodology.
Scrum metrics
Burndown | Tracks development team progress within the current work period, typically a sprint. Also referred to as "sprint burndown," it shows the amount of work completed against the amount of work remaining — measured in time, story points, or number of tasks. Burndown is represented as a trend line on a burndown chart. |
Velocity | Average amount of work completed in a given time frame, typically a sprint. Velocity helps agile development teams plan sprints, predict future milestones, and estimate a realistic rate of progress. |
Workload distribution | Measure of how much work is assigned to each scrum team member for the current sprint. |
An example of a sprint burndown chart created in Aha! Develop
Kanban metrics
Blocked time | Tracks tasks in progress that are waiting on unresolved issues or dependencies. This metric highlights setbacks during a work period and helps identify recurring blockers that slow progress. |
Control chart | Visualizes the time spent working on various features during a work period, using cycle time and lead time data. Control charts are valuable for predicting future performance and identifying trends in work completion. |
Cumulative flow diagram | Shows the flow of work over time, similar to a burnup chart. Color-coded sections represent different statuses (e.g., backlog, in progress, completed), helping teams track progress and spot imbalances in workflow. |
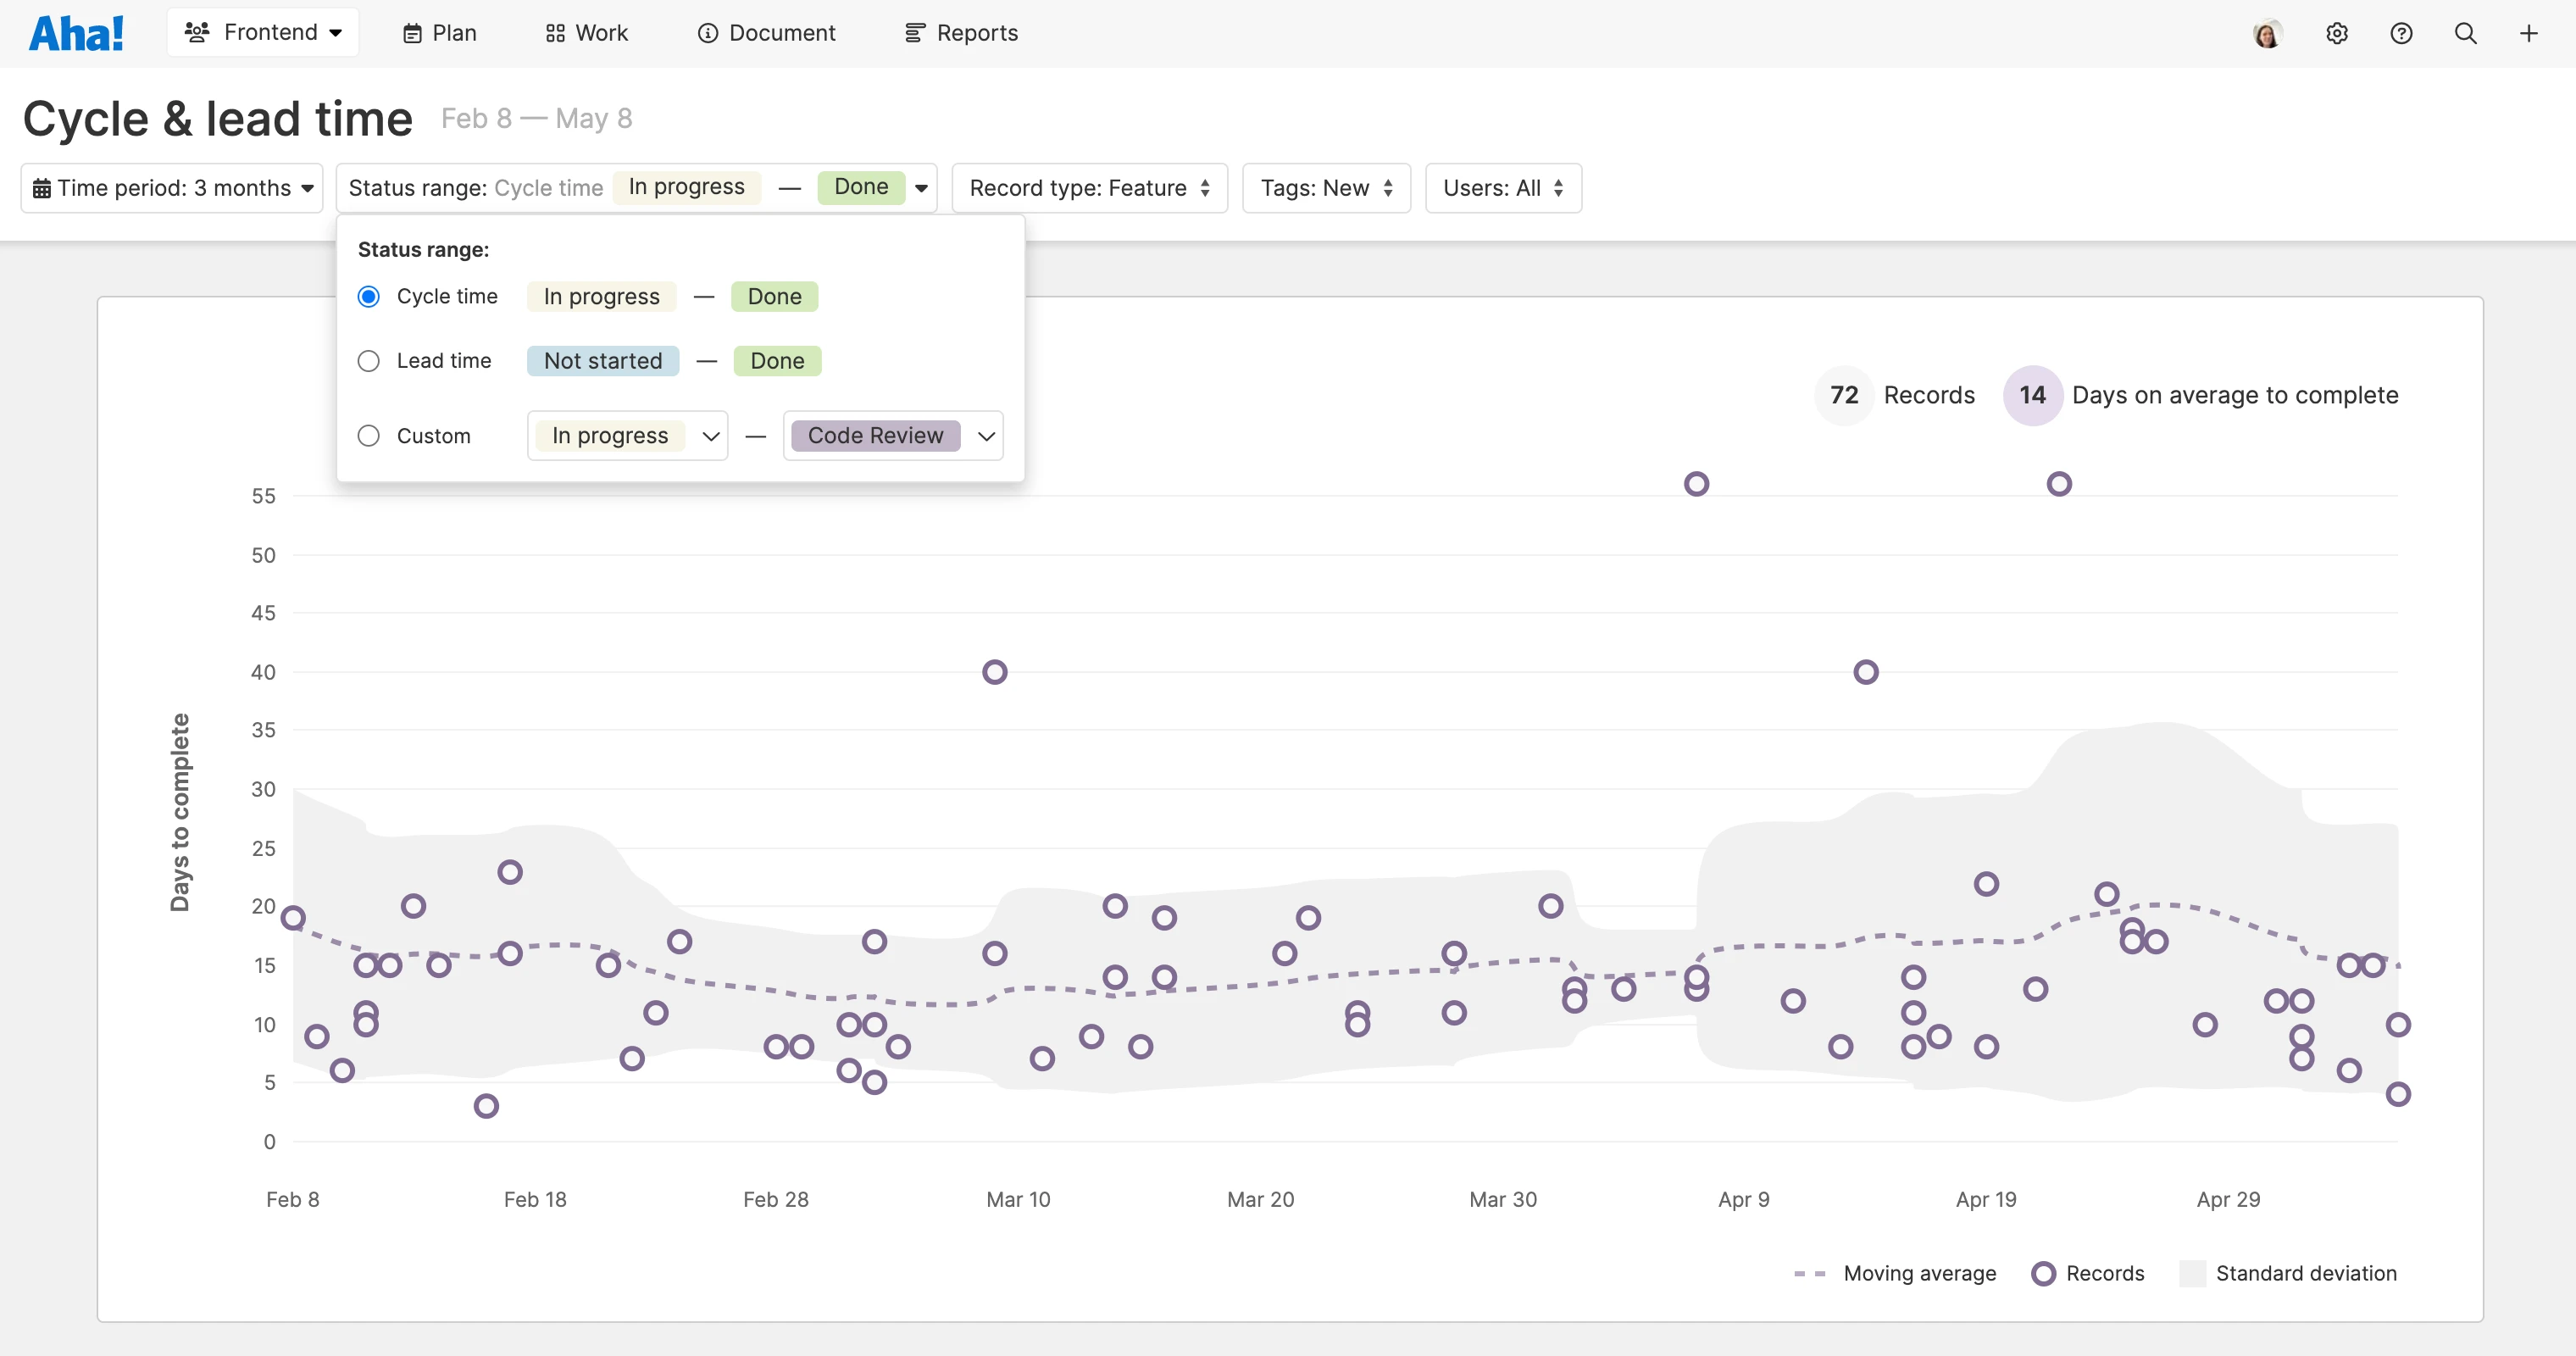
Cycle time | Measures the time spent actively working on a task or feature from start to finish, including any reopened issues. This is one of the most widely used Kanban metrics for evaluating team efficiency. |
Lead time | The total time a task exists — from the moment it is created until work is completed. |
Queue length | The number of items in a column on the kanban board. Queue length provides a view of how many items are sitting in each column over time. |
Throughput | A measure of work progress in a given time frame. It is essentially the same as velocity — but is measured by the number of tasks rather than time or story points. Throughput is one of the most common kanban metrics. |
Work in progress (WIP) | Number of tasks that have been started but not completed. WIP is one of the most common kanban metrics. |
Work item age | Measures the amount of time a task has existed since its creation, up to the current point in the work period. Unlike cycle time and lead time, which track completed work, work item age focuses on tasks that are still in progress. This metric helps teams identify tasks that may be at risk of stalling or exceeding expected timelines. |
An example of a cycle and lead time report created in Aha! Develop
Related:
SAFe metrics
Competency | Complex measurement of the organization's commitment and follow-through on the core competencies of SAFe. |
Flow distribution | Amount of different types of work (e.g. new features versus bug fixes) completed over time. |
Flow efficiency | Measures the percentage of active time versus non-active time required to complete tasks. For example, if your flow efficiency is 20%, it means work items spend 80% of their time in waiting stages (e.g., review, approval, or testing). |
Flow load | Tracks the total work in progress (WIP) across all stages of the workflow. Similar to WIP metrics in kanban, flow load helps ensure teams are not overwhelmed and can maintain a sustainable pace. |
Flow predictability | An aggregate measure of how consistently agile teams meet their objectives. High flow predictability indicates teams can reliably plan and deliver on commitments. |
Flow time | Captures the total time a feature exists, from initial creation to customer delivery. Similar to lead time in Kanban, flow time provides insight into the overall efficiency of the delivery process. |
Flow velocity | Measures the number of work items completed in a specific time period. Like throughput in kanban, this metric reflects the team's delivery capacity and helps with forecasting future work. |
Related:
Agile engineering and code metrics
Some agile teams (especially those practicing DevOps and continuous delivery) also look at code metrics. These engineering metrics give deeper insights into the technical aspects of quality and productivity.
Code coverage | Measures the percentage of lines of code tested by automated tests. Higher code coverage typically indicates more robust test coverage. This metric is also referred to as "test coverage." |
Code quality | Assesses the overall "goodness" or "badness" of code. Code quality is subjective and should be defined by your development team using agreed-upon standards, such as readability, maintainability, and adherence to coding best practices. |
Code review time | Tracks the time it takes to complete code reviews. As a productivity metric, teams often set goals for completing reviews within a specific time window to maintain efficiency without compromising quality. |
Defect resolution time | Measures how long it takes to fix identified defects. Many teams establish target timeframes to ensure quick resolution and minimize disruption. |
Defect density | Calculates the number of bugs or defects per 1,000 lines of code. This metric helps assess the overall quality of the codebase and identify areas that may require more rigorous testing or review. |
Deployment frequency | Tracks how often new code is deployed to production. Higher deployment frequency can indicate efficient development pipelines and strong DevOps practices. |
Escaped defects | Counts the number of issues discovered after a release or deployment is in production. A high number of escaped defects can reveal gaps in QA processes or inadequate testing. |
Failed deployments | Measures the number of deployments that fail or require rollback due to errors. This metric helps identify weaknesses in deployment pipelines and testing practices. |
Production downtime | Tracks the time work spends in a queue due to waiting for review, approval, fixes, or other dependencies. Monitoring downtime helps identify bottlenecks and improve workflow efficiency. |
Quality intelligence | A comprehensive metric that evaluates the overall quality and viability of your products, not just individual tasks in progress. Quality intelligence provides insights into the health and maintainability of the product over time. |
Release frequency | Measures how often completed releases are delivered to users. Unlike deployment frequency, which focuses on continuous integration, release frequency is typically less frequent and reflects planned product updates or feature rollouts. |
How do you track agile metrics?
Once your team selects a few key metrics to track, the next step is finding the right tools to monitor and report on them. With Aha! Develop, you can track team-related metrics and gain deeper insights into performance trends. Here are a few examples of reports available in Aha! Develop:
Cumulative flow diagram: Visualizes work items over time, segmented by workflow status, to identify bottlenecks and monitor team capacity
Cycle and lead time report: Shows how long it takes to deliver work — so you can more accurately set delivery dates
Delivery risk report: Highlights at-risk records so you can address potential issues proactively, ensuring timely delivery
Throughput report: Measures your team's performance over a given period, calculating throughput by records completed or work logged
Sprint burndown chart: Tracks completed and remaining work throughout your sprint to monitor progress and ensure you are staying on pace to finish on time
Velocity report: Shows your team's average velocity, helping predict capacity to complete work in a given time period
Connecting Aha! Develop with Aha! Roadmaps creates a unified environment, enabling you to report on progress across the entire product development lifecycle in one tool.
Agile comes with the promise of a higher quality product, a more dynamic team, and more satisfied customers — and agile metrics can provide the proof. Select a few to start, then try adding more or different metrics over time as you explore what is most meaningful for the team. You will start to see the benefits of your efforts represented in a tangible way.
FAQs about metrics for agile teams
Agile metrics focus on tracking development progress, team efficiency, and workflow improvements in iterative cycles. Traditional product metrics often emphasize business outcomes like revenue, adoption, and customer satisfaction. Both are valuable and you should analyze them together to connect day-to-day development efforts with broader product goals.
Prioritize metrics that align with your team’s goals and methodology. For example, scrum teams often track velocity and burndown, while kanban teams use cycle time and cumulative flow diagrams. If you follow The Aha! Framework for product development, focus on metrics that reflect progress toward strategic goals and customer value, ensuring alignment across teams.
Agile metrics provide visibility into how work is progressing and highlight areas for improvement. By tracking trends, teams can identify bottlenecks, improve predictability, and optimize workflows. The goal is to achieve more efficient processes and higher-quality outcomes.
Focus on collaborative problem-solving. Start by analyzing the root cause of the issue, such as unclear priorities or overcommitment. Use the insights to adjust workflows, clarify expectations, and provide additional support where needed.