
Analyze agile metrics
Dig into agile reports to understand performance trends and highlight what your team has accomplished
Dig into agile reports to understand performance trends and highlight what your team has accomplished

Choose from a variety of reports built for agile teams. Review performance and drill in to the underlying data for deeper insights about where to improve — so you can showcase your success and deliver value faster. Connect Aha! Develop with Aha! Roadmaps to report on progress across the entire product development lifecycle in one tool.

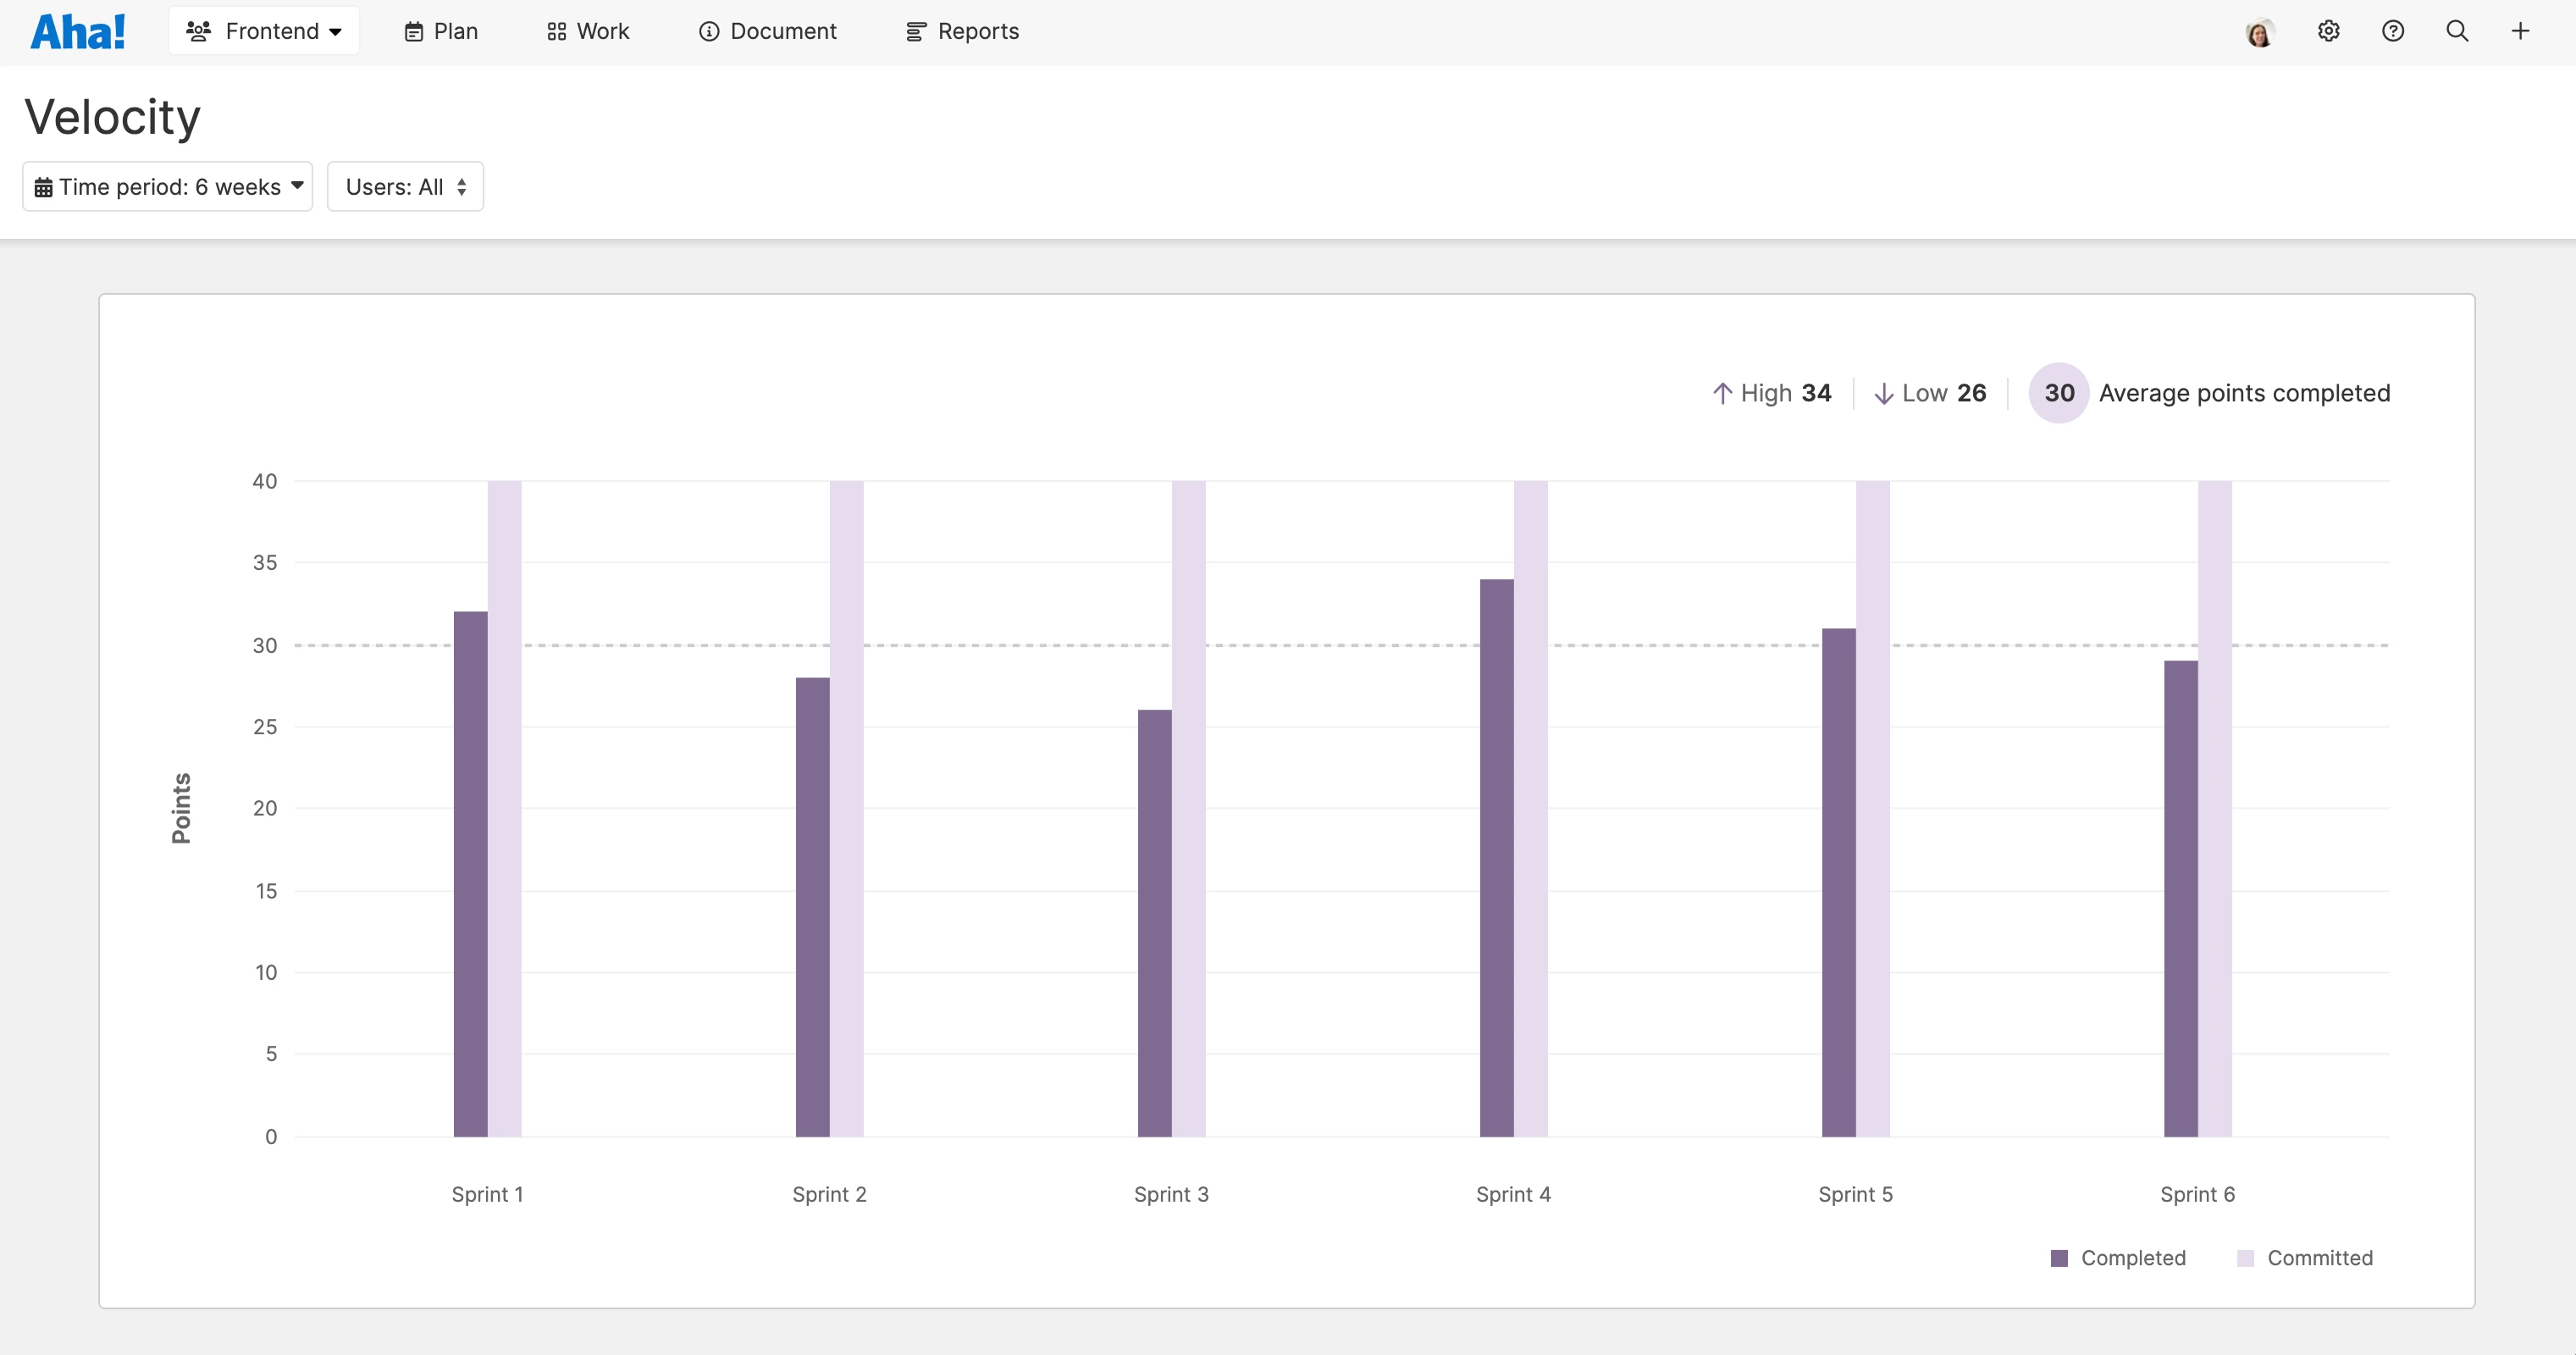
Plan sprints with confidence. Use the velocity report to analyze tempo across sprints and understand what the team can realistically complete. As the iteration gets underway, monitor the team's daily progress with the sprint burndown chart — including completed work, what remains, and what has changed. You will also see new work and adjusted estimates.
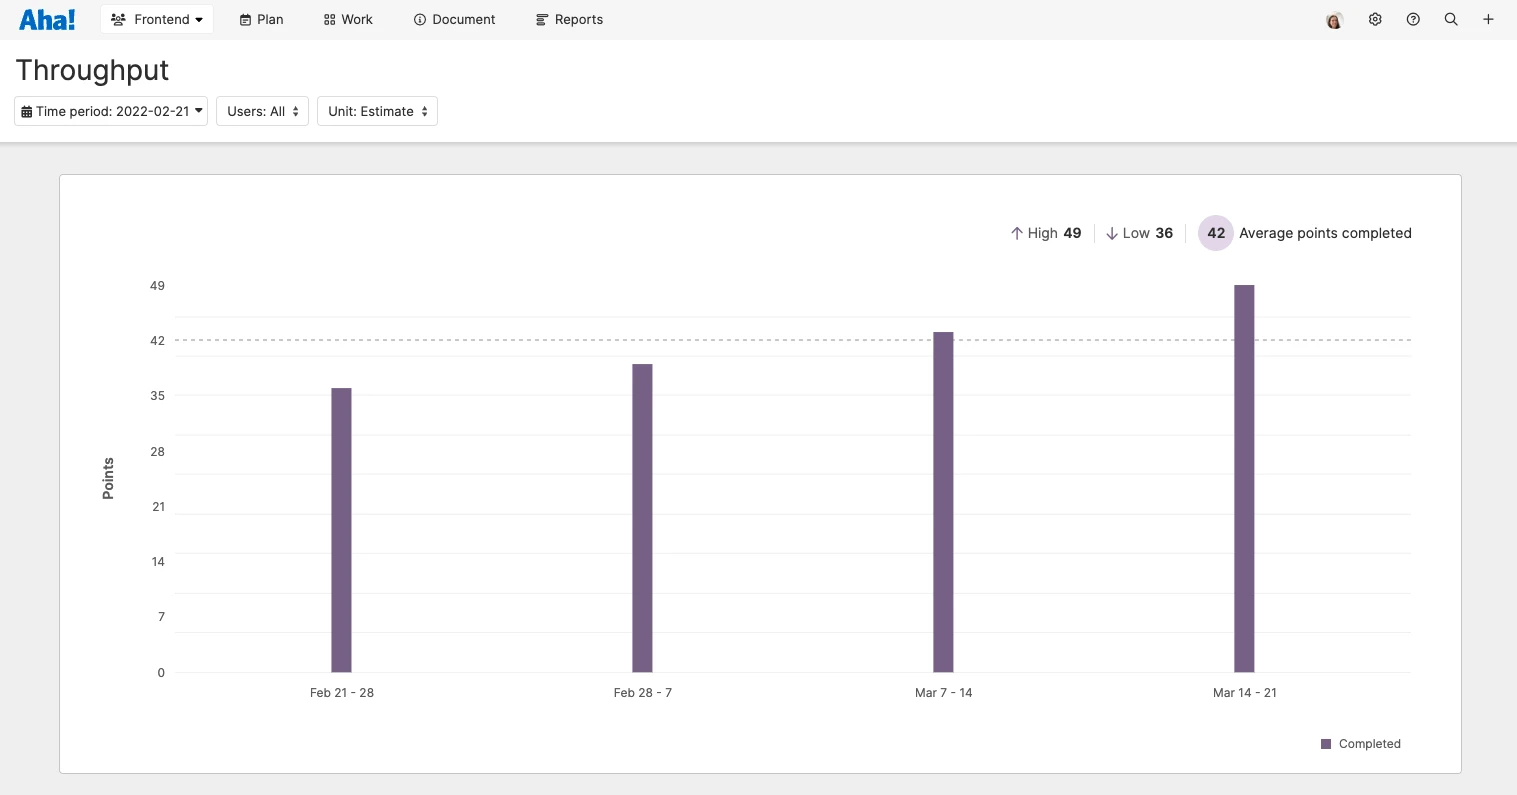
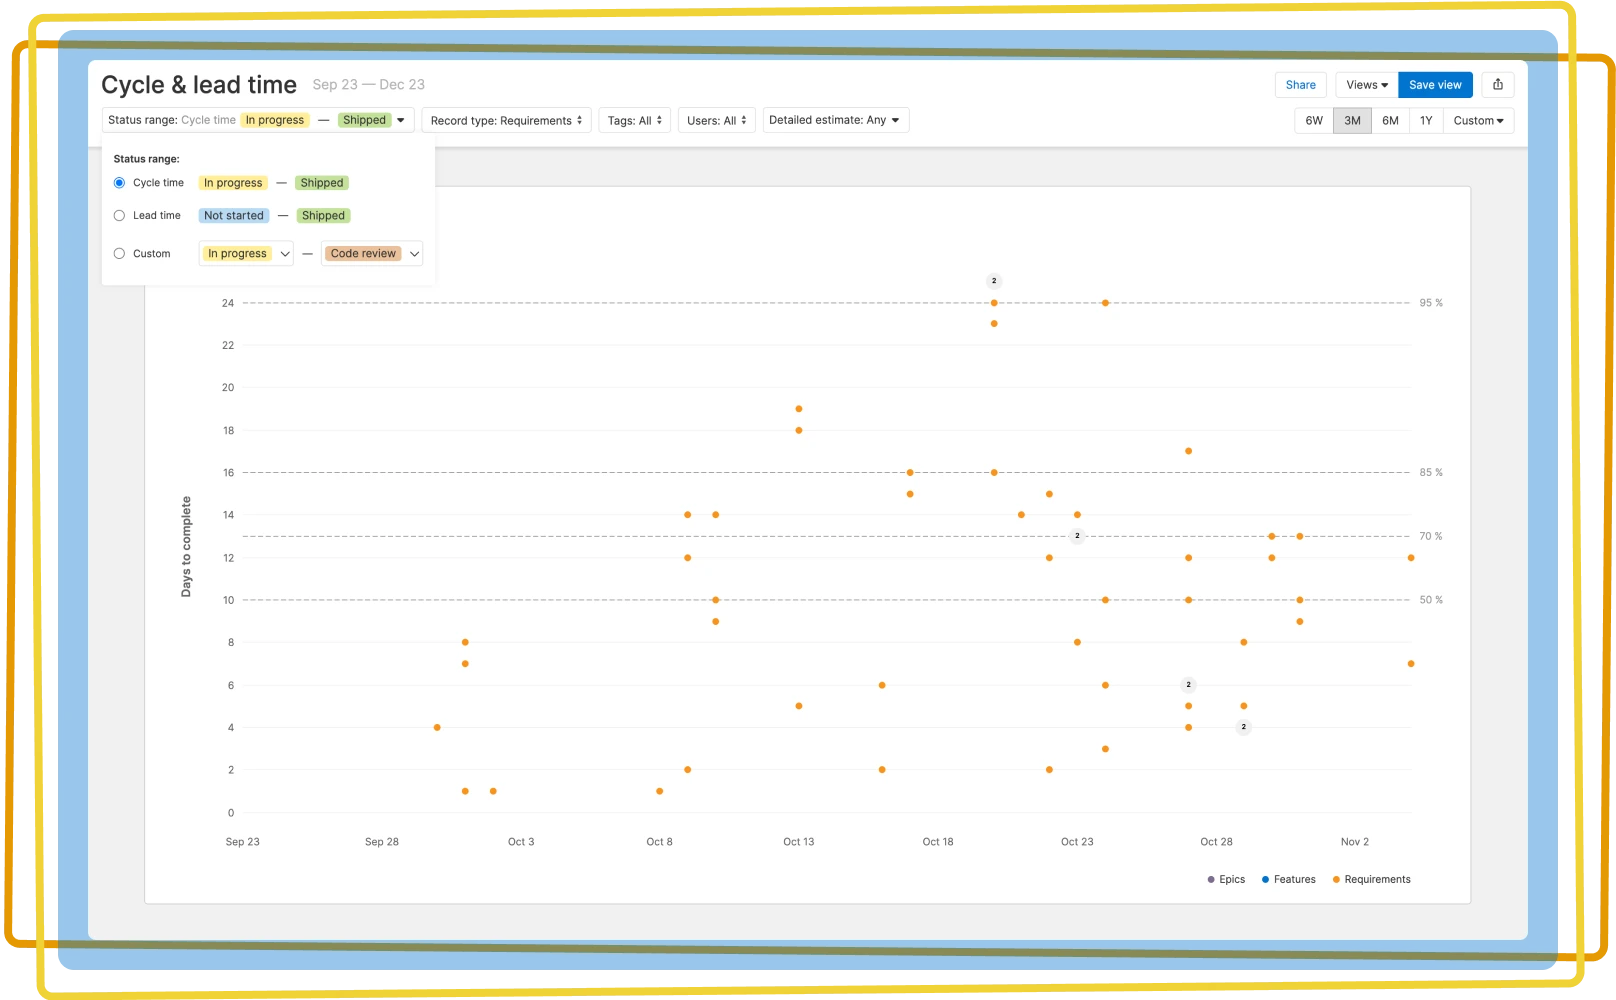
Analyze how efficiently work moves through your process. The throughput report compares work completed each week, calculating the team's productivity over time. Use cycle and lead time metrics to see how long it takes to deliver work and where to improve consistency. The cumulative flow diagram helps you optimize how work moves through your process.
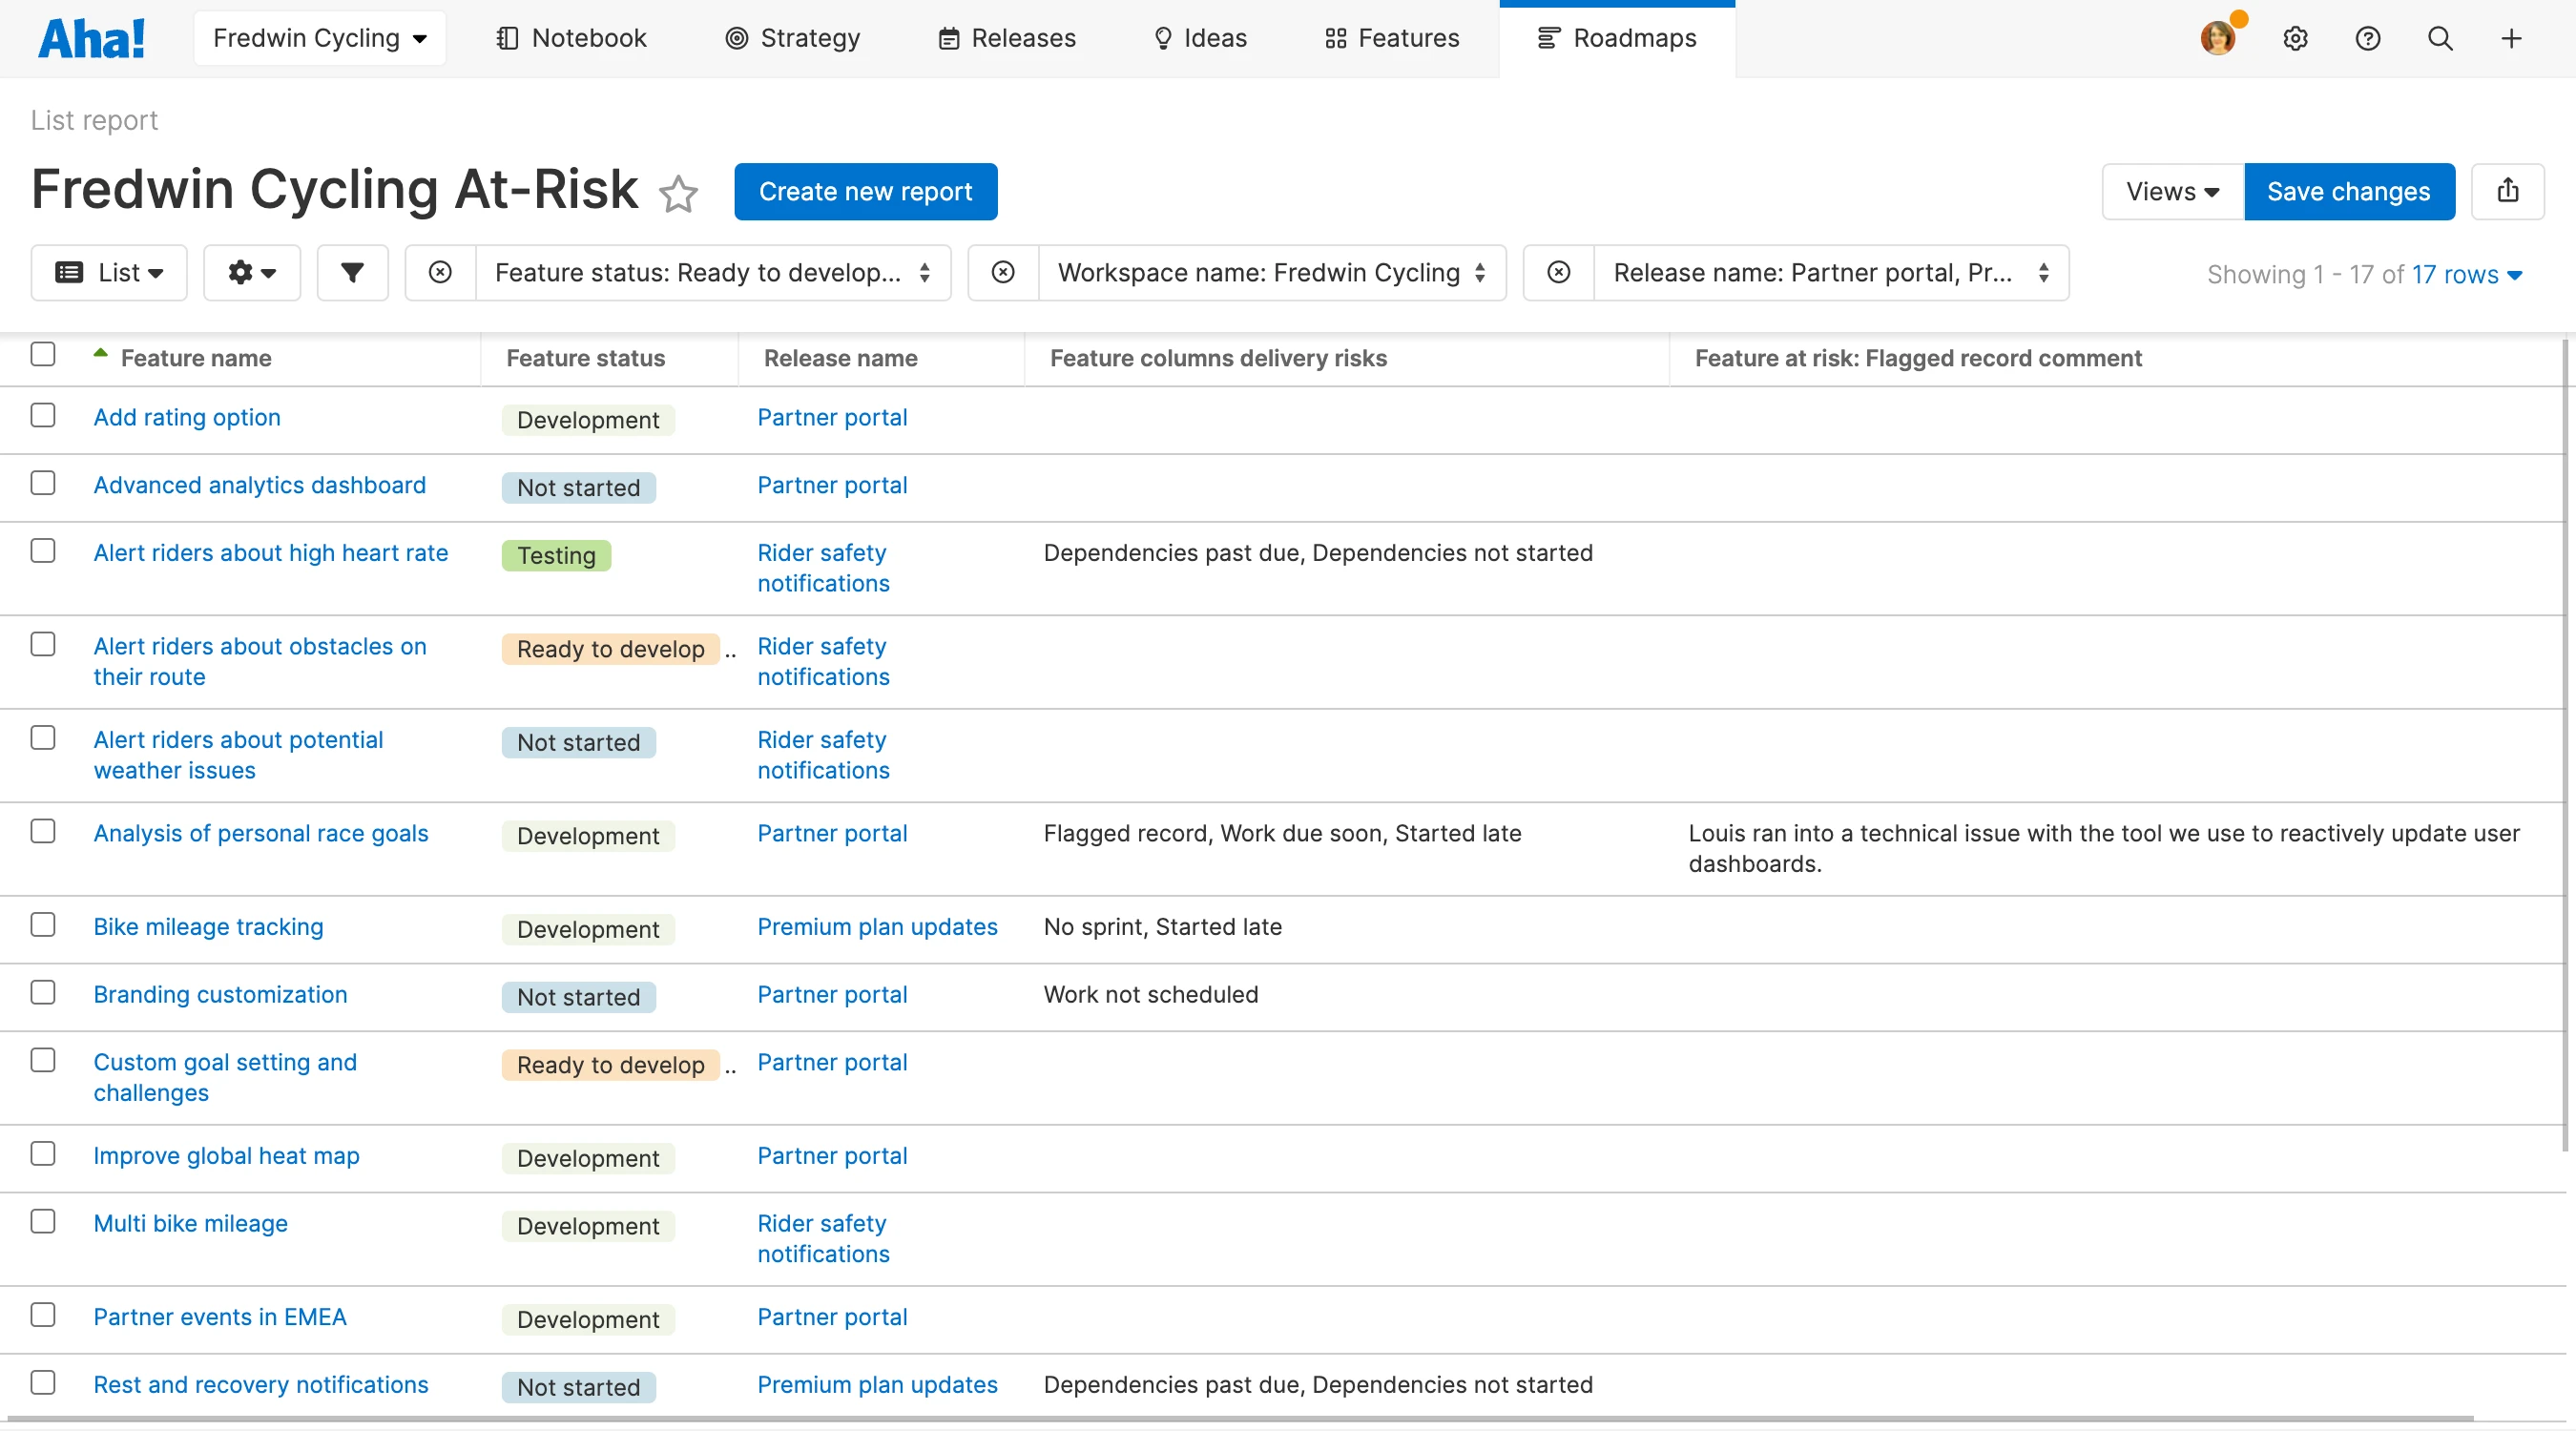
Instantly see when a sprint or program increment is at risk. Set alerts for various types of delivery risks, such as overdue or stalled features. Use an interactive bar chart on the sprint planning or PI details page to get a complete view of which work items are at risk and why. You can also include delivery risks in reports in Aha! Roadmaps to increase transparency.
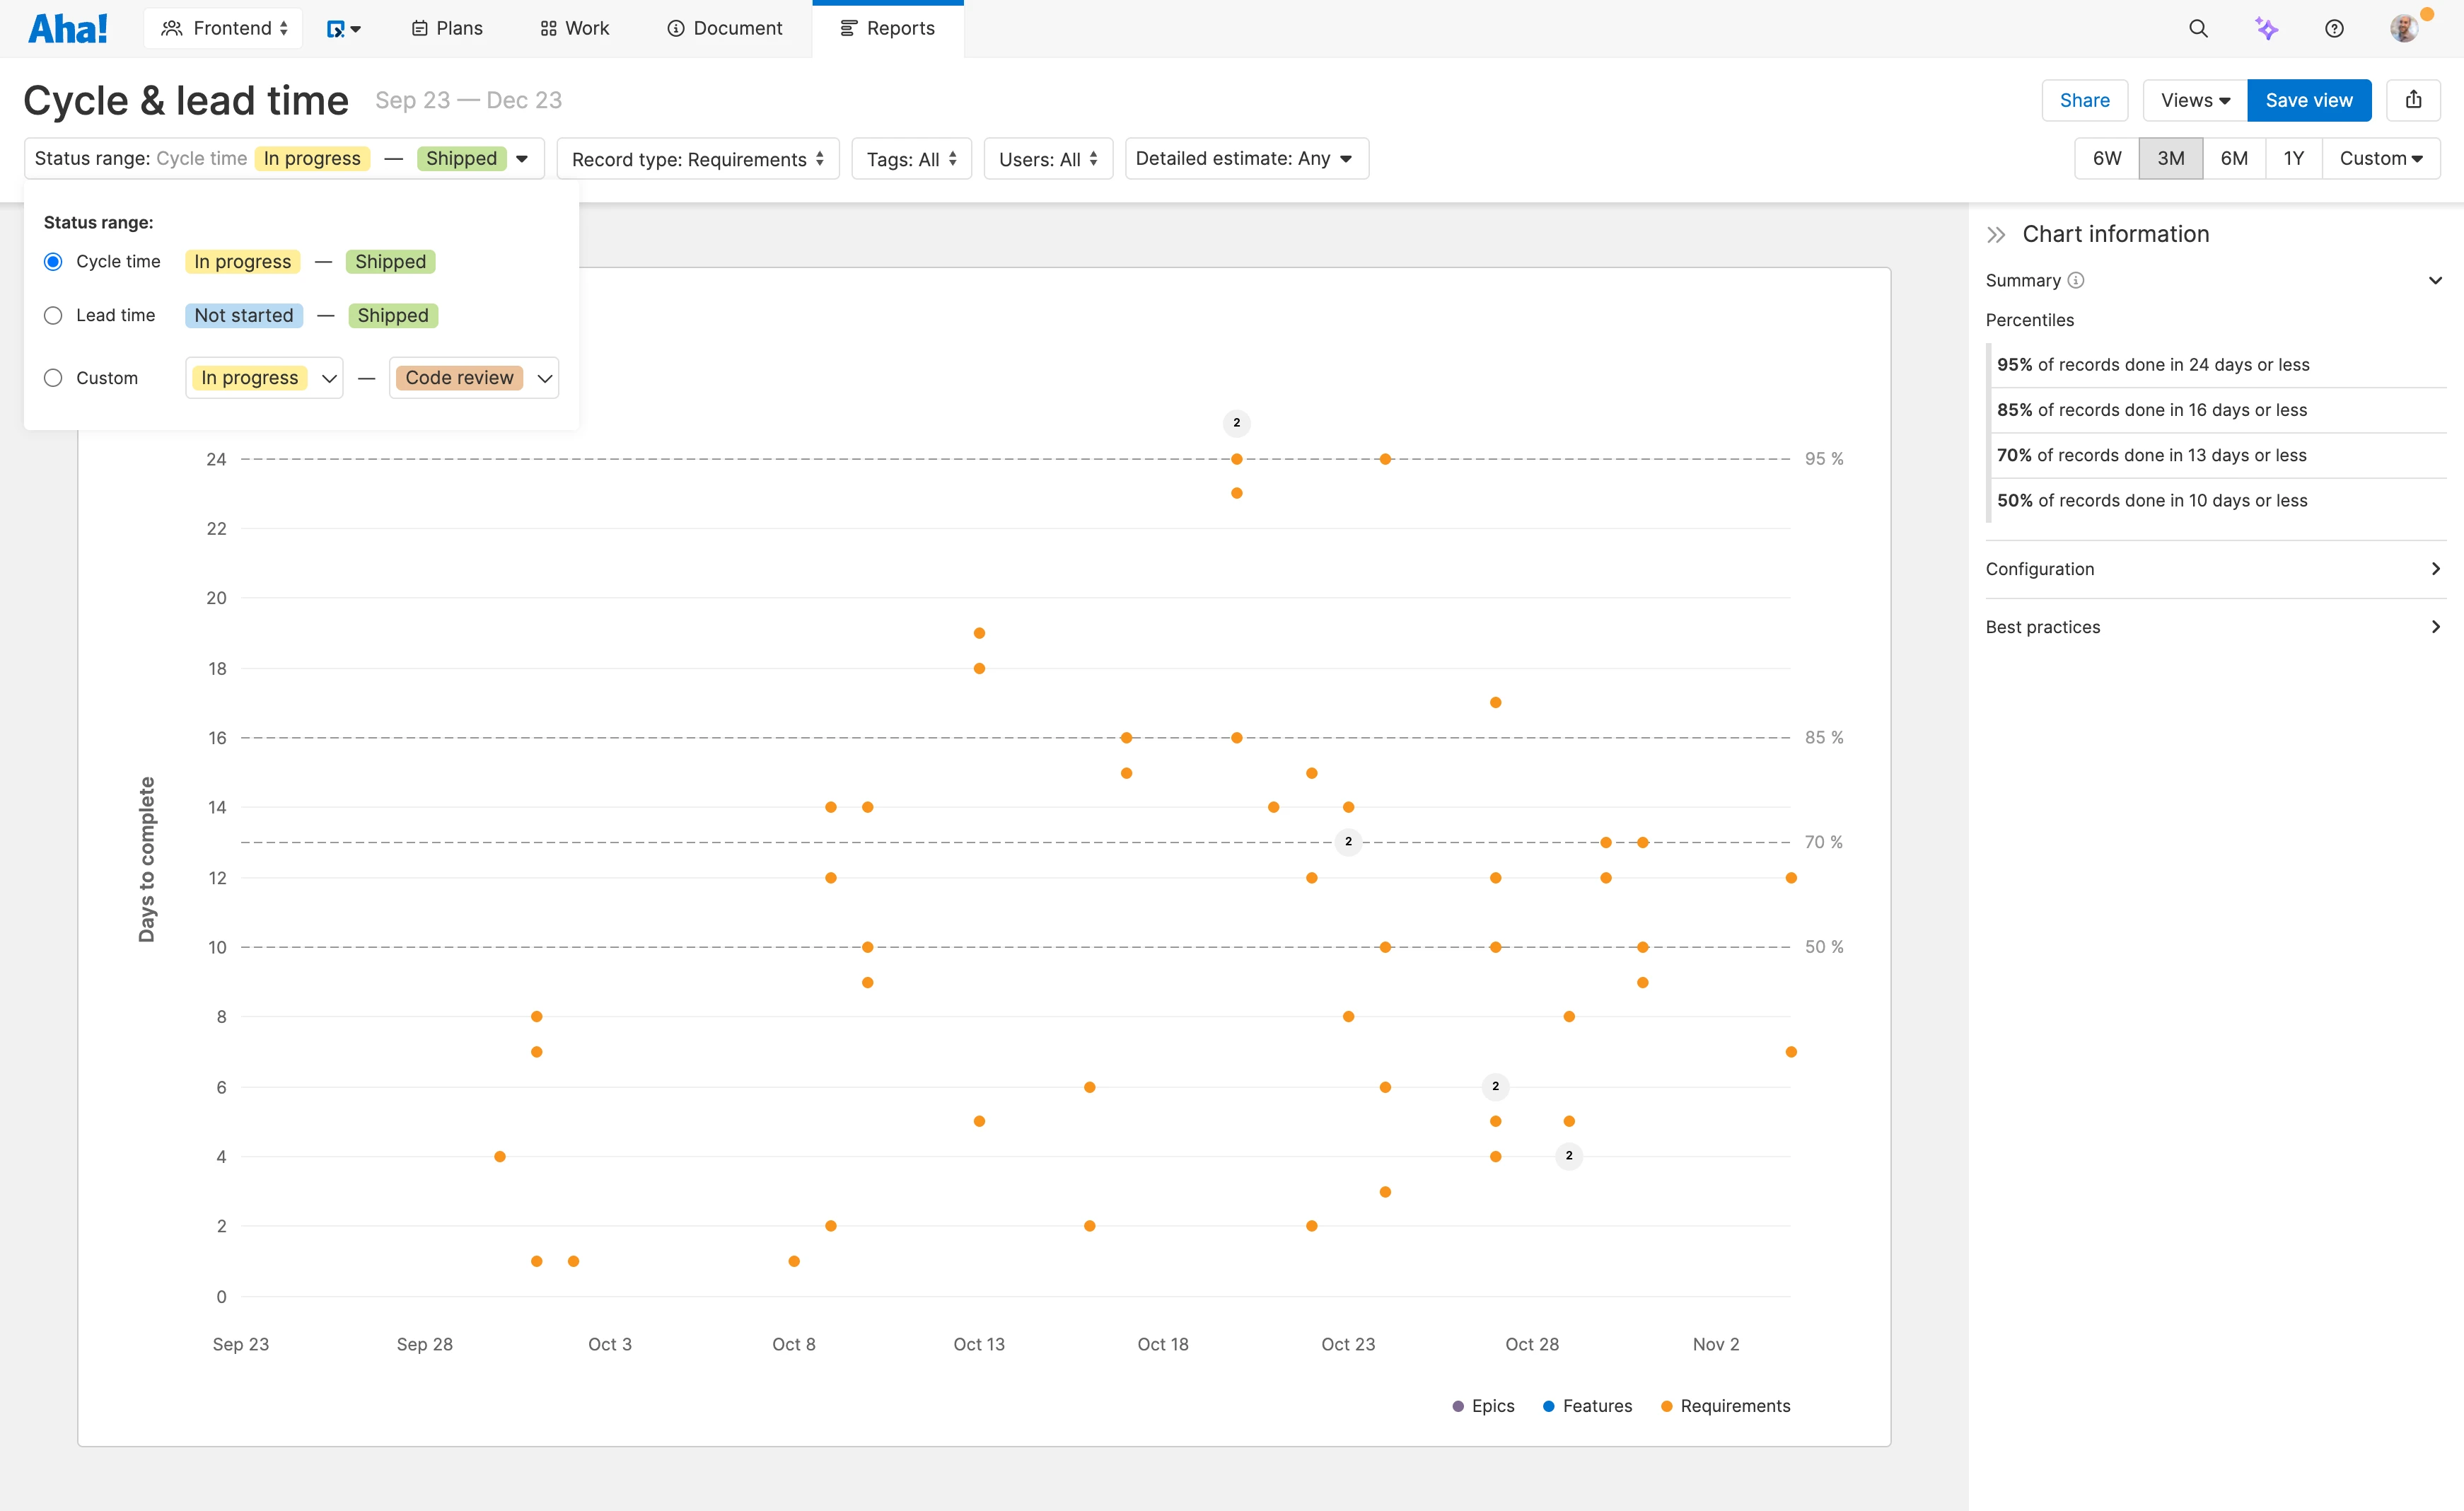
Estimate work more accurately based on past cycle and lead times. Understand the range of delivery times that are typical for your team. Then, use this data to predict how long development will take for new features. Spot bottlenecks in your process with the workflow heatmap. Dig into the root cause — to keep work moving efficiently.
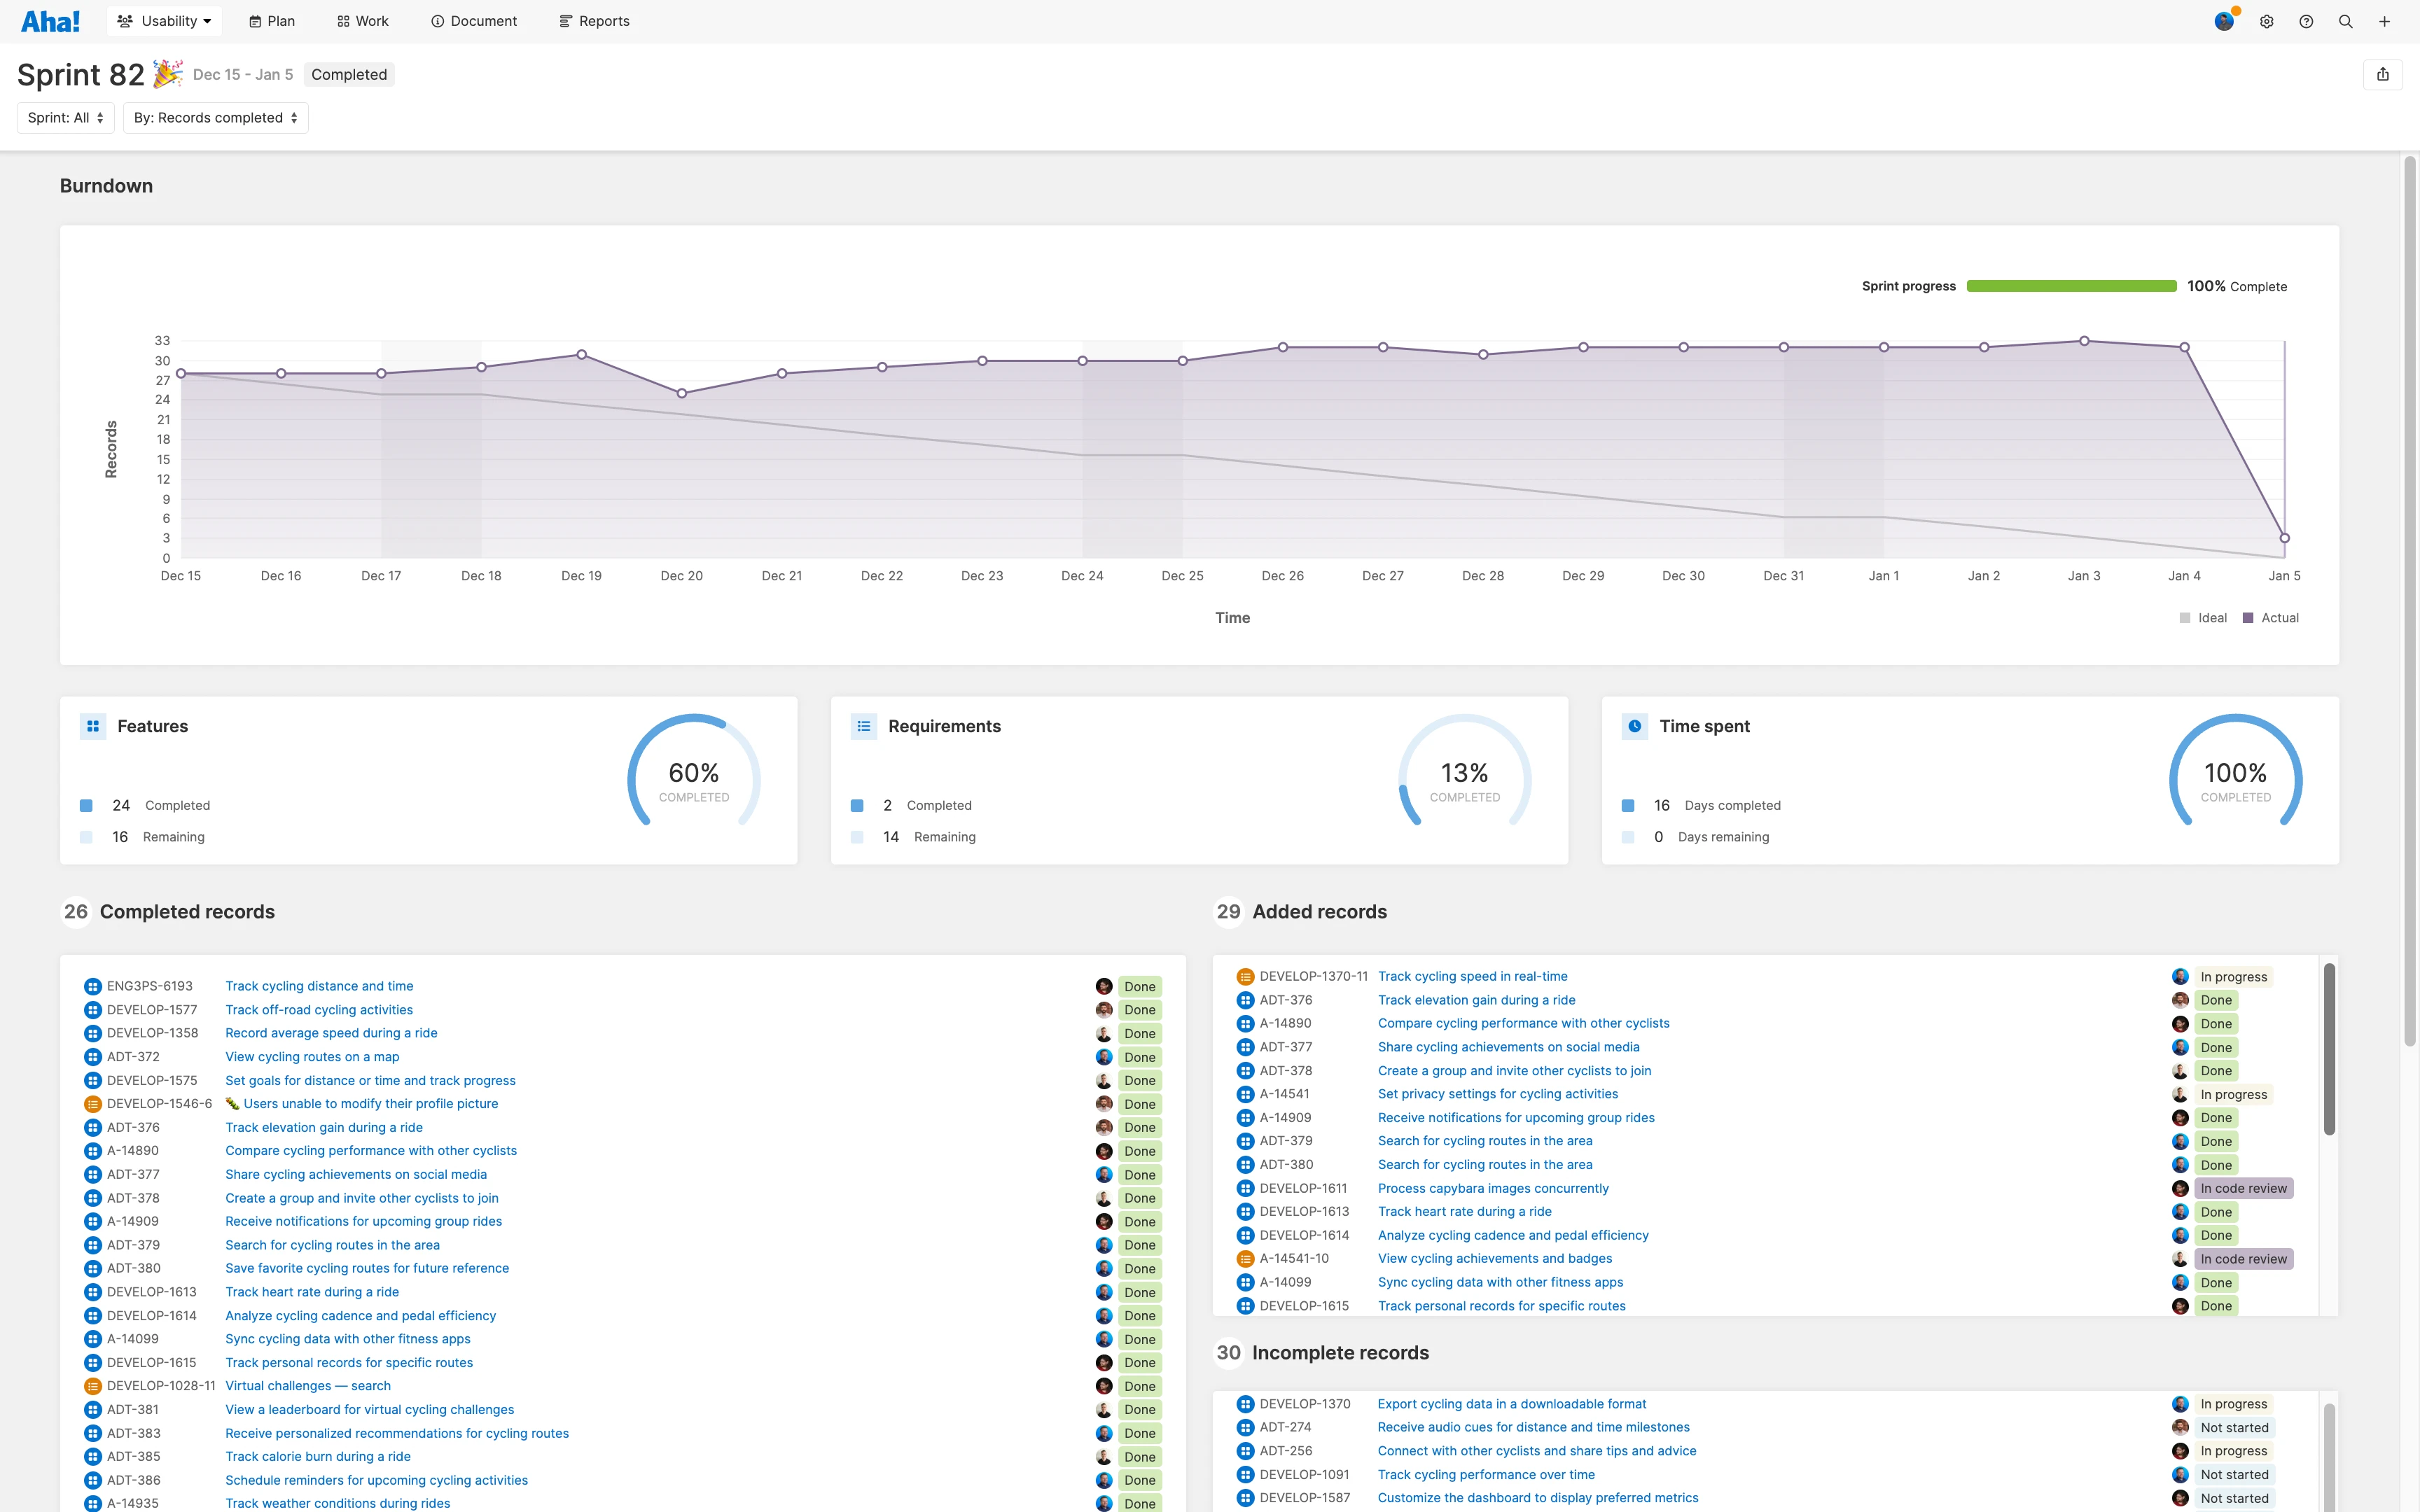
Recognize wins, discuss issues, and find ways to improve. The sprint retrospective report analyzes the plan versus what actually happened in one view. Compare previous sprints to look for trends (like taking on too much work or inaccurate estimates) so you can plan the next sprint more effectively.
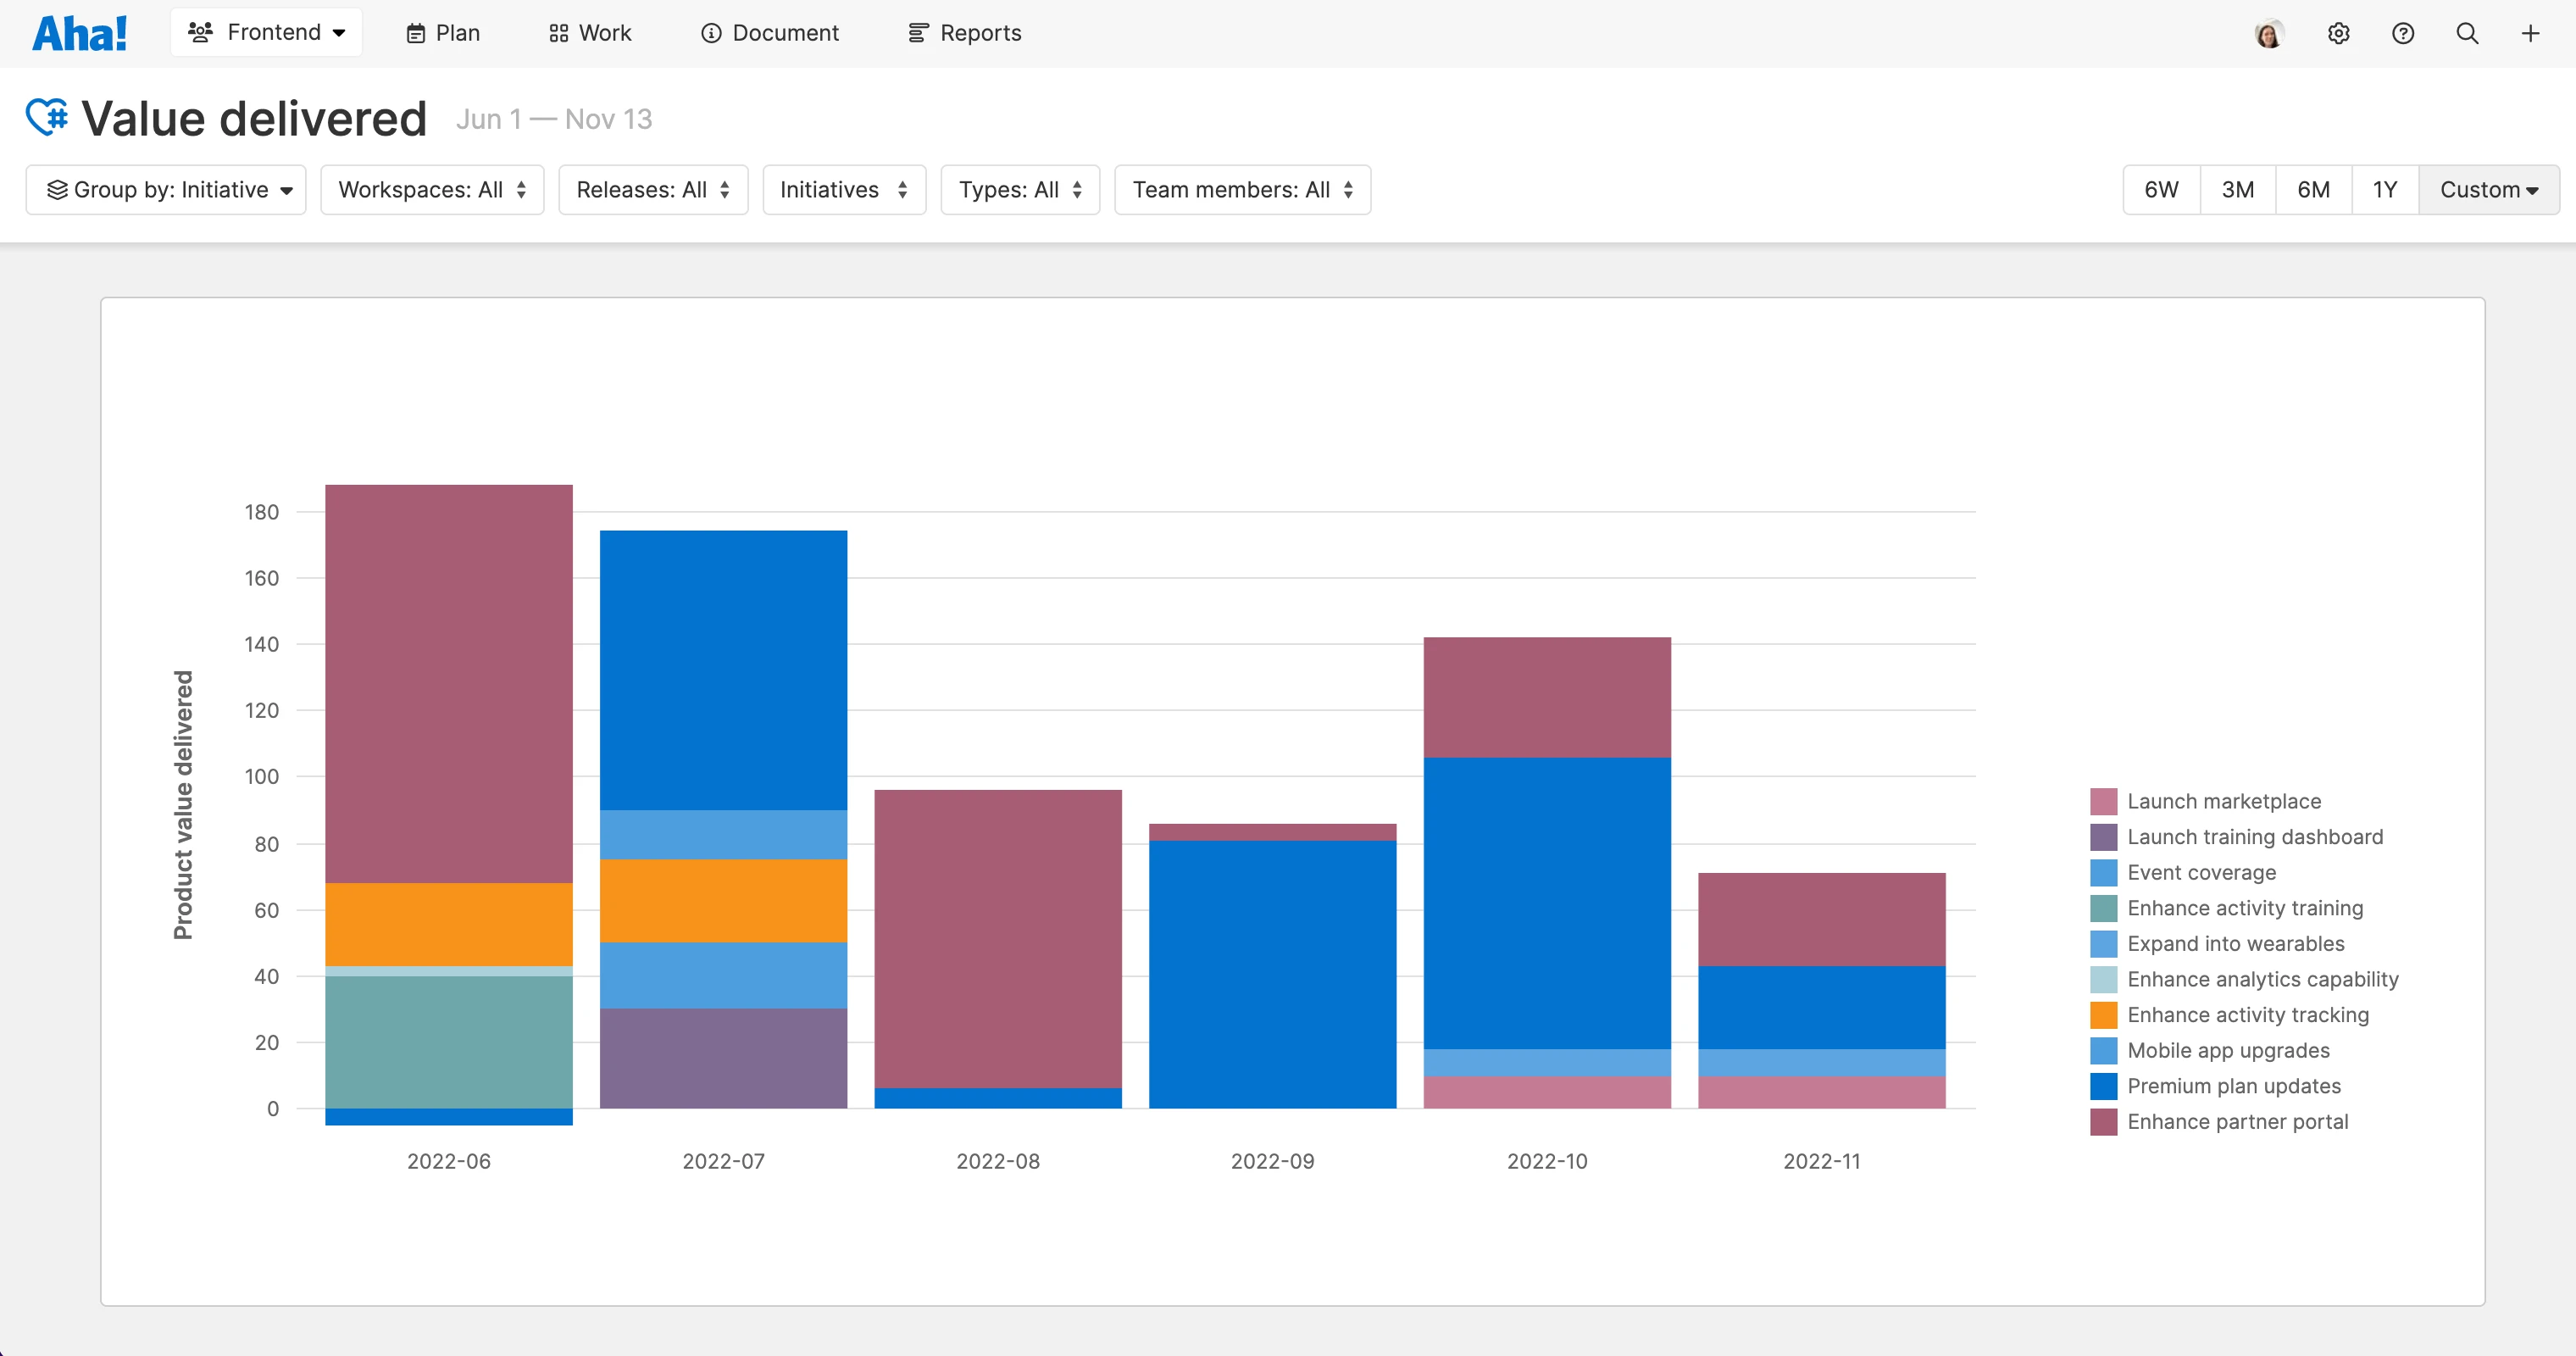
Showcase the team's accomplishments. The value delivered report assesses the impact of your product development efforts in the context of customer and business value. Analyze the value of shipped features by strategic initiative, release, or feature type to recognize the team's contribution to your product's overall success.