Explore  

What are product metrics (and which ones should you track)?

How do you gauge the success of your product? Maybe you look at user count, revenue generated, or customer feedback received. (Hopefully, it is some combination of this and more.) These specific data points, or product metrics, help you assess the performance and success of your offering.

For product managers, product metrics provide measurable insights into what you are building and how you can improve it over time. For example, you might be assessing customer engagement with newly released functionality or looking at data to understand when website visitors sign up for a trial account. Quantitative product metrics provide proof points that inform your analysis — ultimately helping determine the level of value you are delivering.

Build products like you always wanted — start a free trial of Aha! Roadmaps.

Product metrics are often grouped into four categories — business metrics, product usage metrics, customer satisfaction, and roadmap progress. (We will dig more deeply into these later.) And within these categories, there are literally hundreds of different metrics you could track.

Understandably, it is easy to become overwhelmed — which should you measure and why? Be purposeful. First, gain an understanding of the different types of product metrics and determine what matters most to your team and the business. Then, you can get started with a core set of metrics and refine or build on them over time.

Let's explore why product metrics matter and which ones are most commonly used in product management today. Jump ahead using the links below.

Why should product managers track product metrics?

As a product manager, you provide the expertise needed to make strategic decisions throughout the product lifecycle — product development, launch, growth, maturity, and decline. Tracking product metrics helps you make critical decisions informed by data at every stage.

You also use product metrics to enhance customer understanding on a large scale. By measuring things like engagement and retention, you can prioritize features that resonate most with your users. Without strong reference points like these, you are relying on educated guesses and gut feelings. Both are risky (and ultimately avoidable).

Metrics can also inform how you define and refine product goals and initiatives. You can often do this by identifying specific metrics that align with your desired outcomes. For example, a goal to accelerate user onboarding and increase your activation rate by 20 percent is meaningful because the desired outcome is tied to a metric. Connecting goals to measurable results allows you to track progress objectively, identify challenges early, and celebrate team achievements.

Related:

In addition to quantitative product metrics, do not forget to also gather qualitative feedback — from an ideas portal, support tickets, customer calls, or targeted empathy sessions. Both quantitative and qualitative data help you gain a clearer understanding of the Complete Product Experience (CPE), so you can think more broadly about what you are creating and how to make it better.

Read more: How to make data-driven product decisions

What is the difference between product metrics and product analytics?

On paper, metrics and analytics sound like the same thing. But technically, they are different:

  • Metrics are the specific data points that inform your analysis

  • Analytics refers to the information you can glean from data

Product analytics is the process of analyzing how users engage with your product. A big part of the analysis involves collecting the right data — that is where product metrics come in. The data you secure by tracking product metrics feeds into your analysis and helps uncover insights that inform your product decisions.

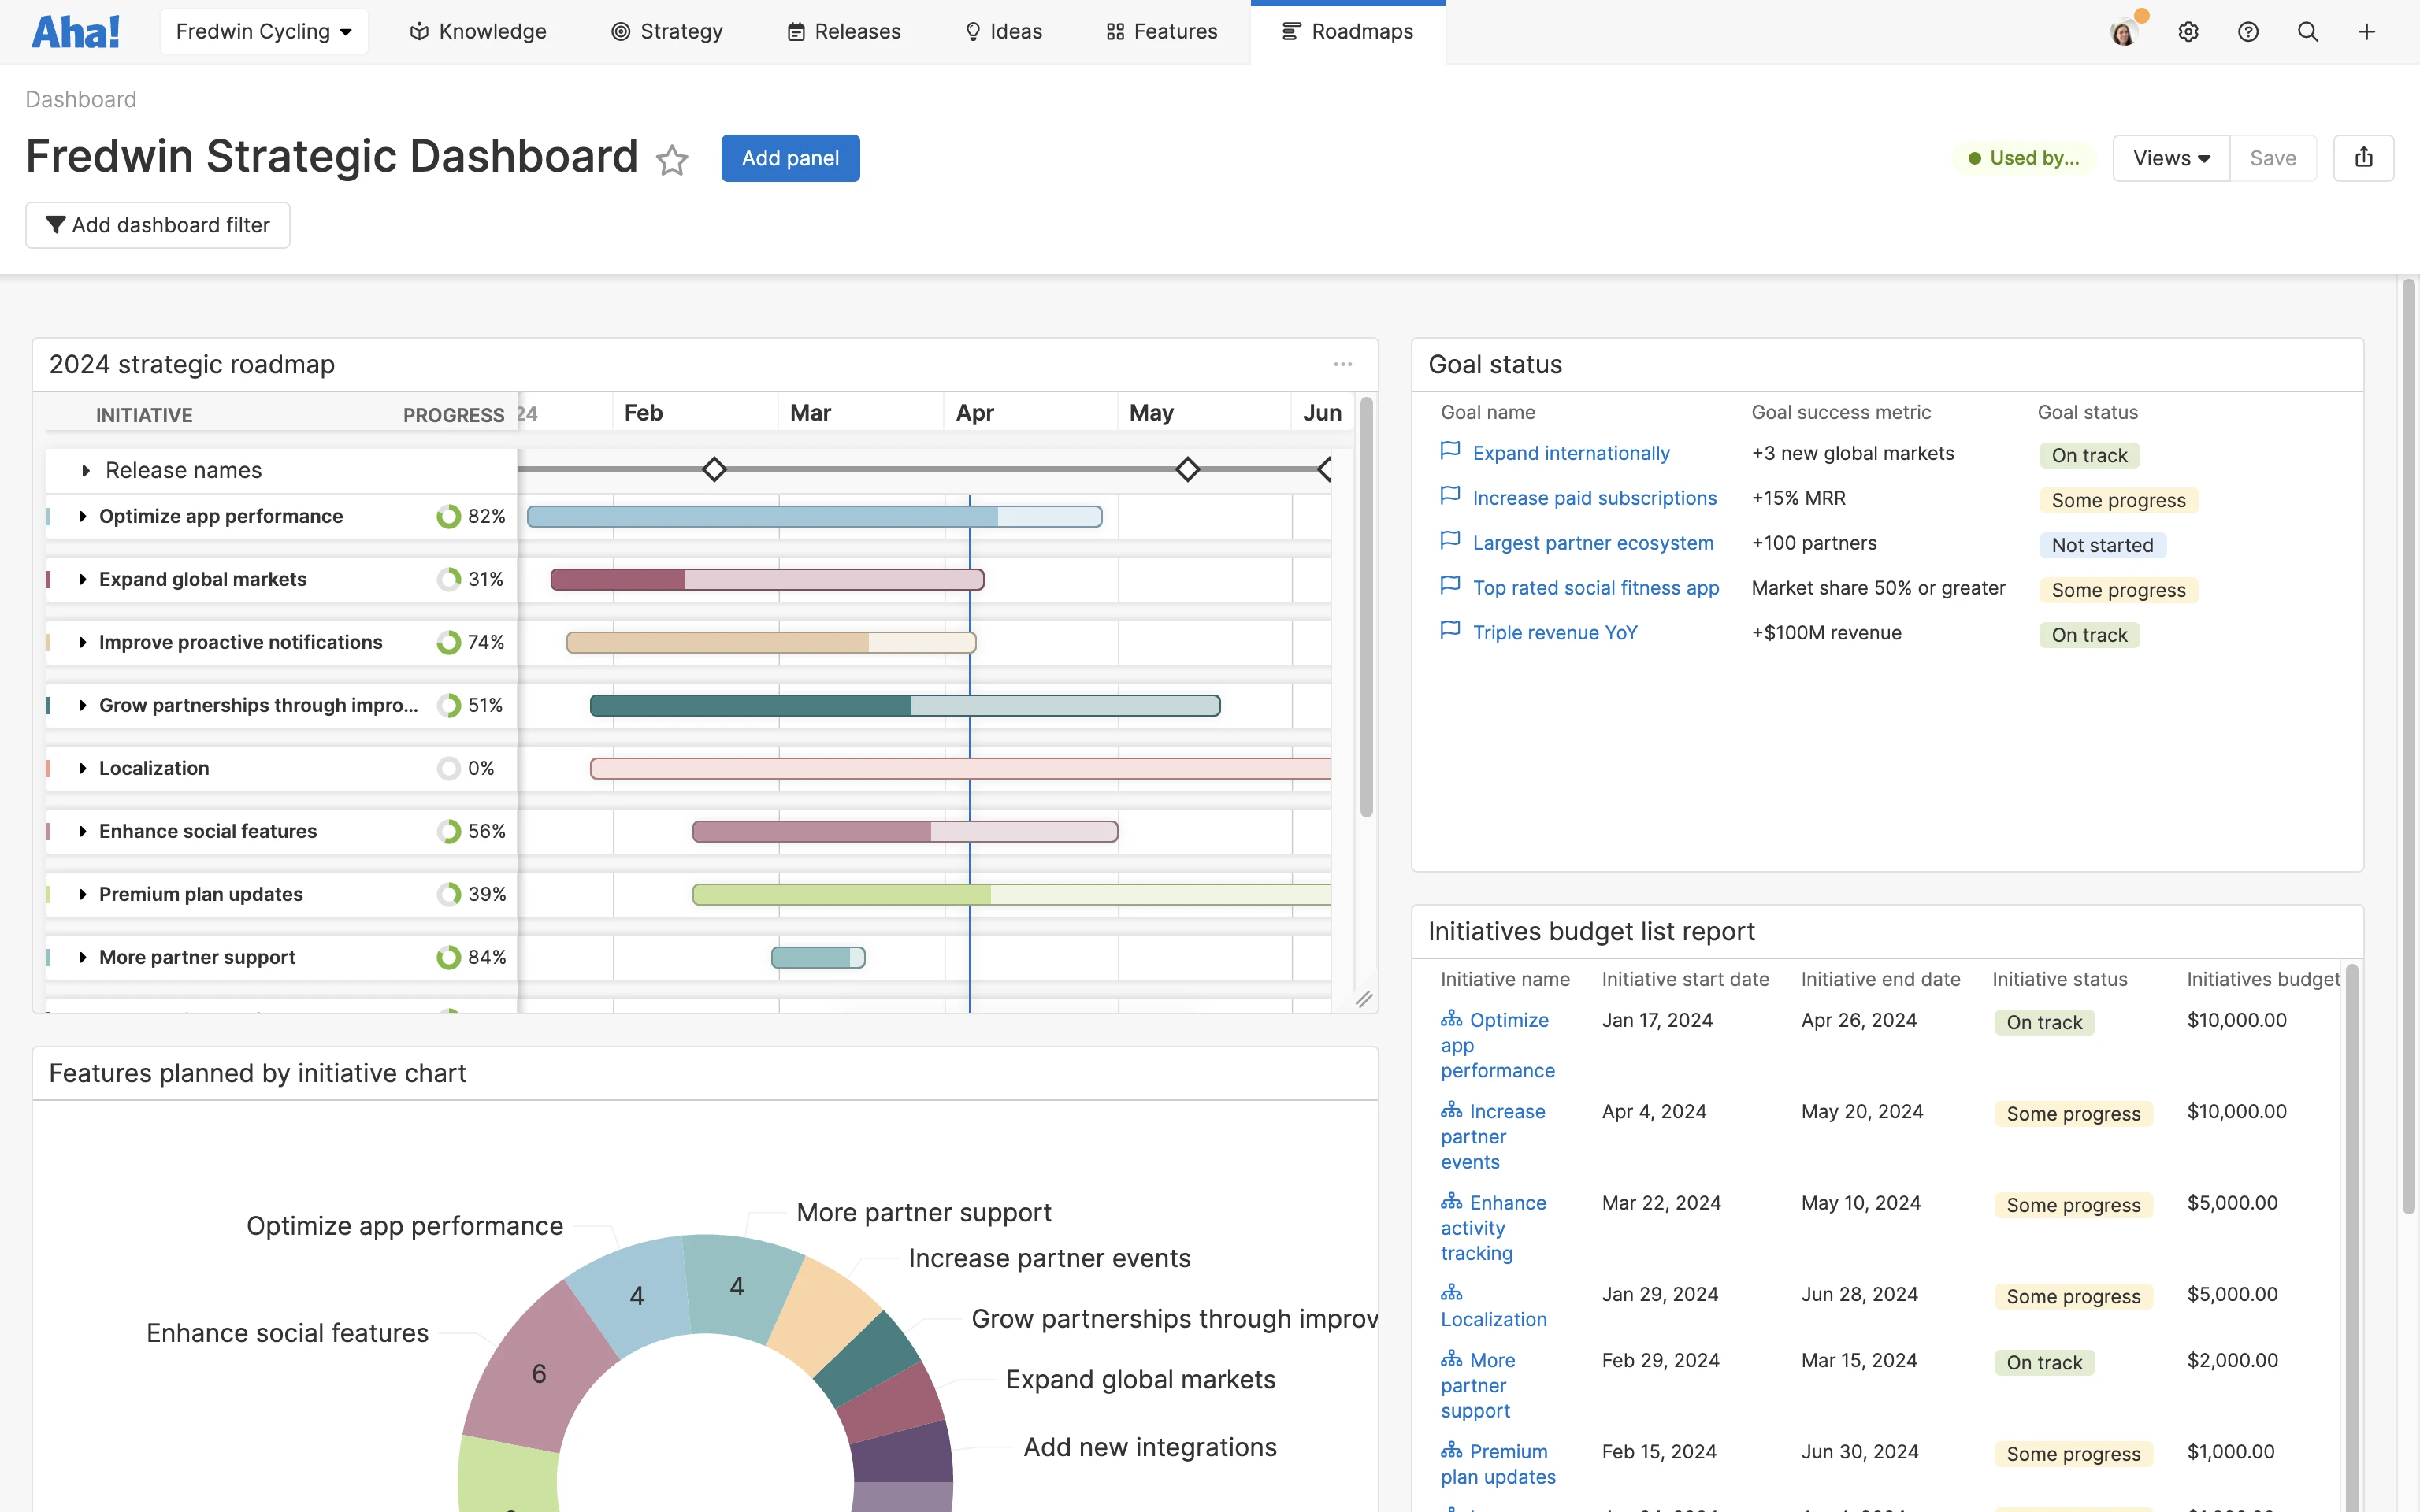
Of course, analyzing thousands of data points manually would be incredibly daunting. This is why many product teams invest in a product analytics tool to collect, understand, and visualize product data in one place. With Aha! Roadmaps, you can report on nearly every data element in your account, then tailor your dashboard to include the exact information you need. For example, take a look at the product performance dashboard below — focused on progress made towards strategic goals.

sidekick image / product performance dashboard 2023

Related:

What are the most common types of product metrics?

There is not one "right" way to measure success. It largely depends on which metrics will be most useful and informative for your team. For example, engineering teams are concerned with technical performance, so they typically prioritize metrics like system response time and error rates. Marketing teams are interested in attracting and retaining users, so they lean more heavily into metrics like user acquisition and conversion rates.

Product managers typically focus on a variety of product metrics to measure performance. Some metrics matter more than others depending on the nature of your product, the stage of development, and your company's overall goals.

In general, product metrics are grouped into these categories:

Business metrics

Data around company performance such as revenue, churn, and conversion rate

Product usage metrics

Usage data that shows how users interact with your product or offering

Customer satisfaction

Metrics that help you understand whether customers are happy with their experience

Roadmap progress

Reference points showing how the product team is progressing against timelines

Selecting the most relevant product metrics to track starts with setting clear goals and business objectives. Match your goals with the metrics that will accurately indicate if you are reaching them.

One way to get started is to establish OKRs (objectives and key results) that define exactly what you want to accomplish and what results will best reflect the desired outcome. To quickly capture and share your thinking, use a lightweight OKR template in Aha! Knowledge — along with 50+ product management templates.

Try the template below in Aha! Knowledge. Sign up for a free trial.

OKRs large

An example of OKRs using a whiteboard template within Aha! Knowledge.

20+ examples of product metrics you should track

Here are some of the most commonly tracked product metrics in each category. If these metrics do not fit your product or offering, use them as inspiration to identify others that will best suit your needs.

Business metrics

With any product, it is important to understand how you are attracting, converting, and retaining paid customers. Consider tracking the following business and marketing metrics:

  • Annual recurring revenue (ARR): Annual value of recurring revenue from all customers (excluding one-time fees and variable fees).

  • Churn: Percentage of customers that you lose during a certain time period, typically calculated monthly and annually.

  • Conversion rate to trial account: Rate at which website visitors sign up for a free product trial.

  • Conversion rate to paid account: Rate at which trial users convert to a paid account.

  • Customer acquisition cost (CAC): Average cost associated with capturing a new customer.

  • Customer lifetime value (LTV): Average revenue from customers over the life of the relationship.

  • Monthly recurring revenue (MRR): Recurring revenue at the end of a given month — including new and existing customers.

  • Website visitors: Number of unique and repeat visitors to your website each month.

Product usage metrics

Understanding how people actually use your product is crucial for identifying which areas need attention. Commonly tracked product metrics that demonstrate product health and engagement include:

  • Daily active users (DAU) or monthly active users (MAU): Number of customers who use your product on a daily or monthly basis.

  • Feature usage: Number or percentage of customers who use a certain feature or set of features.

  • Session length: Amount of time a customer spends using your product in one session.

  • Sessions per user: Frequency of sessions per customer in a given time frame.

Customer satisfaction metrics

There are few things as validating as hearing your customers rave about your product. If you want to achieve long-term success, you need to earn real love and loyalty from customers. Metrics that indicate customer satisfaction include:

  • Customer satisfaction score (CSAT): Rating of satisfaction with a product or company on a one to five scale (determined by a customer survey).

  • Net promoter score (NPS): Likelihood of your customers recommending your product or company to others (determined by a customer survey).

  • Referrals: Number of new customers acquired based on a recommendation or introduction from another happy customer.

  • Retention: Rate at which customers keep and renew their accounts.

  • Viral coefficient: Average conversion rate of new customers invited by an existing customer.

Roadmap progress metrics

In addition to metrics based on user actions, product managers need to evaluate work in progress to meet deadlines. Roadmap- and progress-related metrics include:

  • Features shipped: Number of new features released to customers in a given time period.

  • Sprint burndown: How the team is progressing towards completing all planned work in a sprint.

  • Velocity: Rate of progress or average amount of work completed in a given sprint or time frame.

  • Work-in-progress: Current features and tasks that are actively being worked on.

Tracking product metrics is an essential part of business success. By measuring and analyzing quantitative and qualitative data, you can better understand your unique product value, make informed decisions, and look ahead with confidence.

Additional resources:

You can set product strategy, gather customer feedback, and report on roadmap progress — all in one place. Try Aha! Roadmaps for free for 30 days as a companion to your product analytics tool.