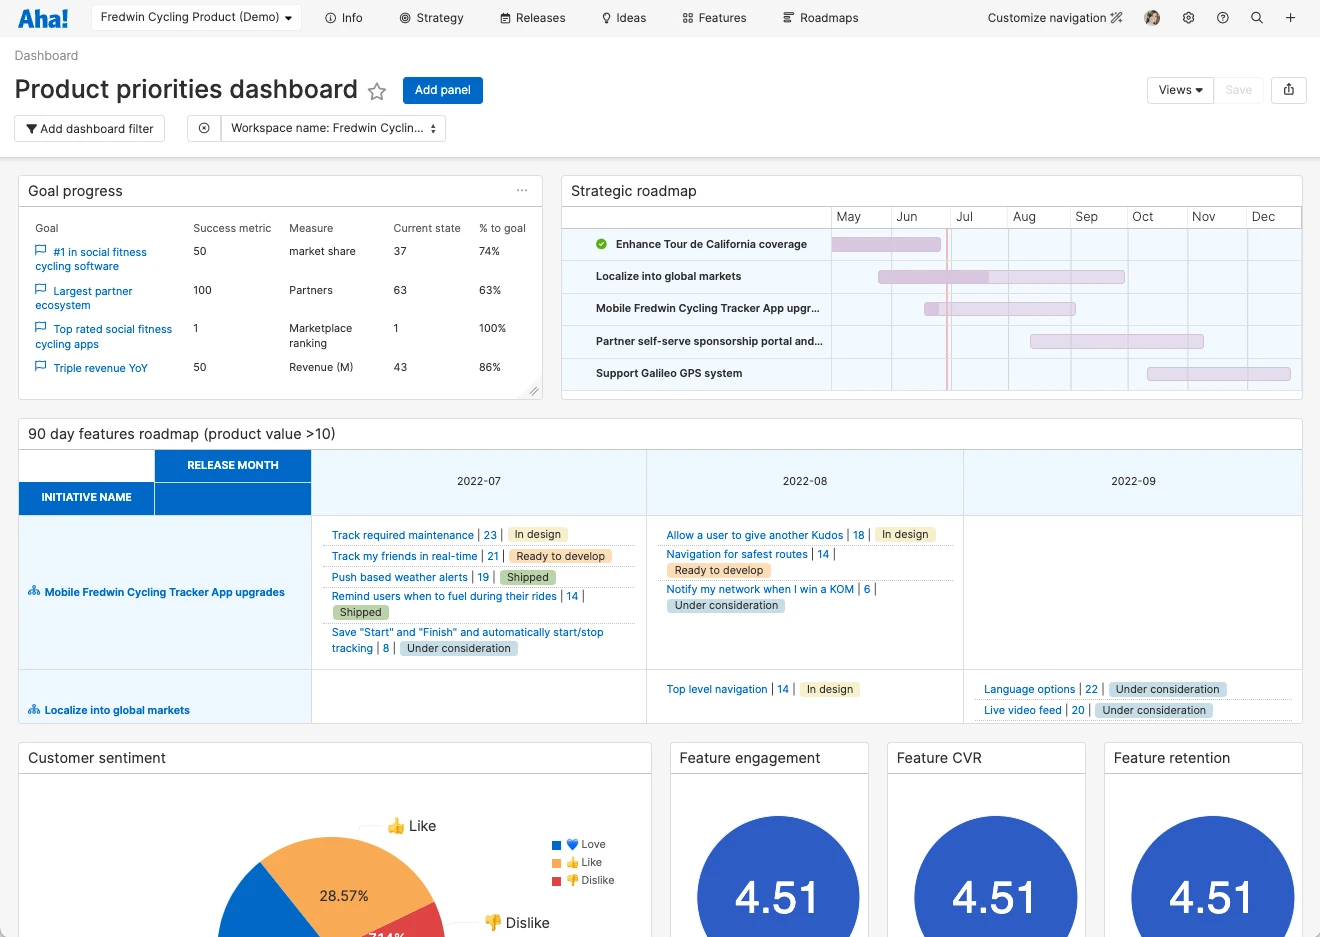
Custom product performance dashboard in Aha!
7 Ways the Aha! Team Reports on Product Development Progress


“Teamwork makes the dream work.” A former colleague used to say this at the end of every meeting. Sure, it is a cliché. And yes, a few eyes would roll. But the sentiment is always worth celebrating. Teams who have a vision — and can deliver on it together — win. There is a real sense of accomplishment when you commit to your goals and reach those big milestones together.
Product development is a team sport. Every player needs to perform at their best to raise the level of collective output.
A cross-functional product development team includes experts from product management, engineering, marketing, innovation, and leadership. Everyone has a part to play. And a successful product is a result of everyone understanding what you are working towards and their role in achieving it.
Different team members will want to zero in on different views of the work based on what is most relevant to their area of focus. Senior leadership needs high-level views to monitor progress towards goals and initiatives (and the time frames for delivery). Marketing appreciates understanding roadmap themes to help craft messaging. Engineers may want to get more granular — looking at specific requirements for upcoming features.
Aha! software gives you an understanding of your plans and progress at each stage of the process. There are more than 75 prebuilt product reports in Aha! Roadmaps, multiple ways to analyze feedback in Aha! Ideas, and a variety of reports in Aha! Develop to help agile teams monitor performance. Our own product development team references a variety of these views in our weekly meetings. These are lively discussions with many topics to cover. Having relevant references helps answer questions and keep us focused.
Being able to report against the same product data and create dynamic custom visuals gives the team a playbook for success.
Of course, every product team is unique. But we all experience the same stages of product development, regardless of what we are building. To use another cliche: "Sharing is caring." So, I asked the Aha! team to share which views they rely on most and why:
Bring strategy into everyday conversations
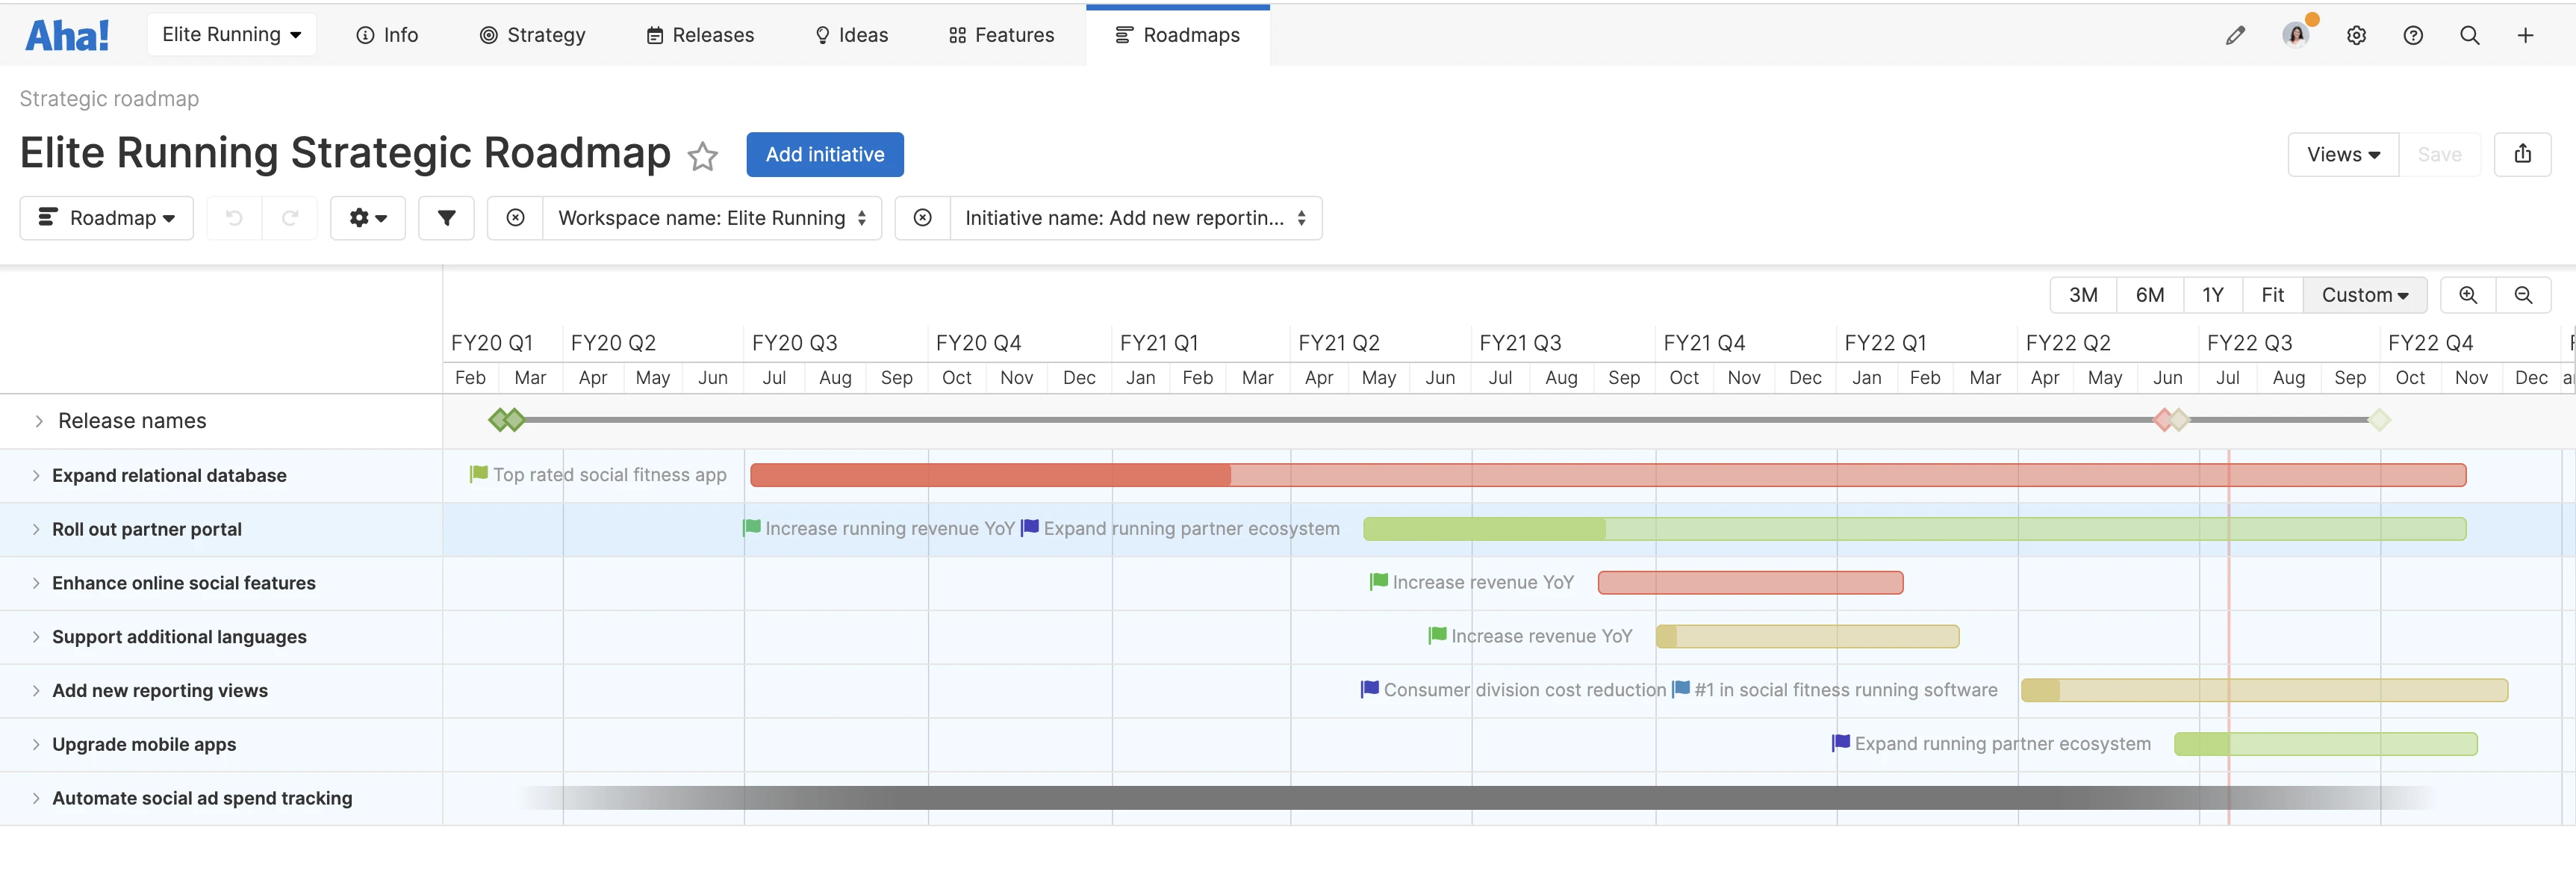
Delivering against your product strategy requires that everyone understands what is coming and why it matters. A strategy roadmap is a go-to for most product managers — you can quickly show where the team is headed and ensure alignment around the most important work.
"A strategy roadmap works well for quickly communicating high-level information. I use it when sharing plans with the rest of our leadership team or giving updates to the broader organization. It is easy to view initiatives along a timeline and the goal that each initiative supports. You can also see progress on each bar as work progresses — which is automatically calculated from features within the initiative." — Ron Yang, VP Product & UX
Sketch early-stage product ideas
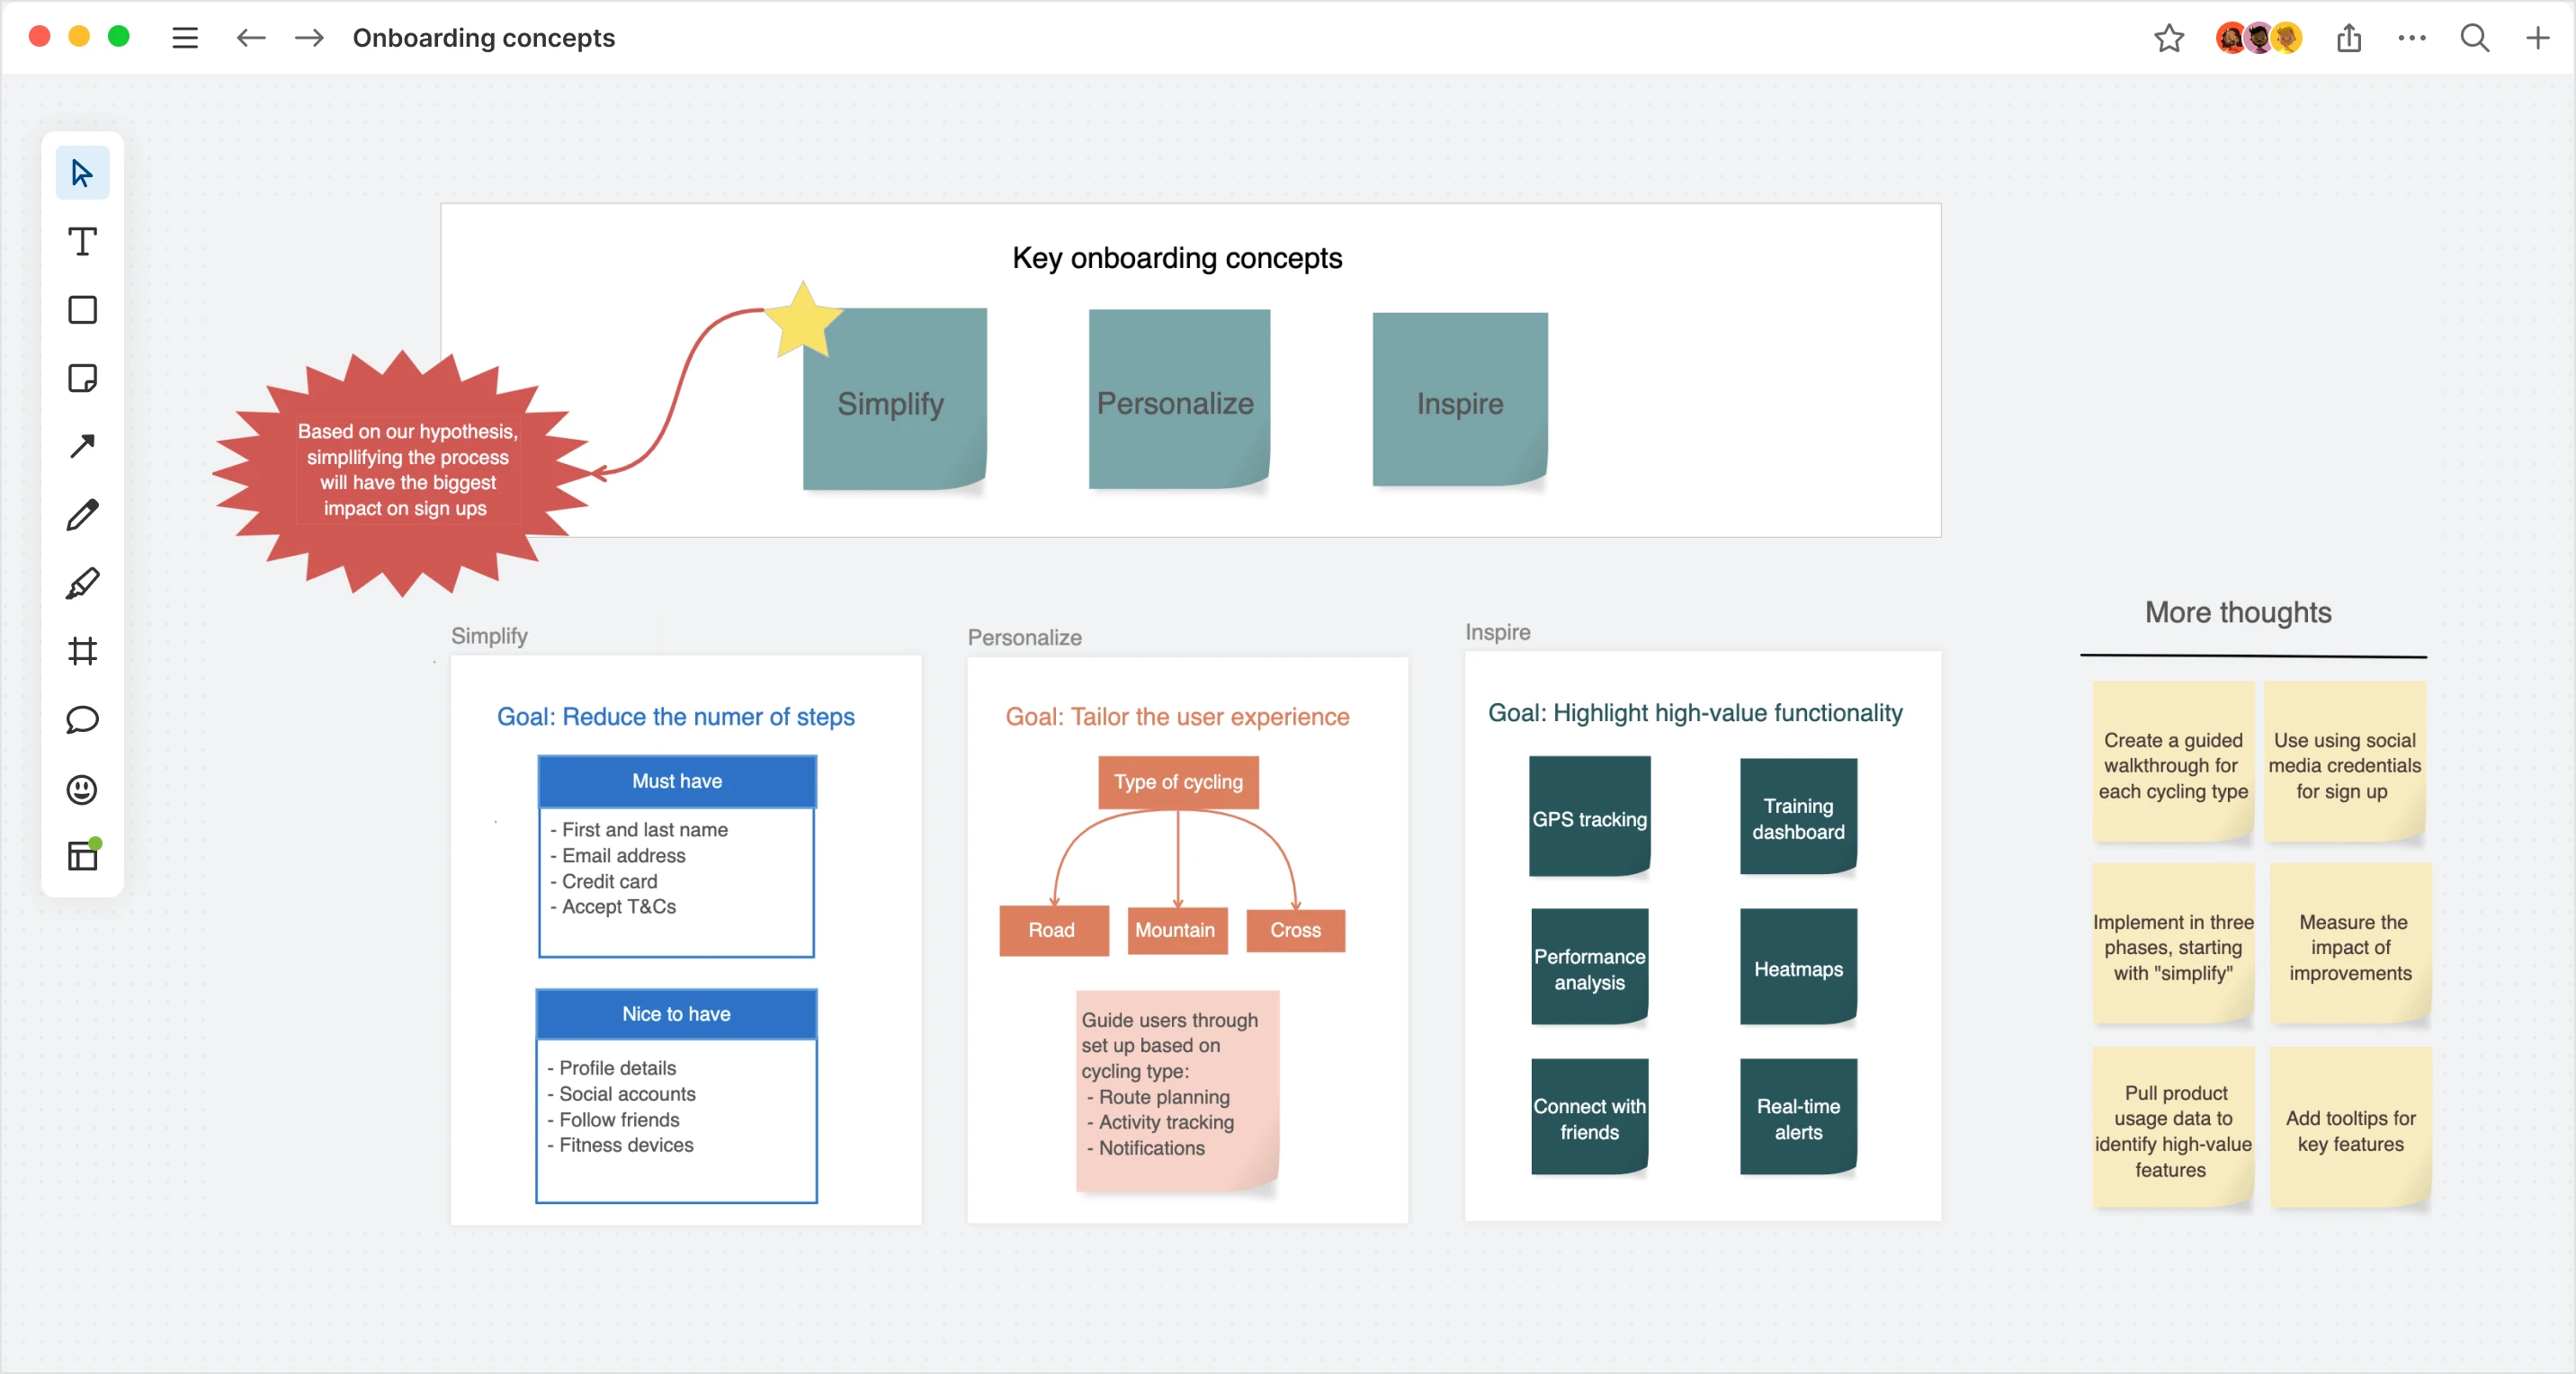
Whiteboards in Aha! software are a new way to visualize and refine your thoughts. You can ideate from a blank canvas or choose from among a growing library of templates that include brainstorming, flowcharts, customer insights, strategy and planning, research, and more.
"As a product marketer, I like using whiteboards to capture ways we can better serve our customers. The team can jump in and see what I have added, then easily layer on their own ideas. And because whiteboards are integrated across Aha! tools, it is easy to transfer details on a whiteboard directly into actionable work items on our roadmap." — Scott White, Product Marketing
Organize around value
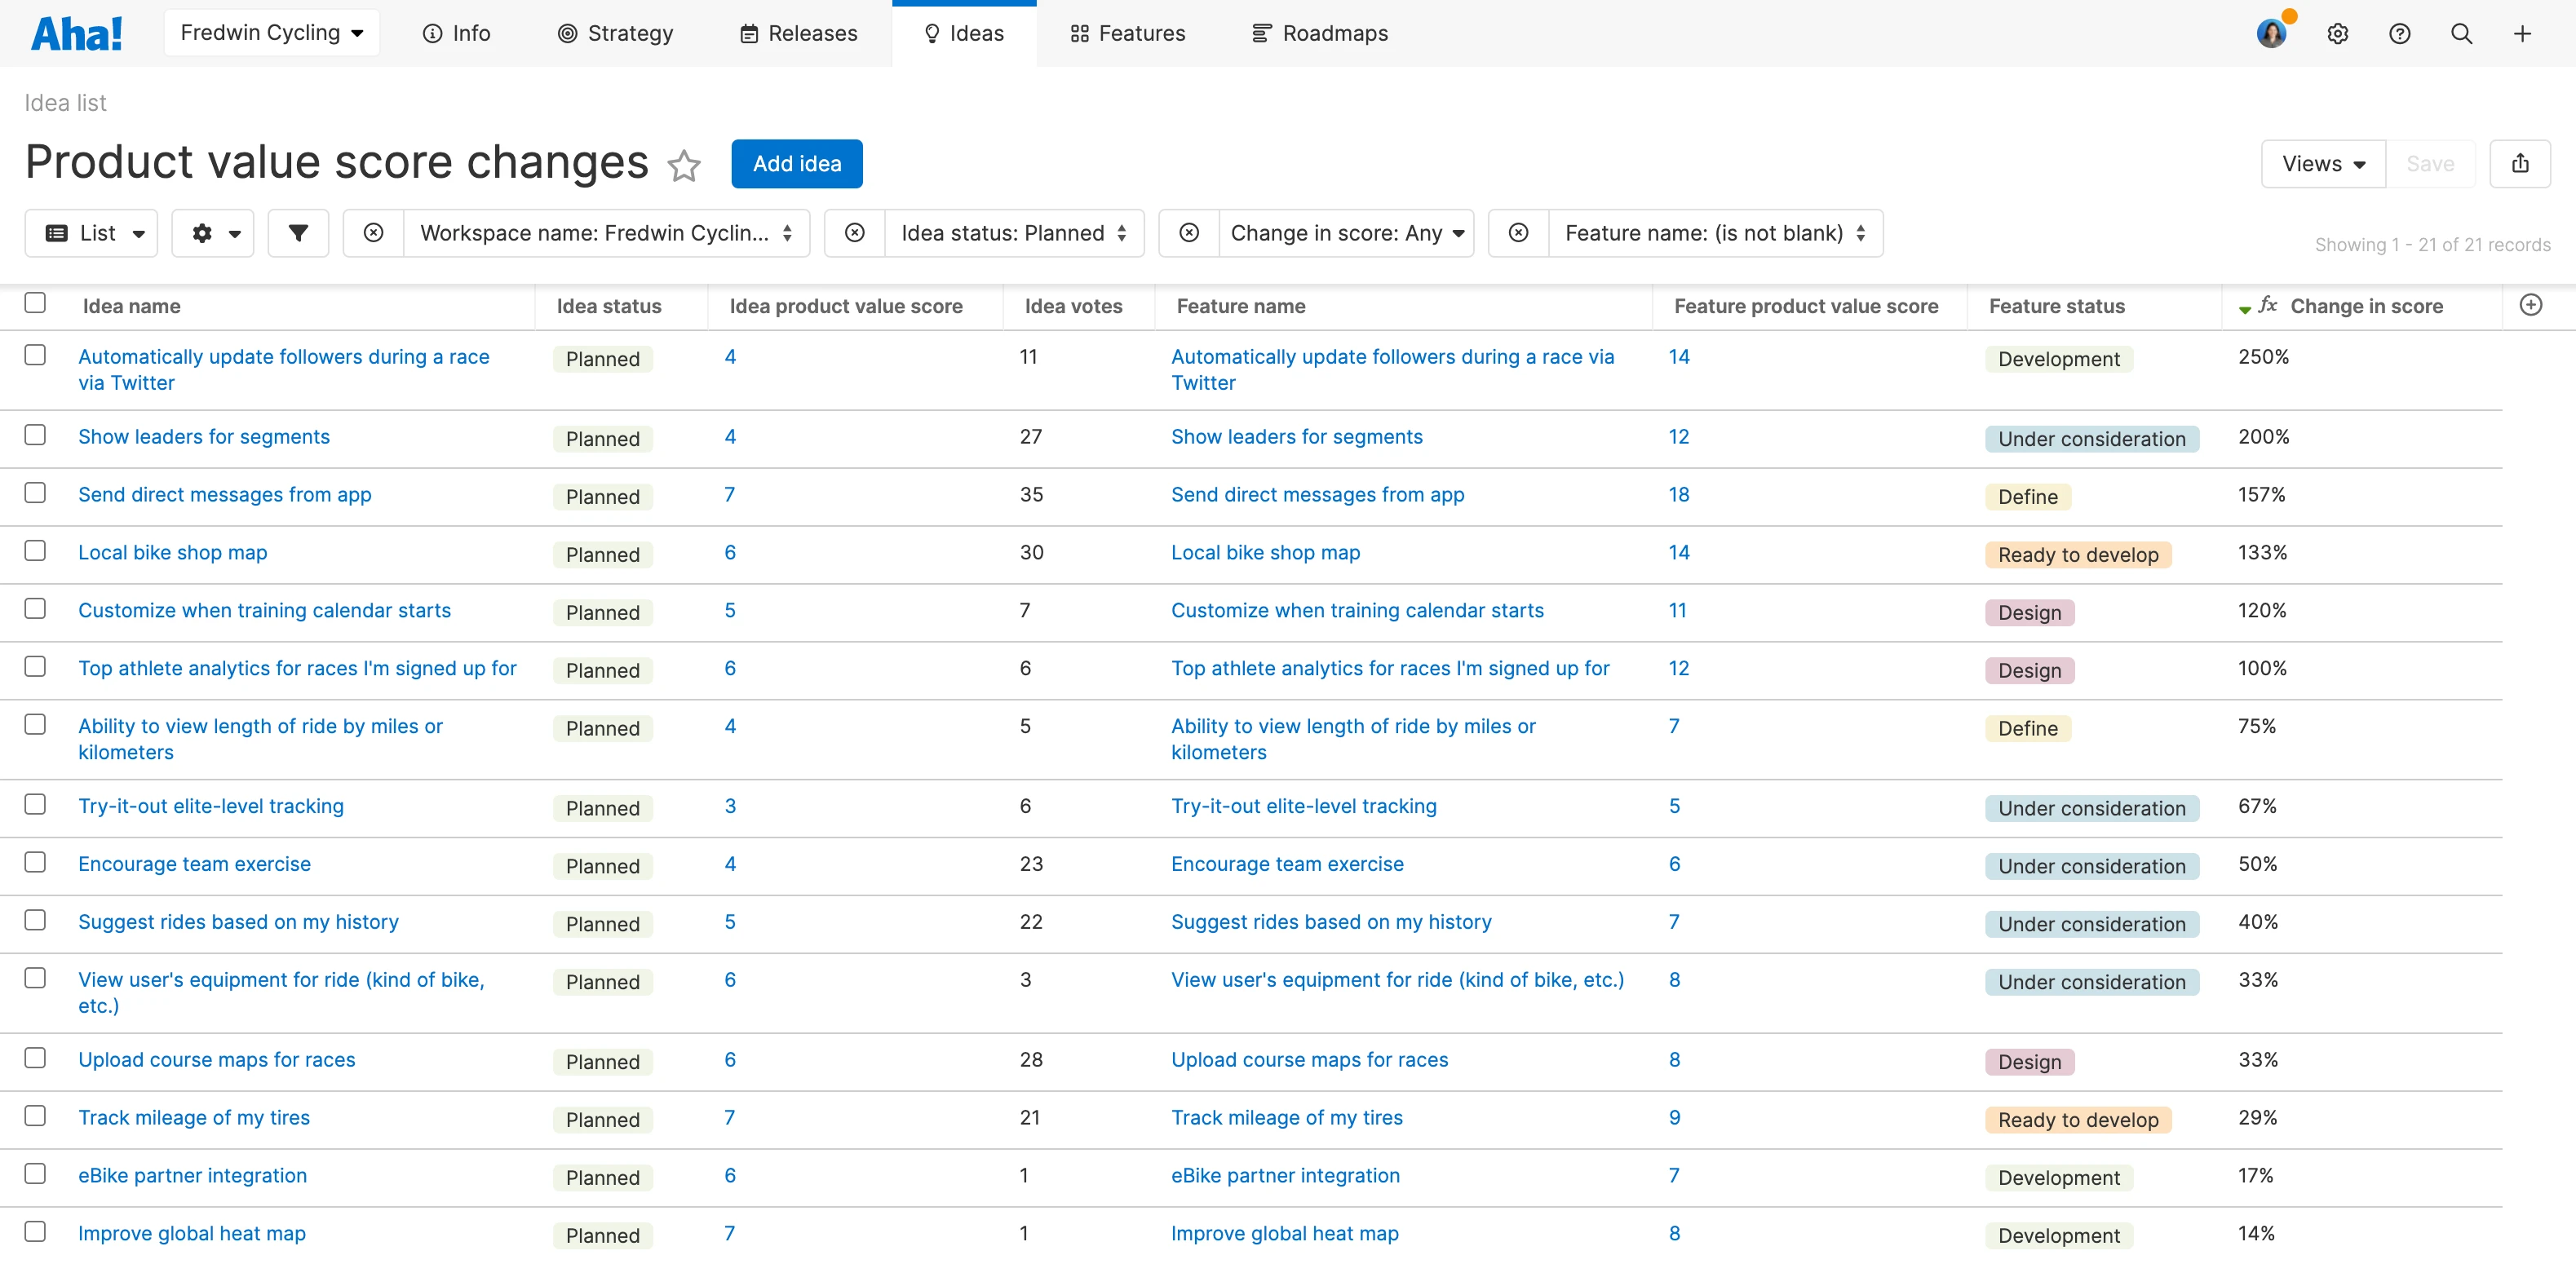
Building what matters most hinges on having a prioritization method in place that fits your product and company. The Aha! product value scorecard gives you a way to consistently measure and rank work based on population, need, strategy, effort, and confidence. You can also create a custom scorecard and define your own metrics.
"Consider comparing product value scores from when you initially estimated value during ideation to what you landed on during feature definition. It is a helpful way to understand why priorities may have shifted and to regroup around the strongest opportunities." — Austin Merritt, Product Management
Discover the art of capacity planning
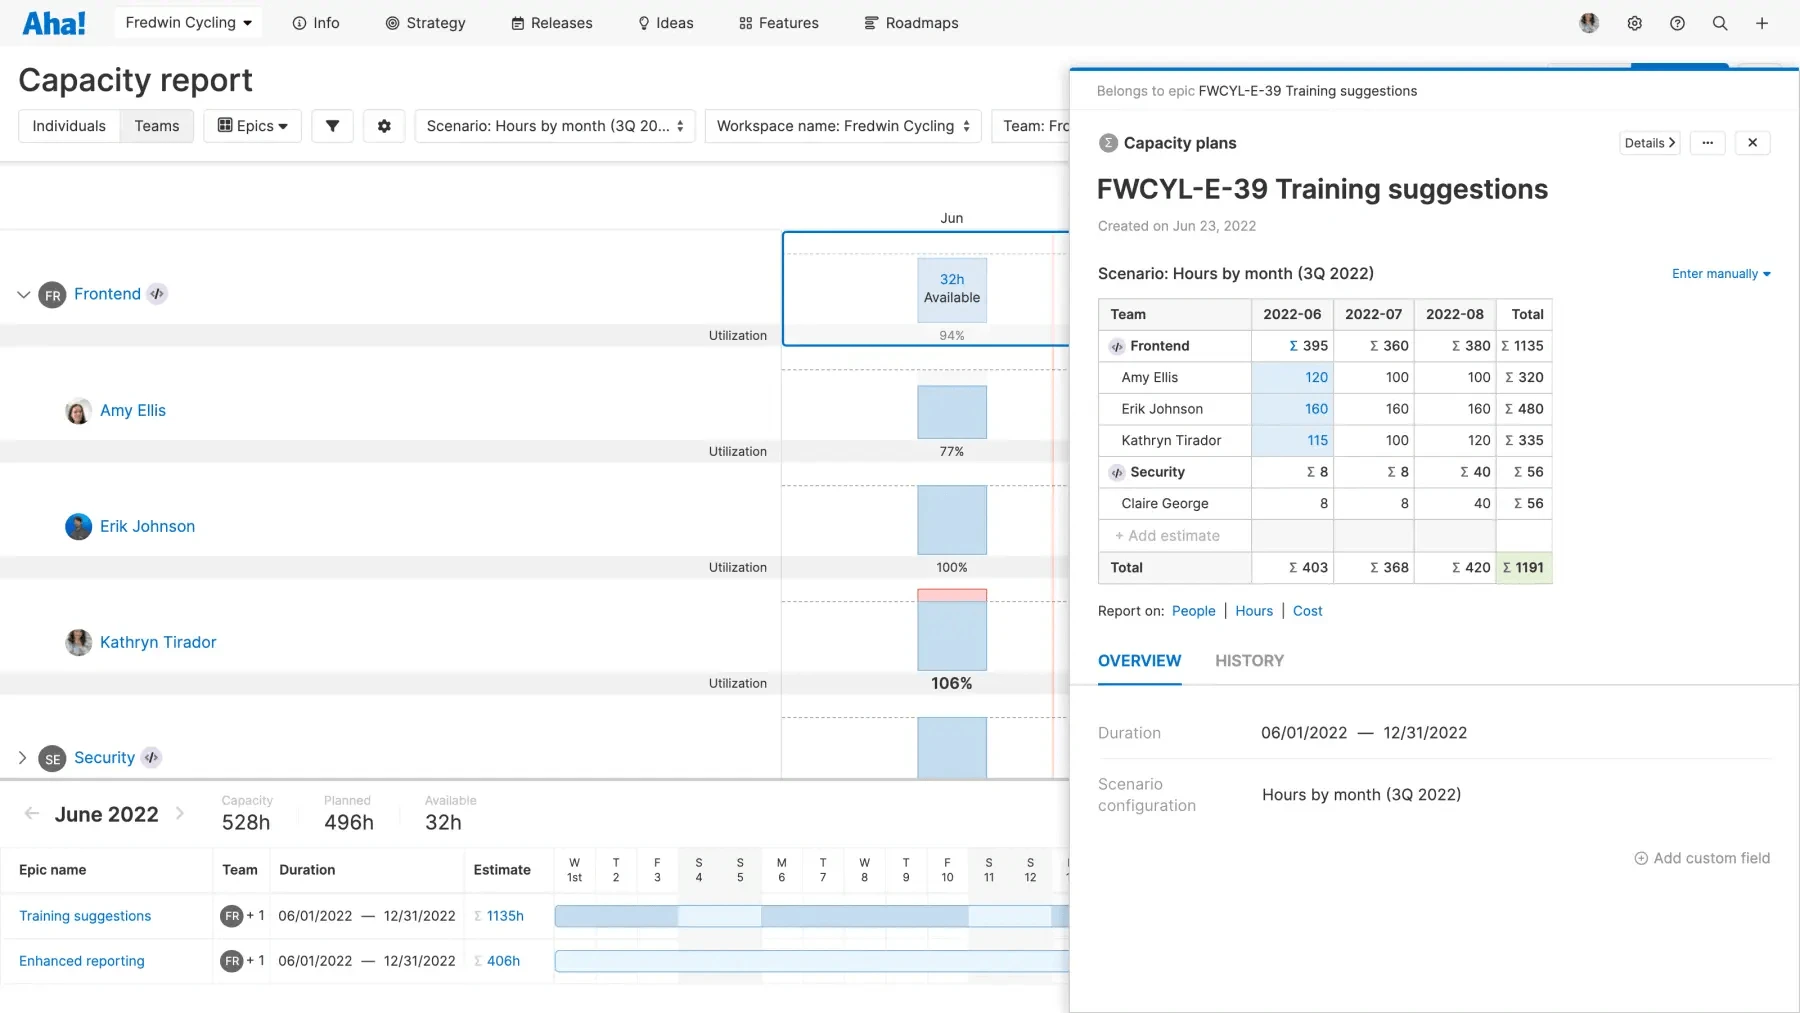
Ambitious plans are only tempered by the team's bandwidth to get work done. Capacity planning is a powerful way to estimate work and set realistic plans based on availability.
"Product managers need to understand if people have enough capacity to complete the work you have planned. The capacity report helps me set team estimates, visualize workload by individual, identify constraints, and then reallocate work as necessary. Doing this work upfront helps everyone feel greater confidence in our ability to achieve our plans." — Nathaniel Collum, Product Management
Dial in developer workflows
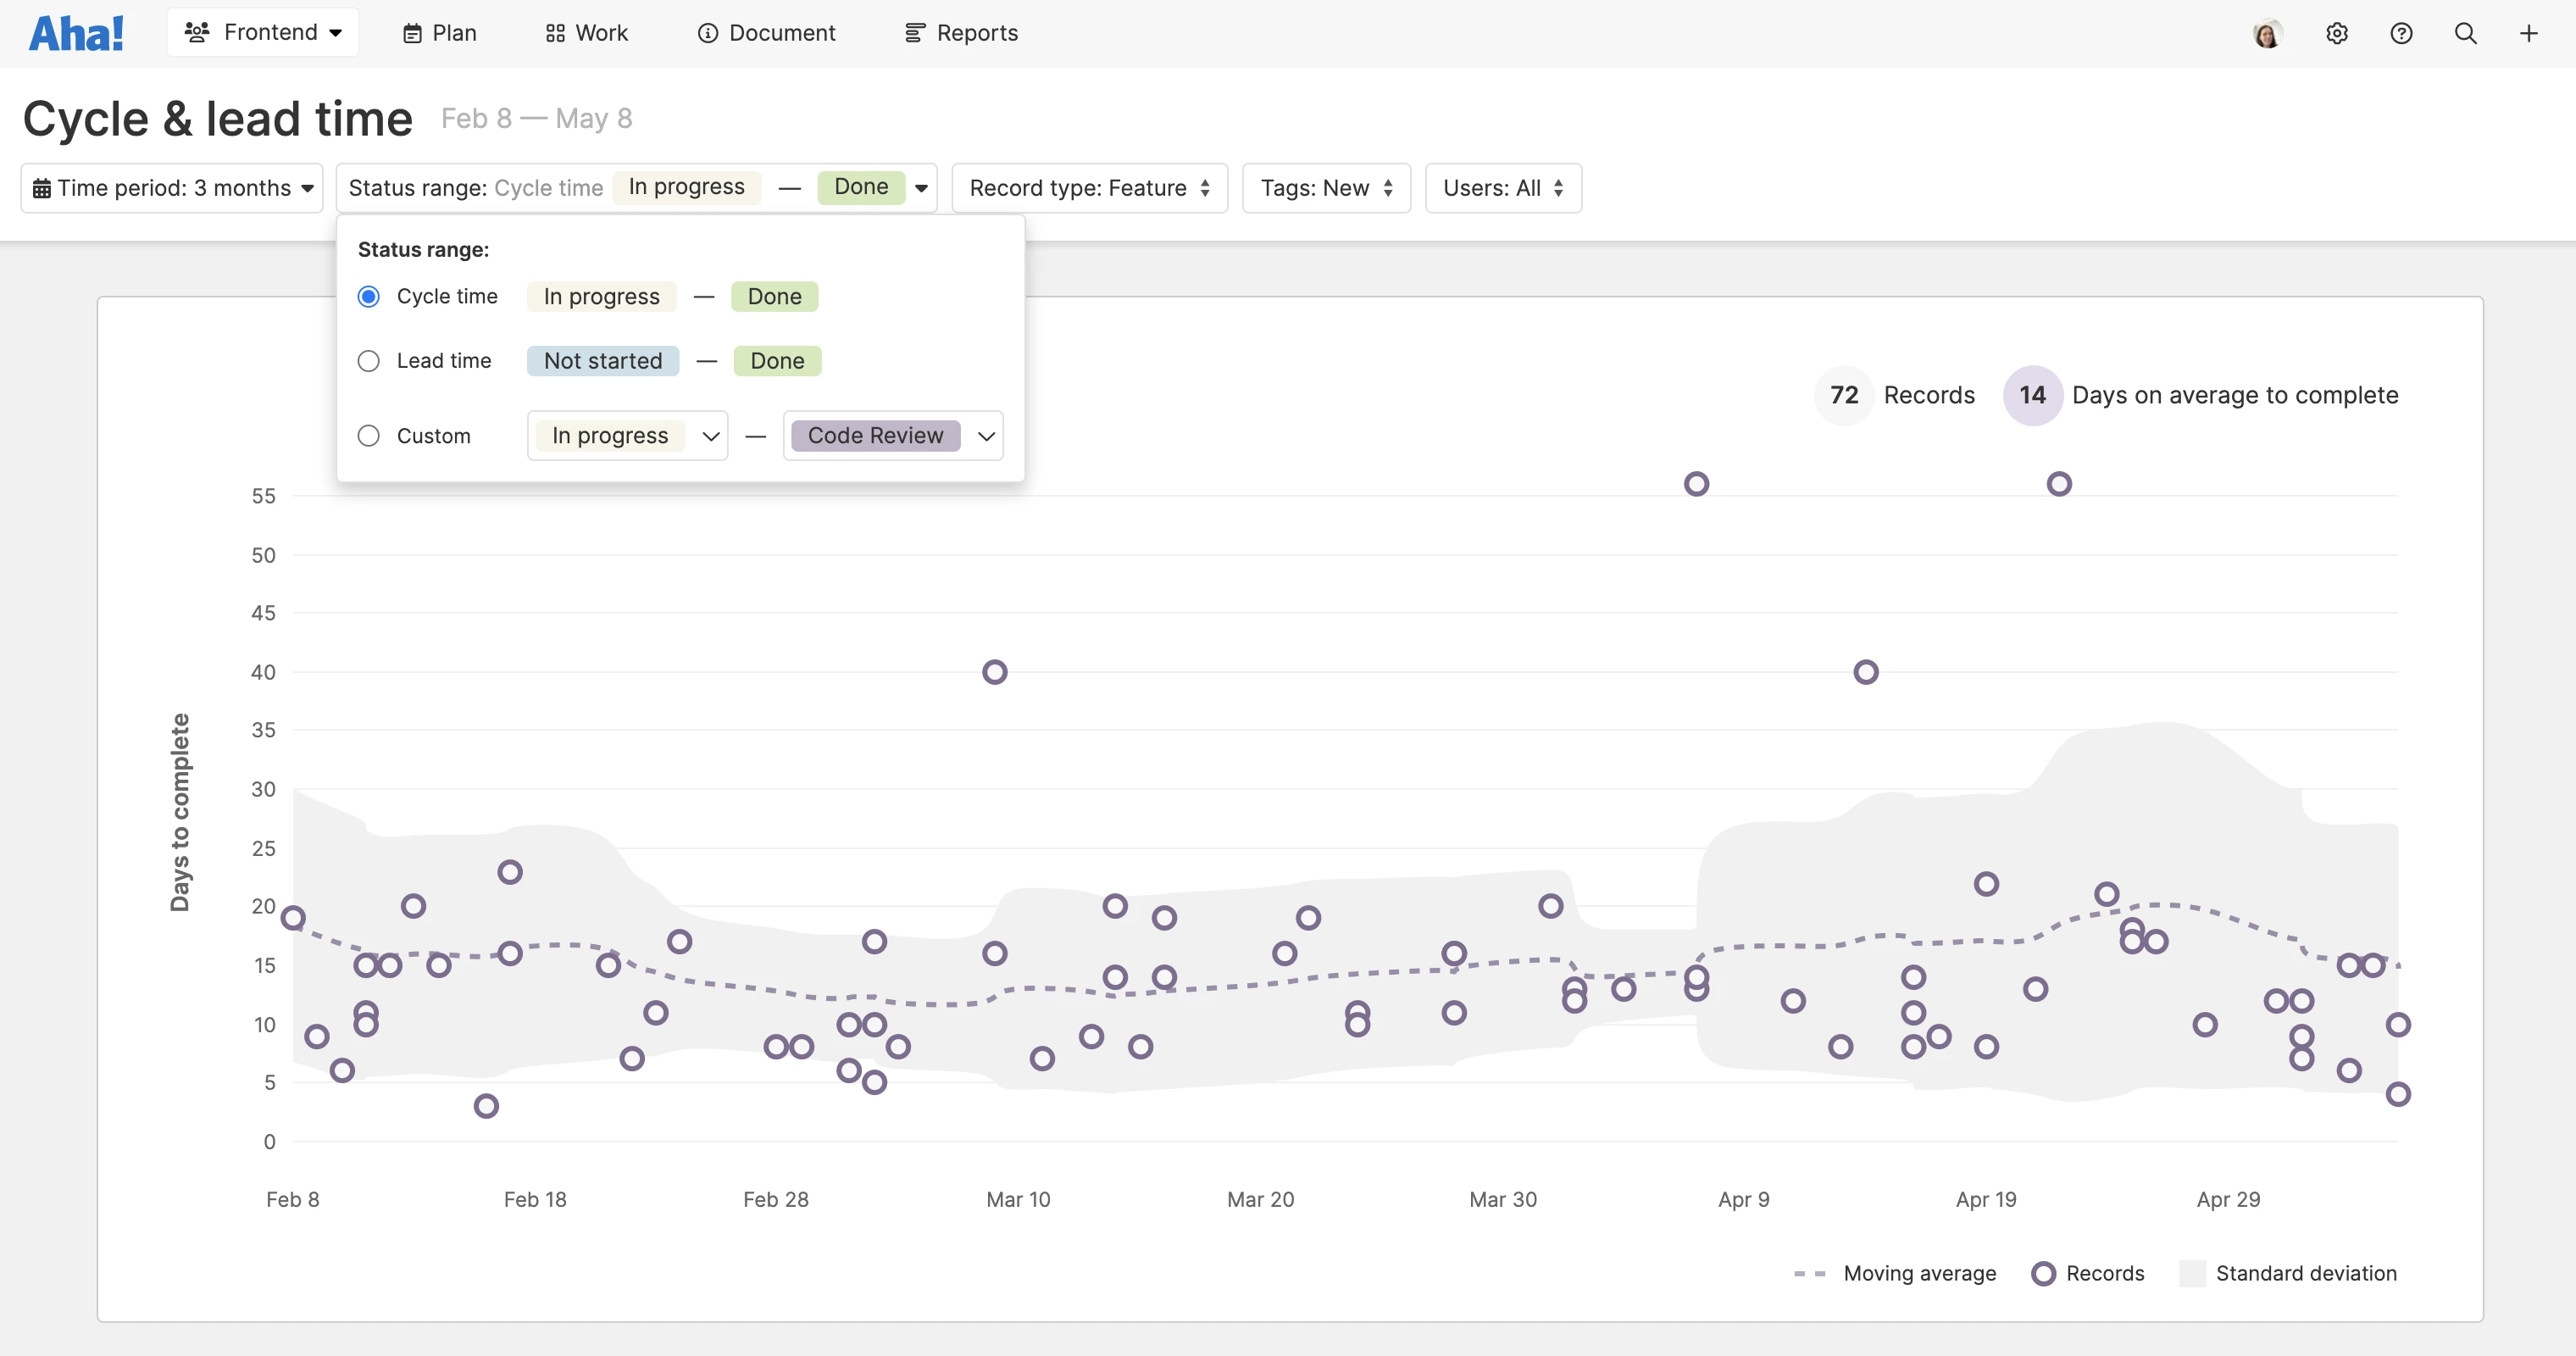
Streamlining development work is an opportunity to improve your product too. The cycle and lead time report in Aha! Develop helps you understand how long it takes developers to deliver work so you can better predict future output and get value to customers faster.
"Be sure to dig deeper into the data — you can filter by record type, tags, workflow stage, and more. It is a great way to analyze how long work spends in each stage of development — from engineering time to code review to QA. Of course, the report works best when you compare work of the same size or type." — Jeff Tucker, Product Management
Power up product marketing with a launch calendar
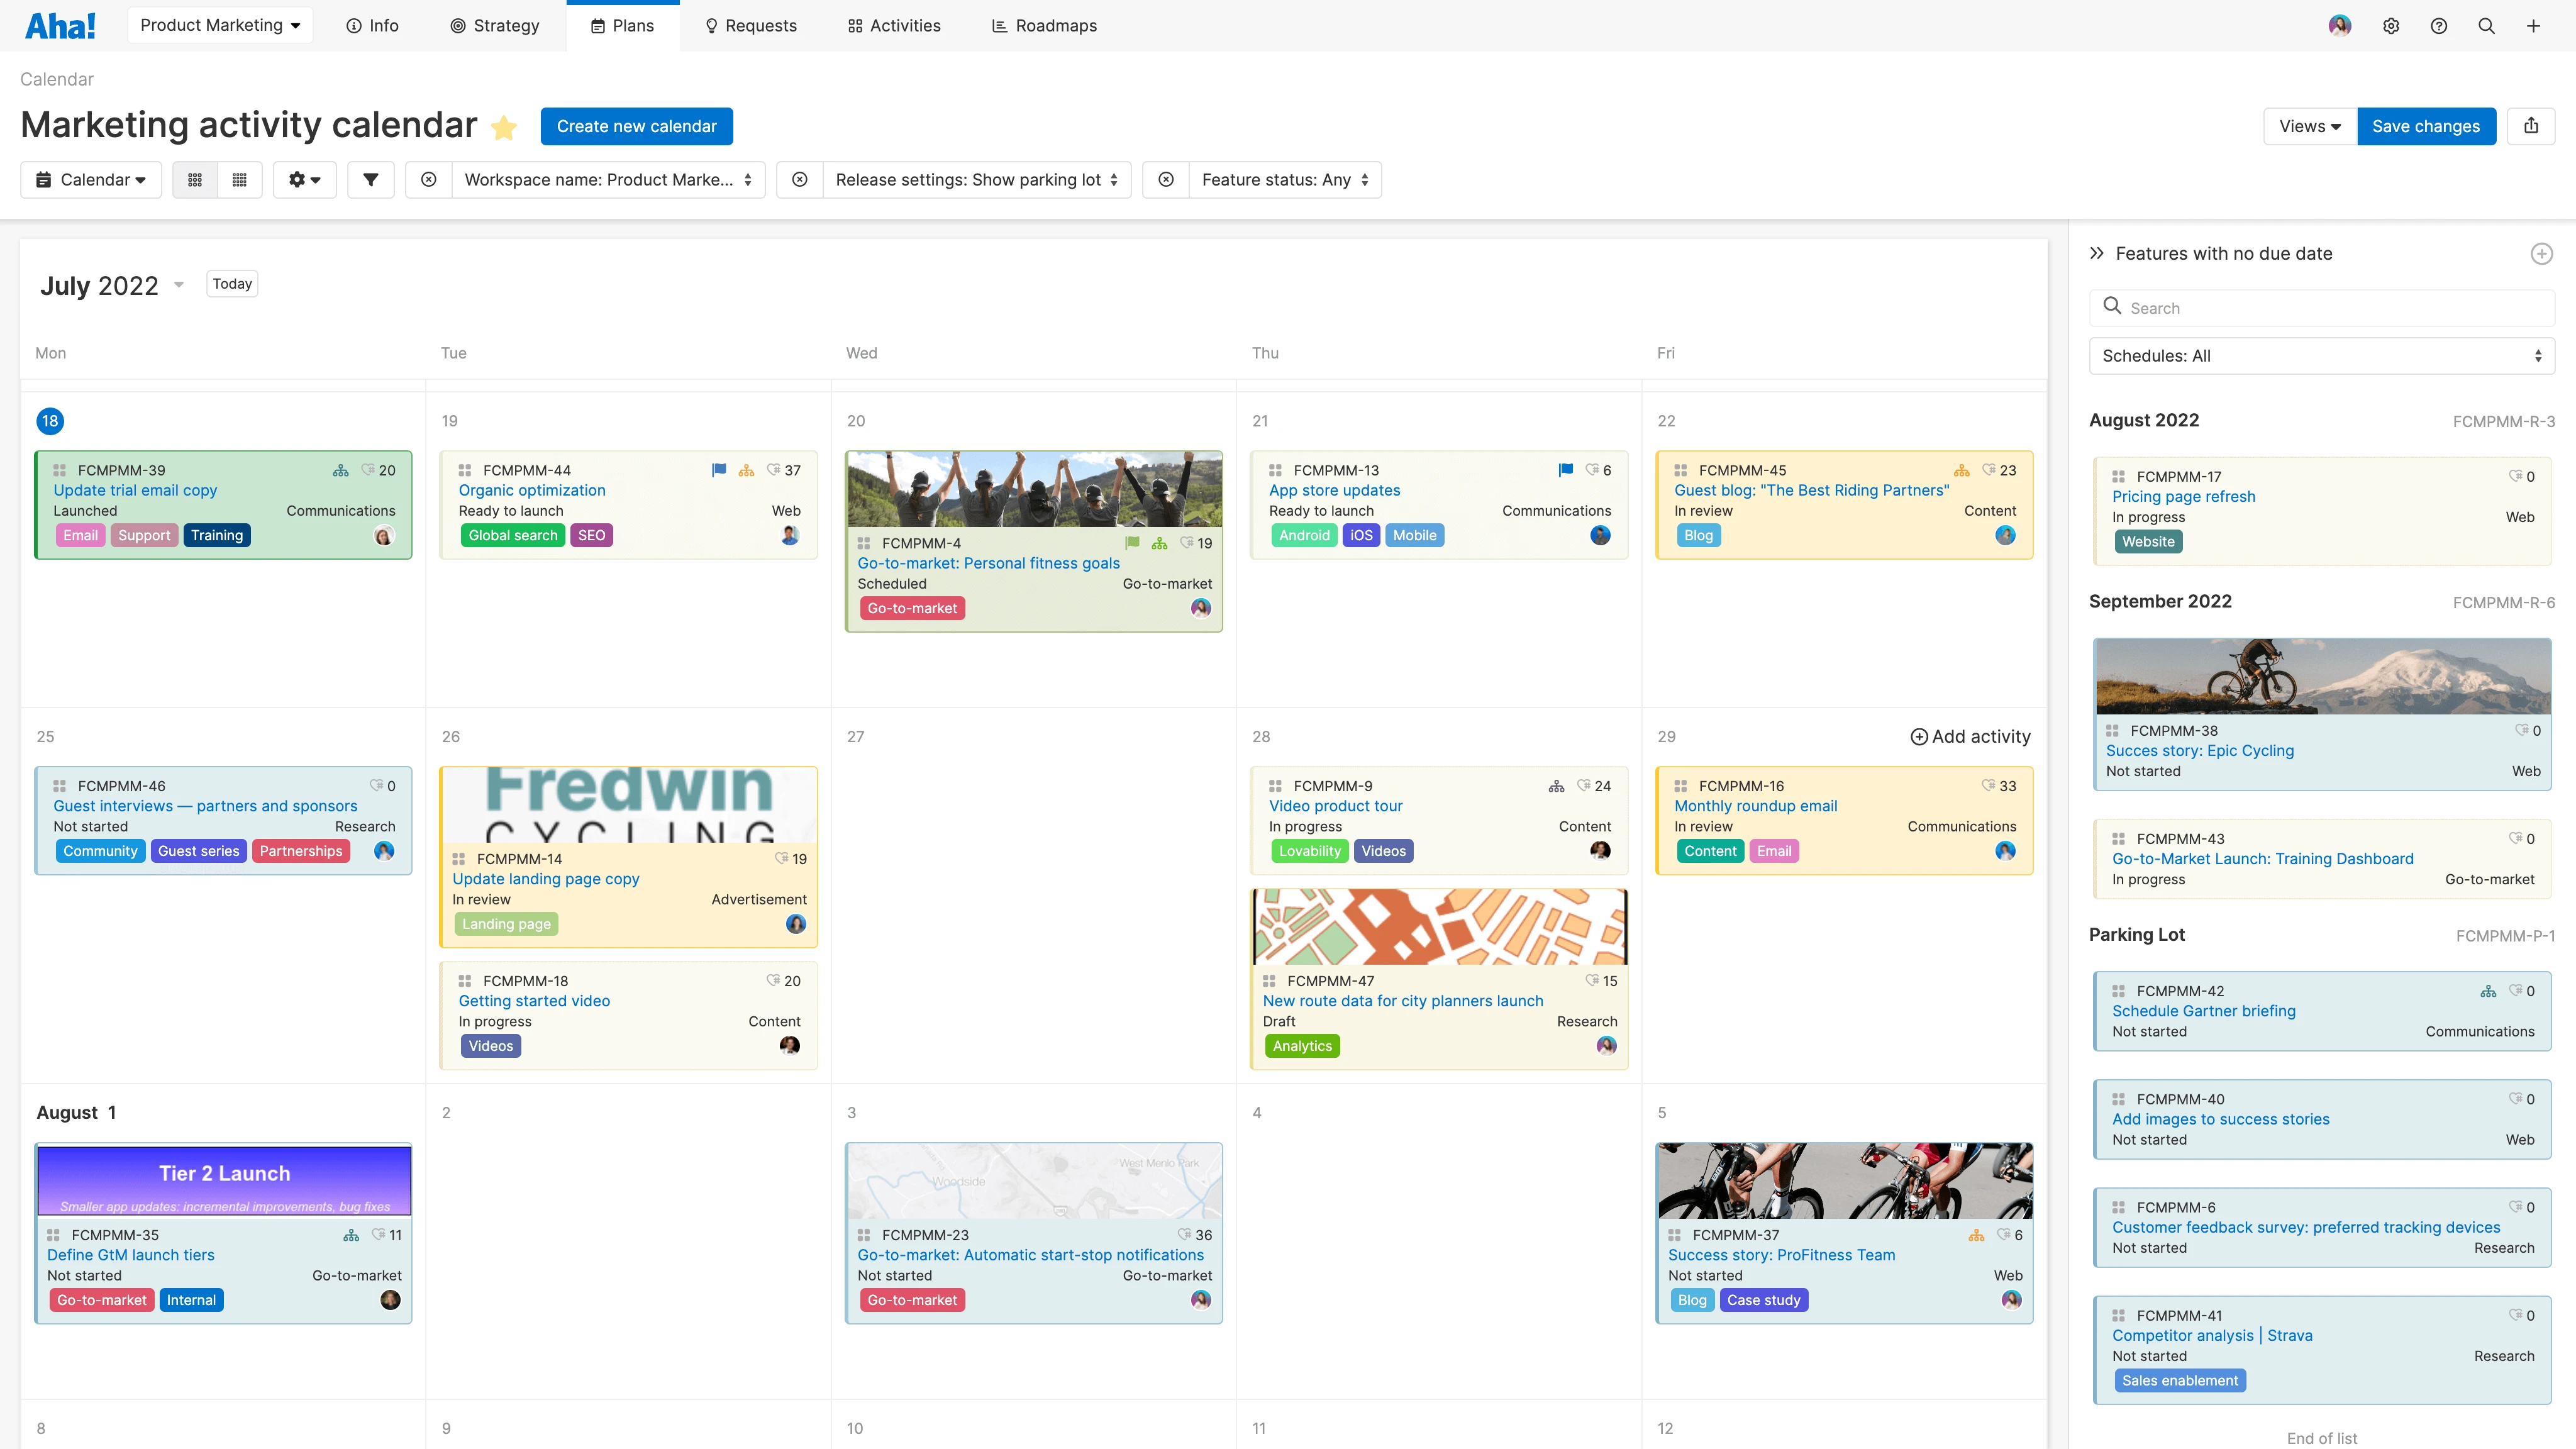
Successful launches are a cross-functional effort — powered by both product and marketing. Use a launch calendar to detail customer-facing activities like blog posts, email campaigns, and website updates.
"Our go-to-market calendar view is invaluable for visualizing upcoming launches across different products. Seeing everything laid out for the week or month ahead helps the team stay focused on meeting deadlines. I also love how we can customize what we see on the activity cards — I know at a glance who is doing what and the status of the work." — Rose Thompson, Product Marketing
Celebrate success with an interactive dashboard
Capture all of your product data in one place and report on the team's progress. Interactive dashboards let you organize reports, roadmaps, and KPIs in a single view — ideal for sharing in meetings and with the leadership team.
"Dashboards give me complete control over how I organize and share the team's progress. I like to display high-level summaries alongside more detailed views. For example, I might include one panel that shows progress towards goals and key initiatives and another that zeroes in on feature work over the next 60 days. I also like to add product KPIs and sentiment analysis from recently launched features — so I can understand the realized product value of what has shipped." — Julie Price, Product Management
Share these visuals with your teammates and elevate the conversations you are having about strategic plans and performance. It is a win/win for you and your customers.
These are just a snapshot of the different ways you can visualize your progress in Aha! — let us know which ones resonate with you. We love hearing the innovative ways our customers use Aha! to power every stage of product development.
Use Aha! and be happy. See for yourself — start a free 30-day trial.