Analytics dashboard wireframe template
Create a wireframe for a data, reporting, or performance dashboard
Use template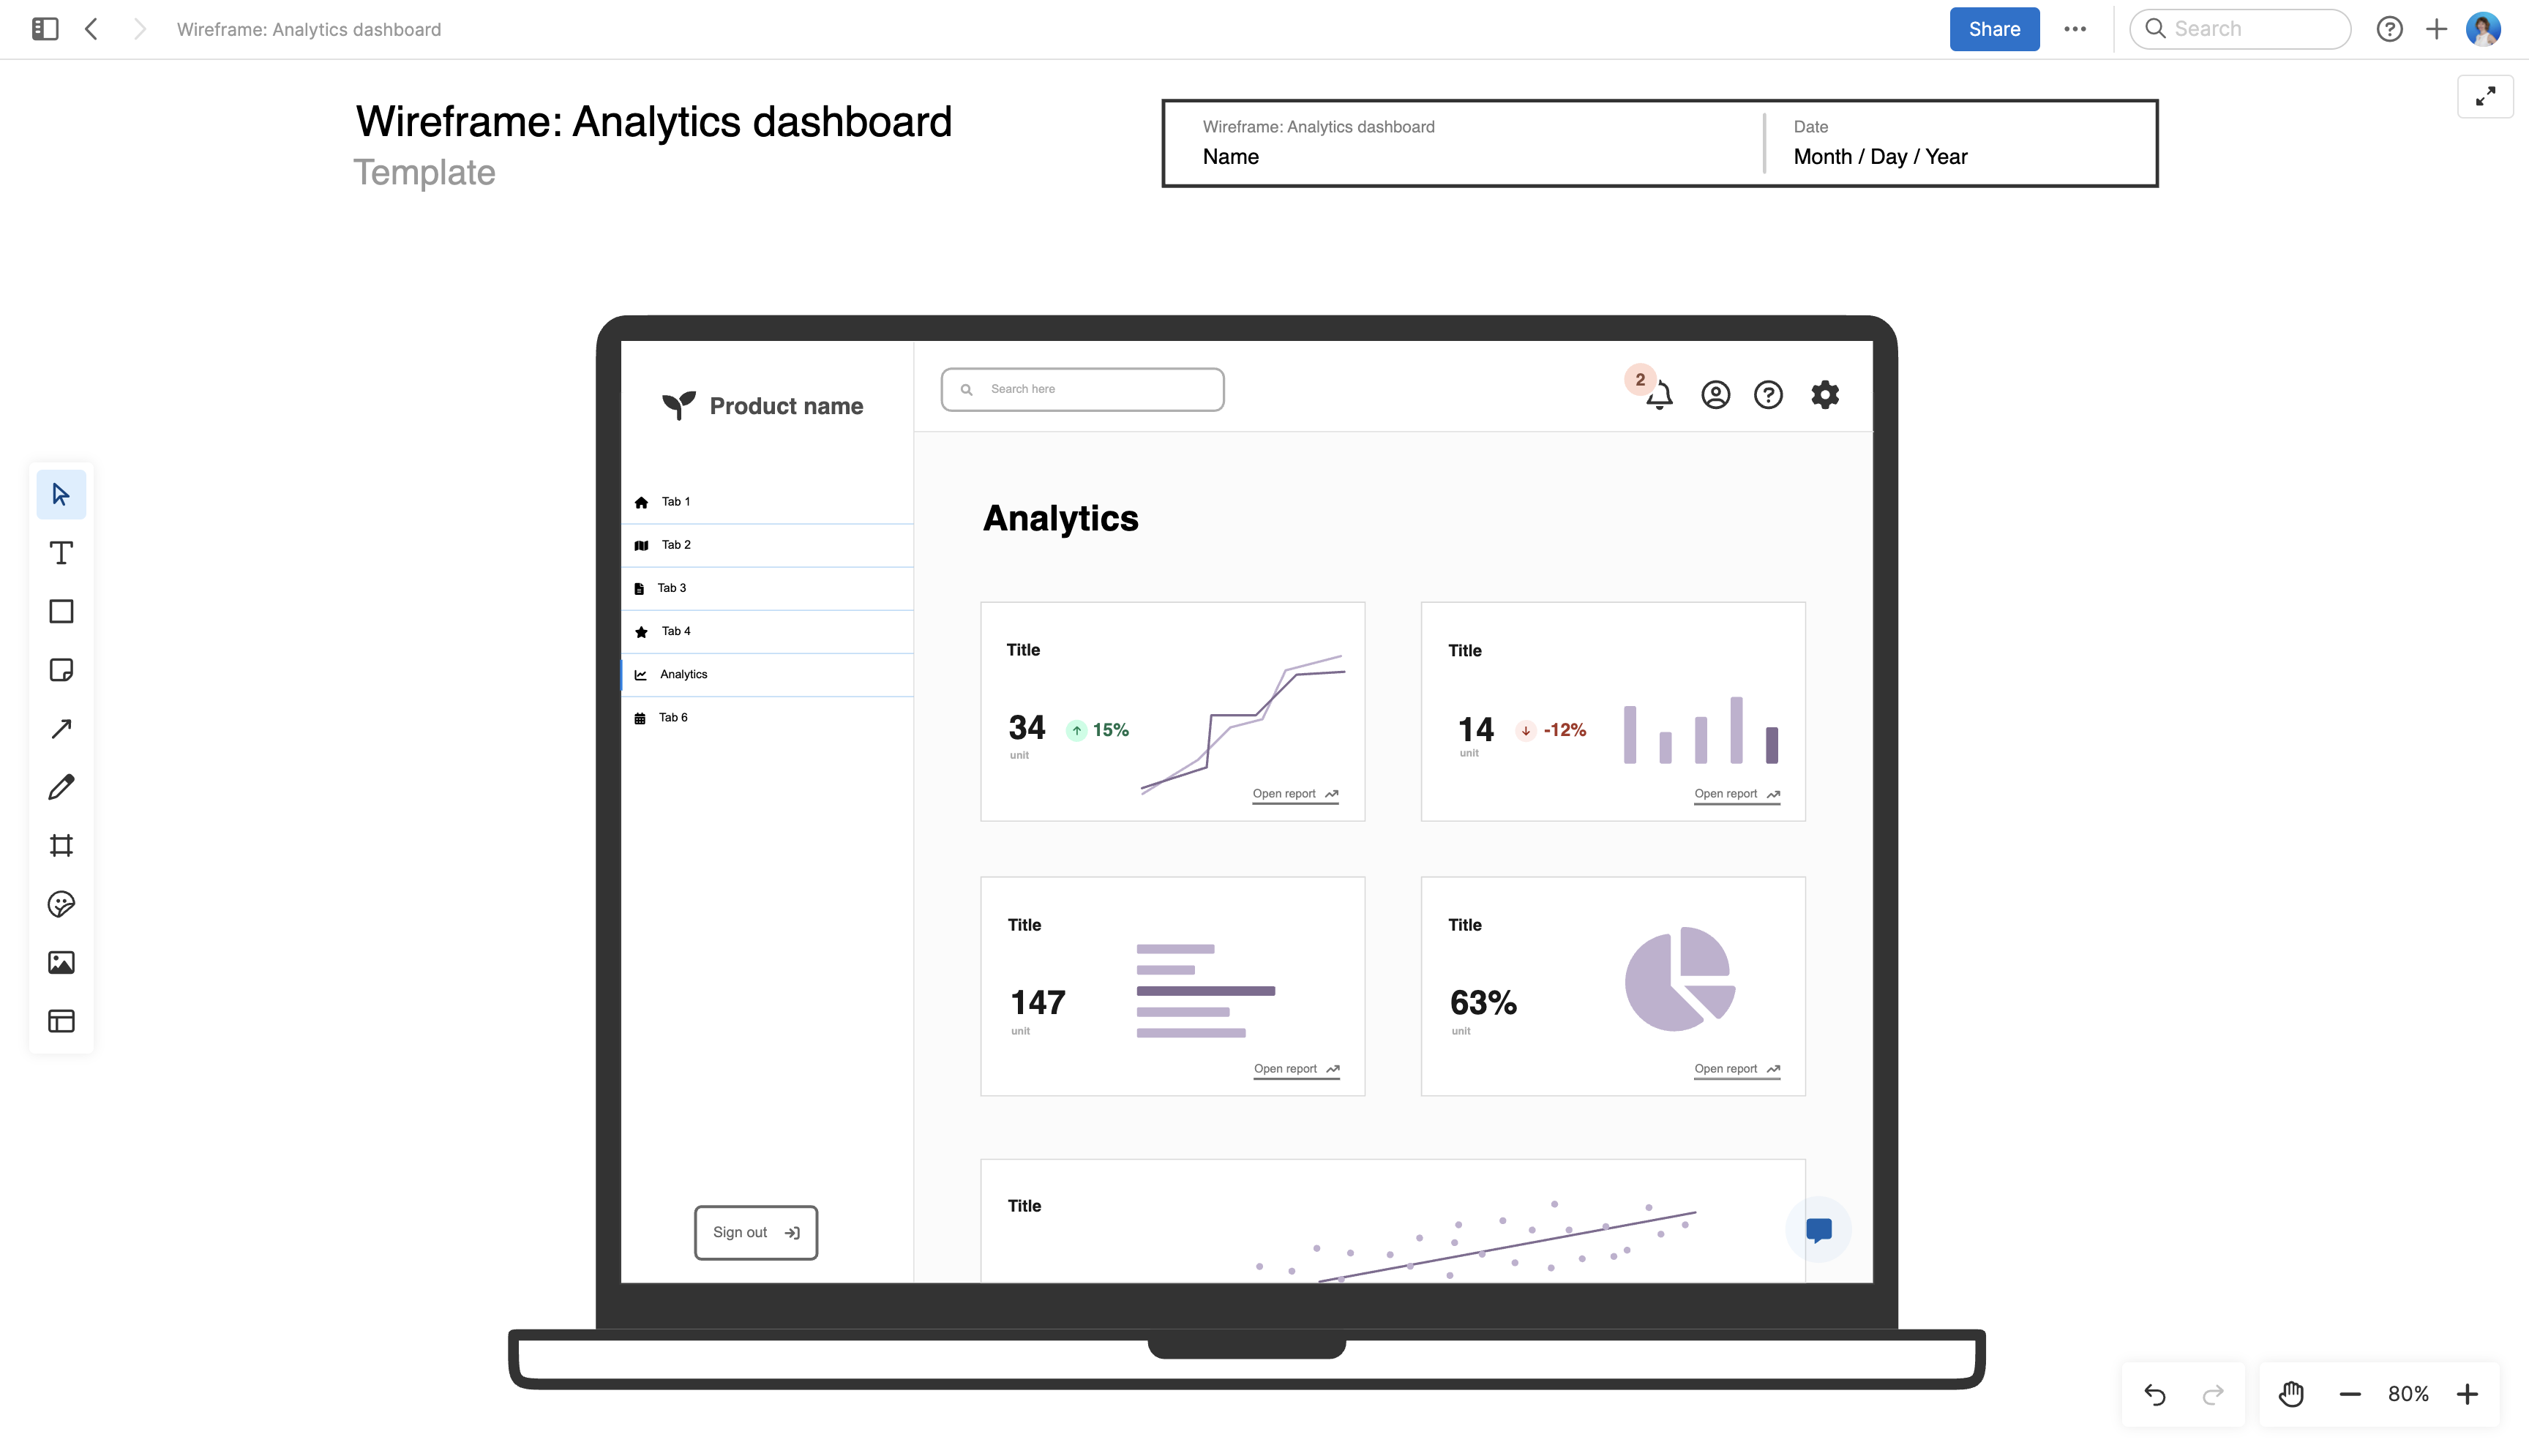
About the analytics dashboard wireframe template
Data dashboards provide valuable context for making more informed product-related decisions. If your product contains an analytics section or data dashboard, use this analytics dashboard wireframe template to explore layout and functionality options with stakeholders from product, UX, and development. This allows the team to design an insightful dashboard — presenting data that customers can easily understand and interact with.
Included in the analytics dashboard wireframe template
This analytics dashboard wireframe template includes built-in capabilities such as:
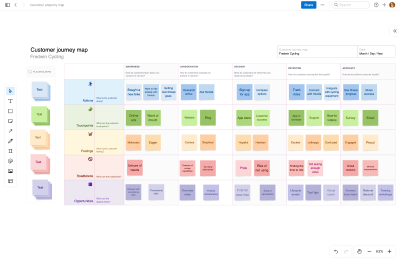
A menu of classic whiteboard features (including sticky notes, grids, and emojis)
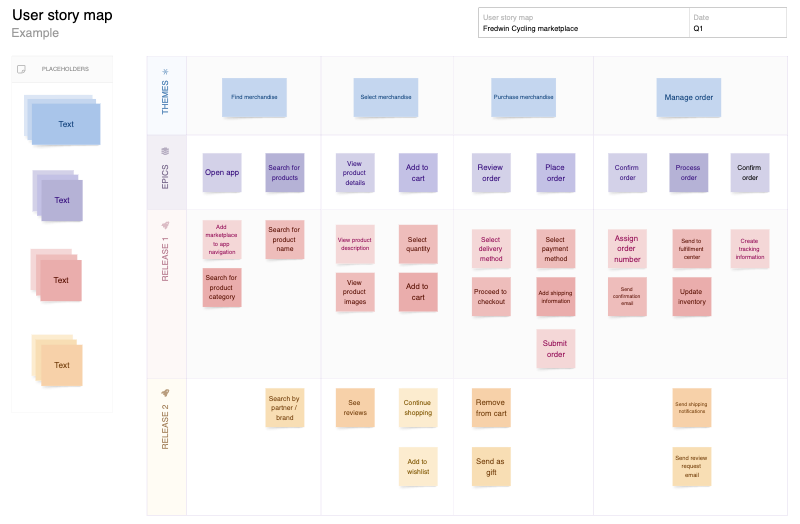
Quick access to best practices and a pre-filled analytics dashboard wireframe example for guidance
Inline comments to gather feedback, questions, and ideas from teammates
A voting tool to gather confidence votes from collaborators
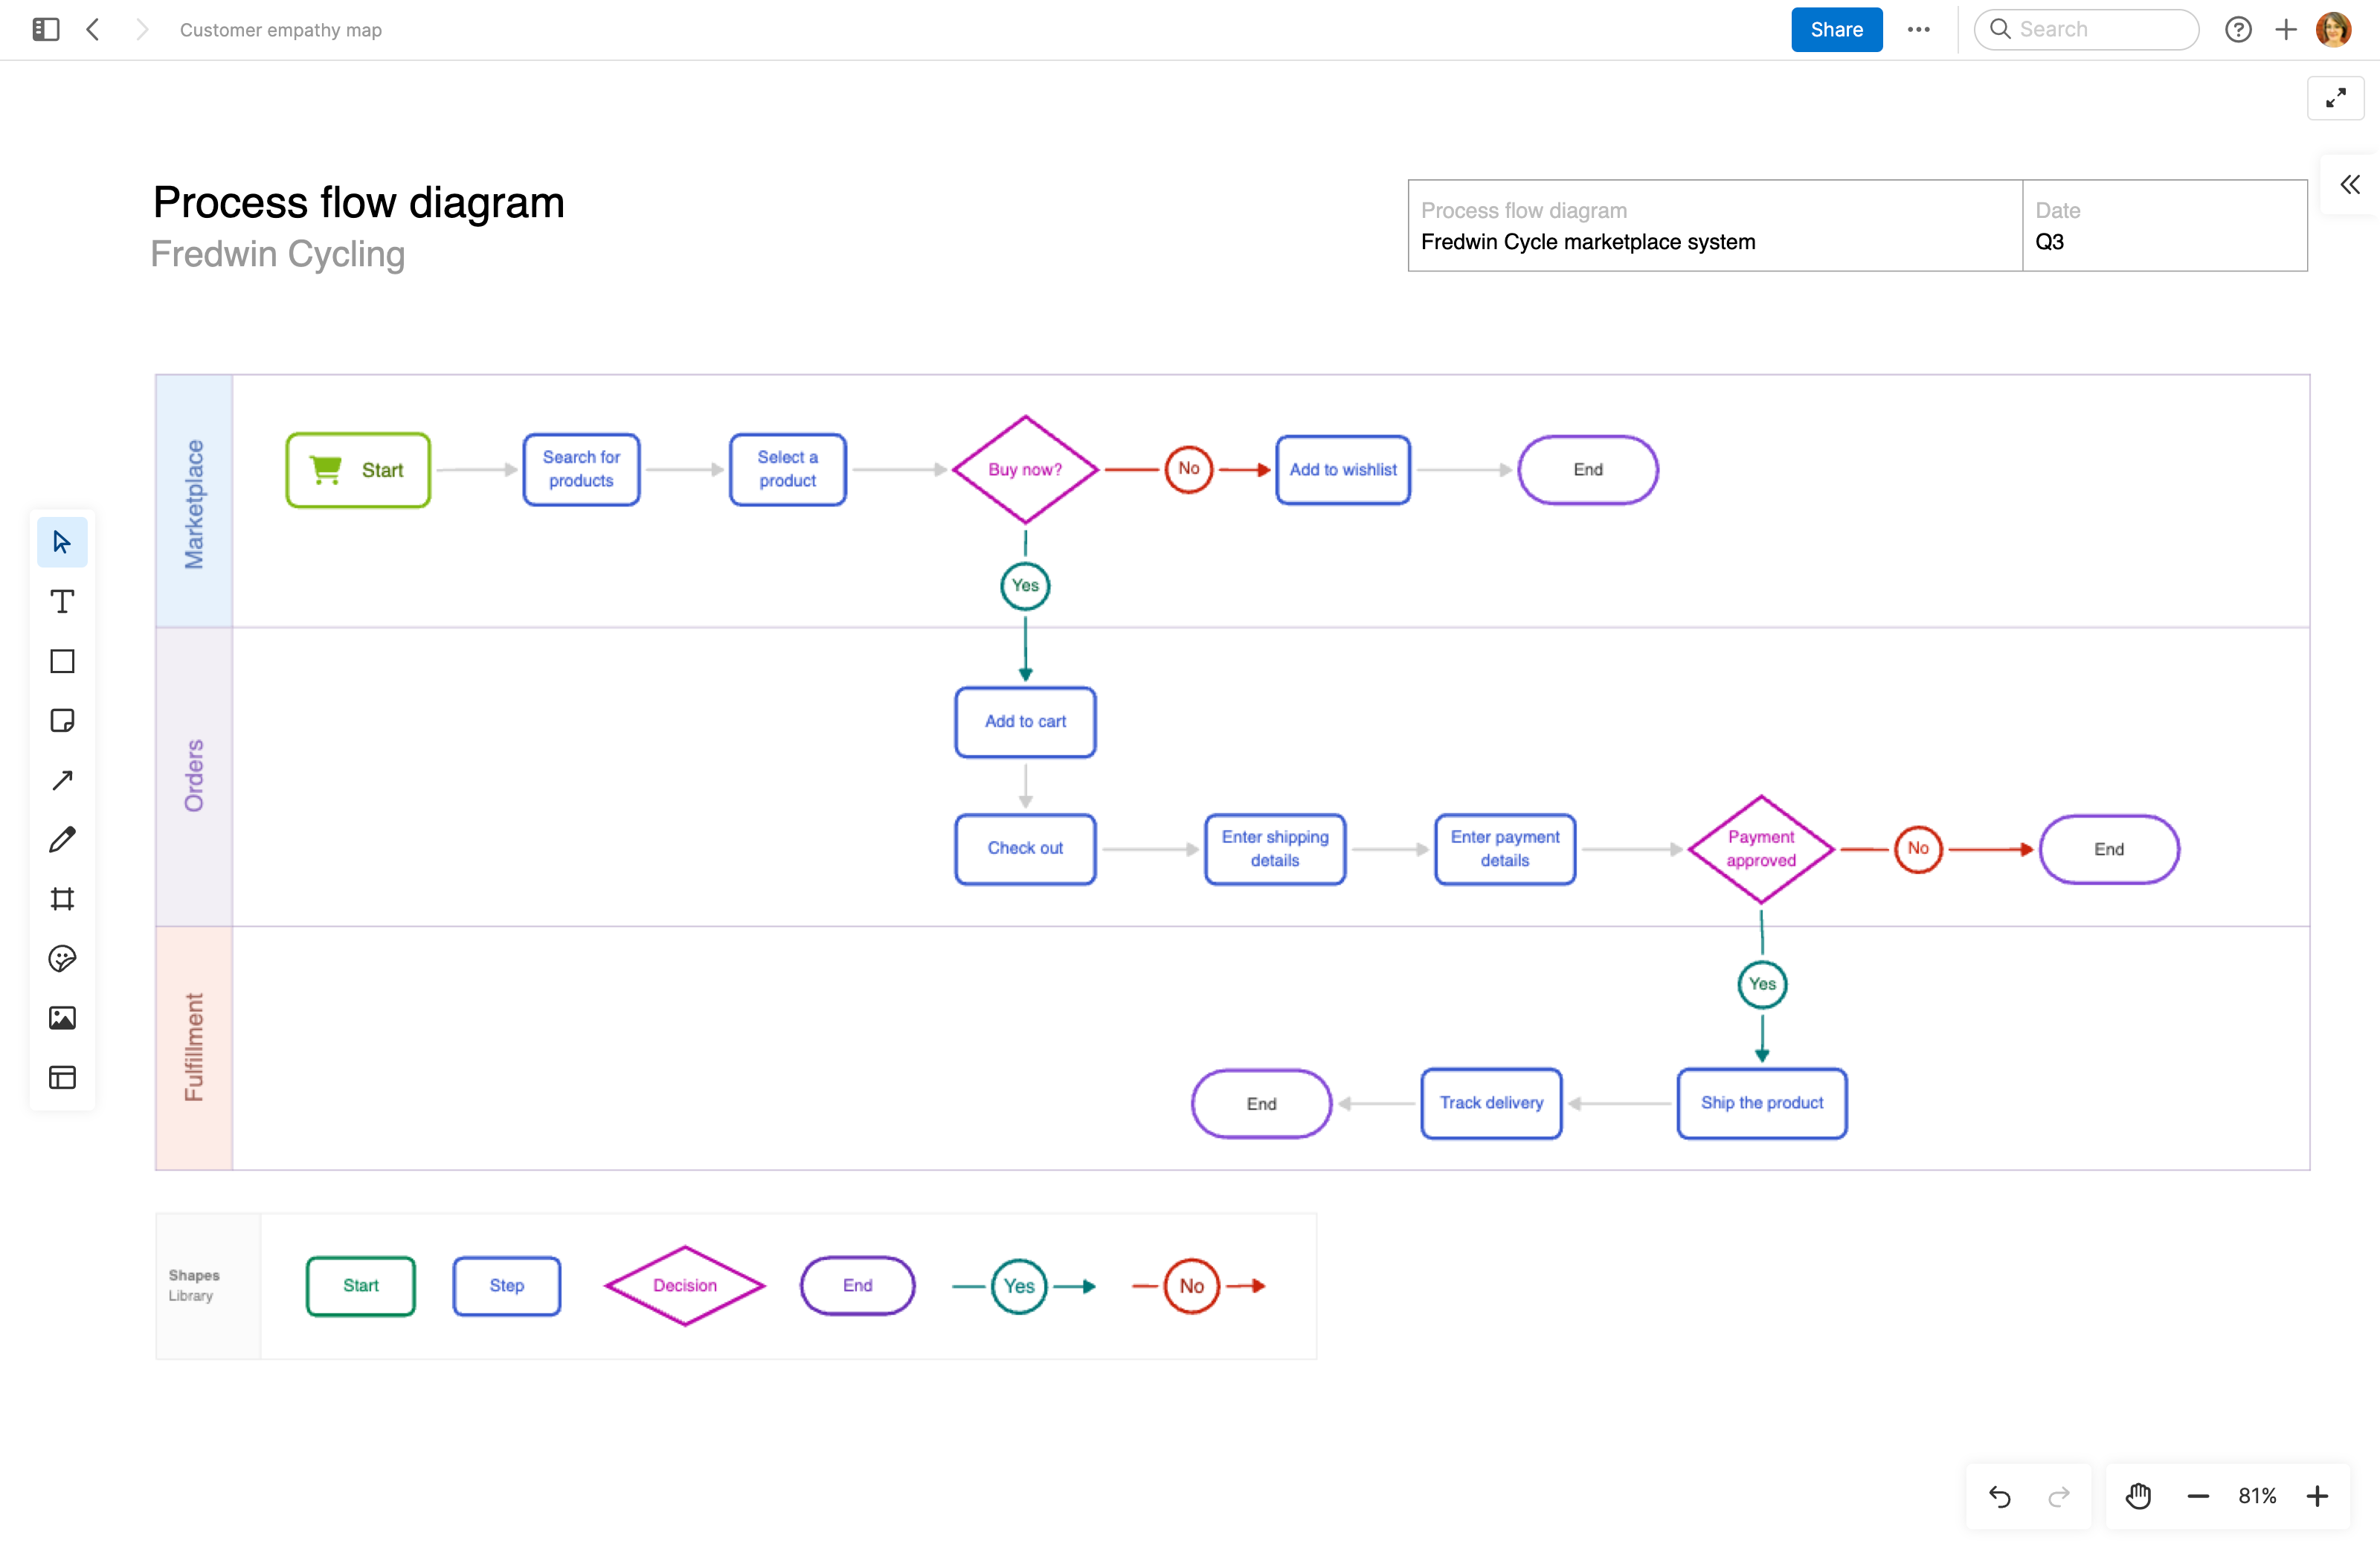
Shapes that enable you to convert whiteboard items directly into Aha! records
Presentation frames to easily share your work
How to use the analytics dashboard wireframe template
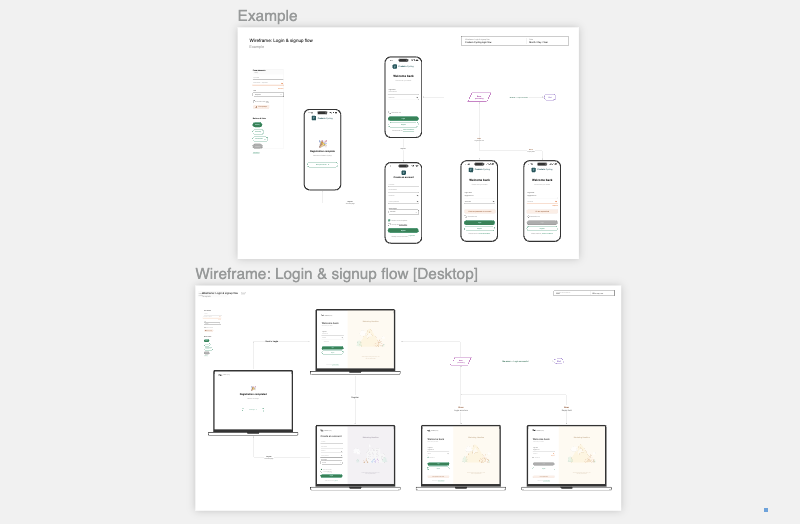
Wireframing on a whiteboard can help product teams explore different options and zero in on a user-friendly design. Try this template to spark discussions with teammates about how to best present data on your product's analytics dashboard.
Experiment with different layouts and functionality to discover the right approach. Think deeply about the pros and cons of possible user flows. Iterate based on stakeholder and user feedback, refining details as your wireframe evolves. When you are ready to release your dashboard, you can feel confident you are presenting the information in the most logical and intuitive way.
Best practices
Sketch out how to display the key metrics and insights your users need to see.
Identify metrics: Understand the goals of the users who will interact with your analytics dashboard. What information do they need to see? Find the best way to display data that is most relevant to their decision-making process.
Design your layout: Choose the screen you are designing for: desktop, phone, tablet, or browser. Arrange charts and graphs in different ways to find a layout that empowers users to easily understand and interact with their data.
Add details: Consider including other elements on your dashboard, such as dropdown menus, filters, and buttons. Adjust the style and color to match your product.
Gather feedback: Invite stakeholders and potential users to participate in the wireframing process. This helps you explore different options and ensure the dashboard meets customer needs before implementation gets underway.
FAQs about the analytics dashboard wireframe template
Why is the analytics dashboard wireframe important?
Product managers can use analytics dashboard wireframes to explore how best to display key metrics. Using a whiteboard template allows everyone to collaborate on designs — figuring out how to make product data easy for users to access and understand. With early-stage concepts sketched out, the team can confidently move the dashboard into development.
What are some analytics dashboard wireframe best practices?
Prioritize the most relevant metrics as you build your wireframe. Group related information in ways that enhance readability and tell a compelling story. Keep user needs in mind and test the wireframe to ensure navigation is intuitive. Make sure the flow you designed supports data-driven decision-making.
Who is the analytics dashboard wireframe template for?
Although this template is designed for product managers, it also has great value for UX designers and developers. All types of product teams can use the analytics dashboard wireframe template to lay out user flows and experiment with different visual approaches — collaborating to create the best dashboard experience for customers.
Is this template free to use?
Yes. To use this analytics dashboard wireframe template, sign up for a free 30-day trial of Aha! Whiteboards. (You can also try this template in Aha! Roadmaps if you need a complete product management solution.) Easily customize the template to suit your needs, then share it with as many people as you want (for free) to streamline collaboration.