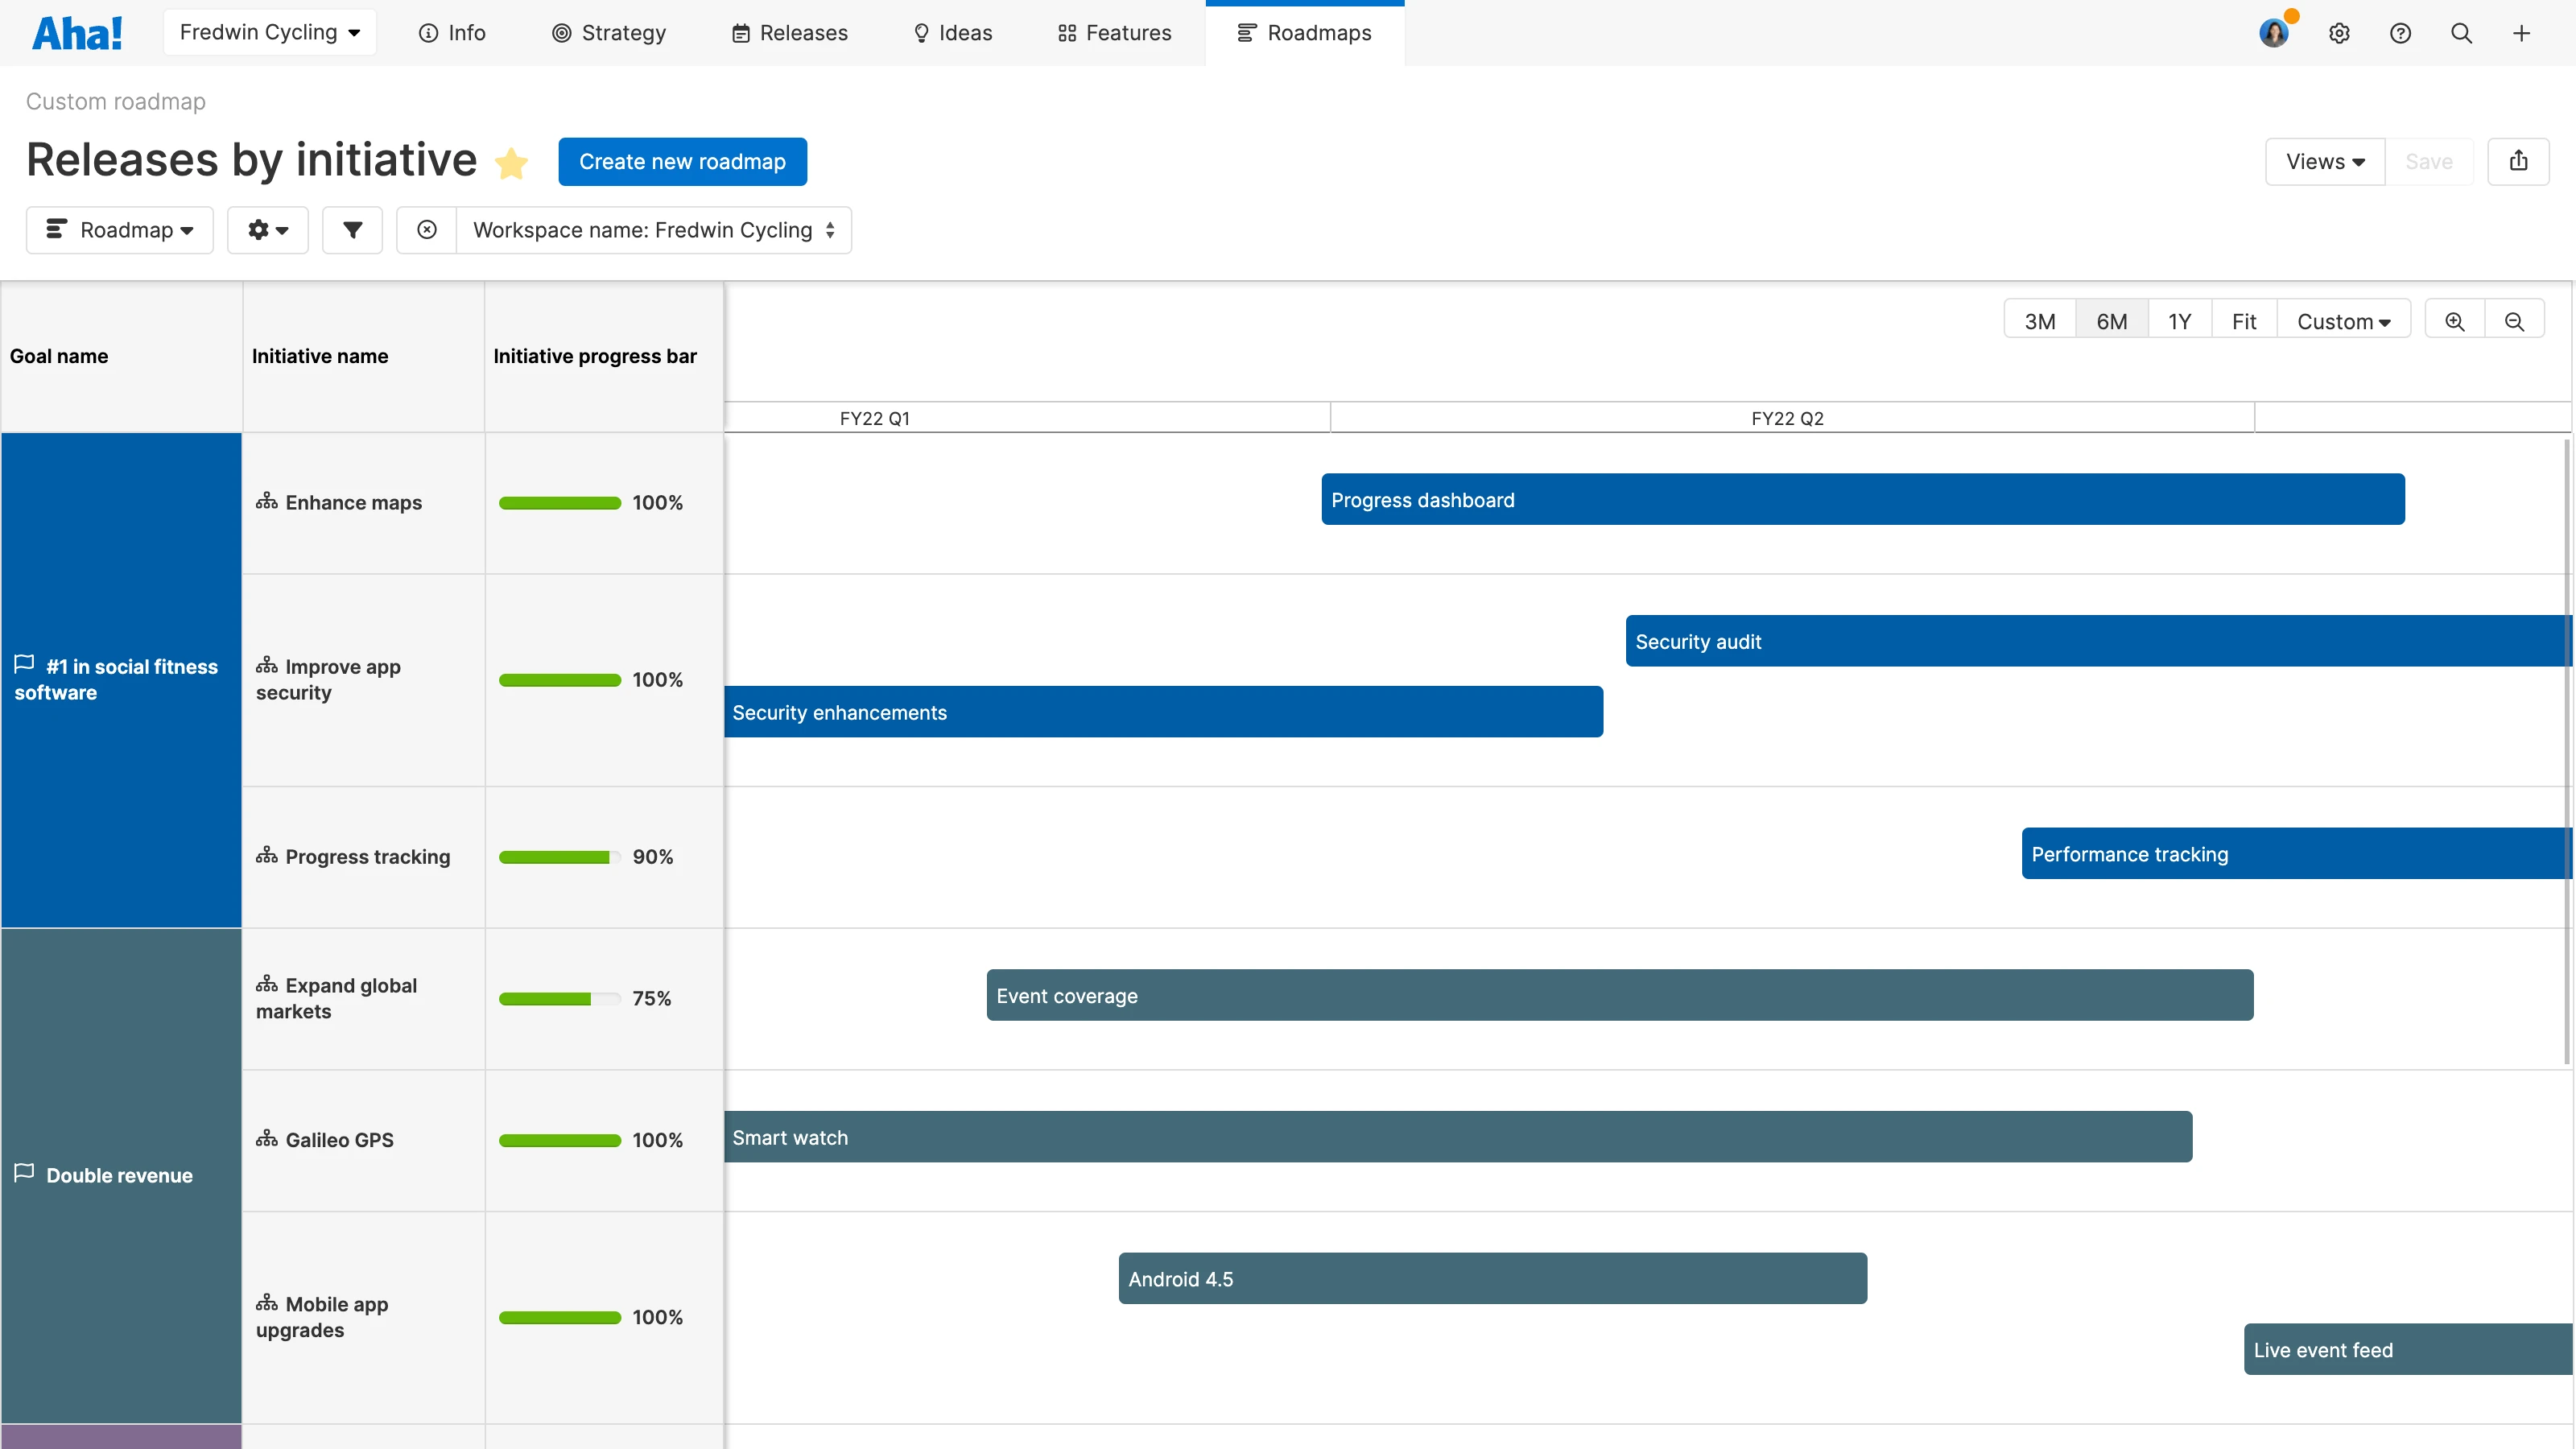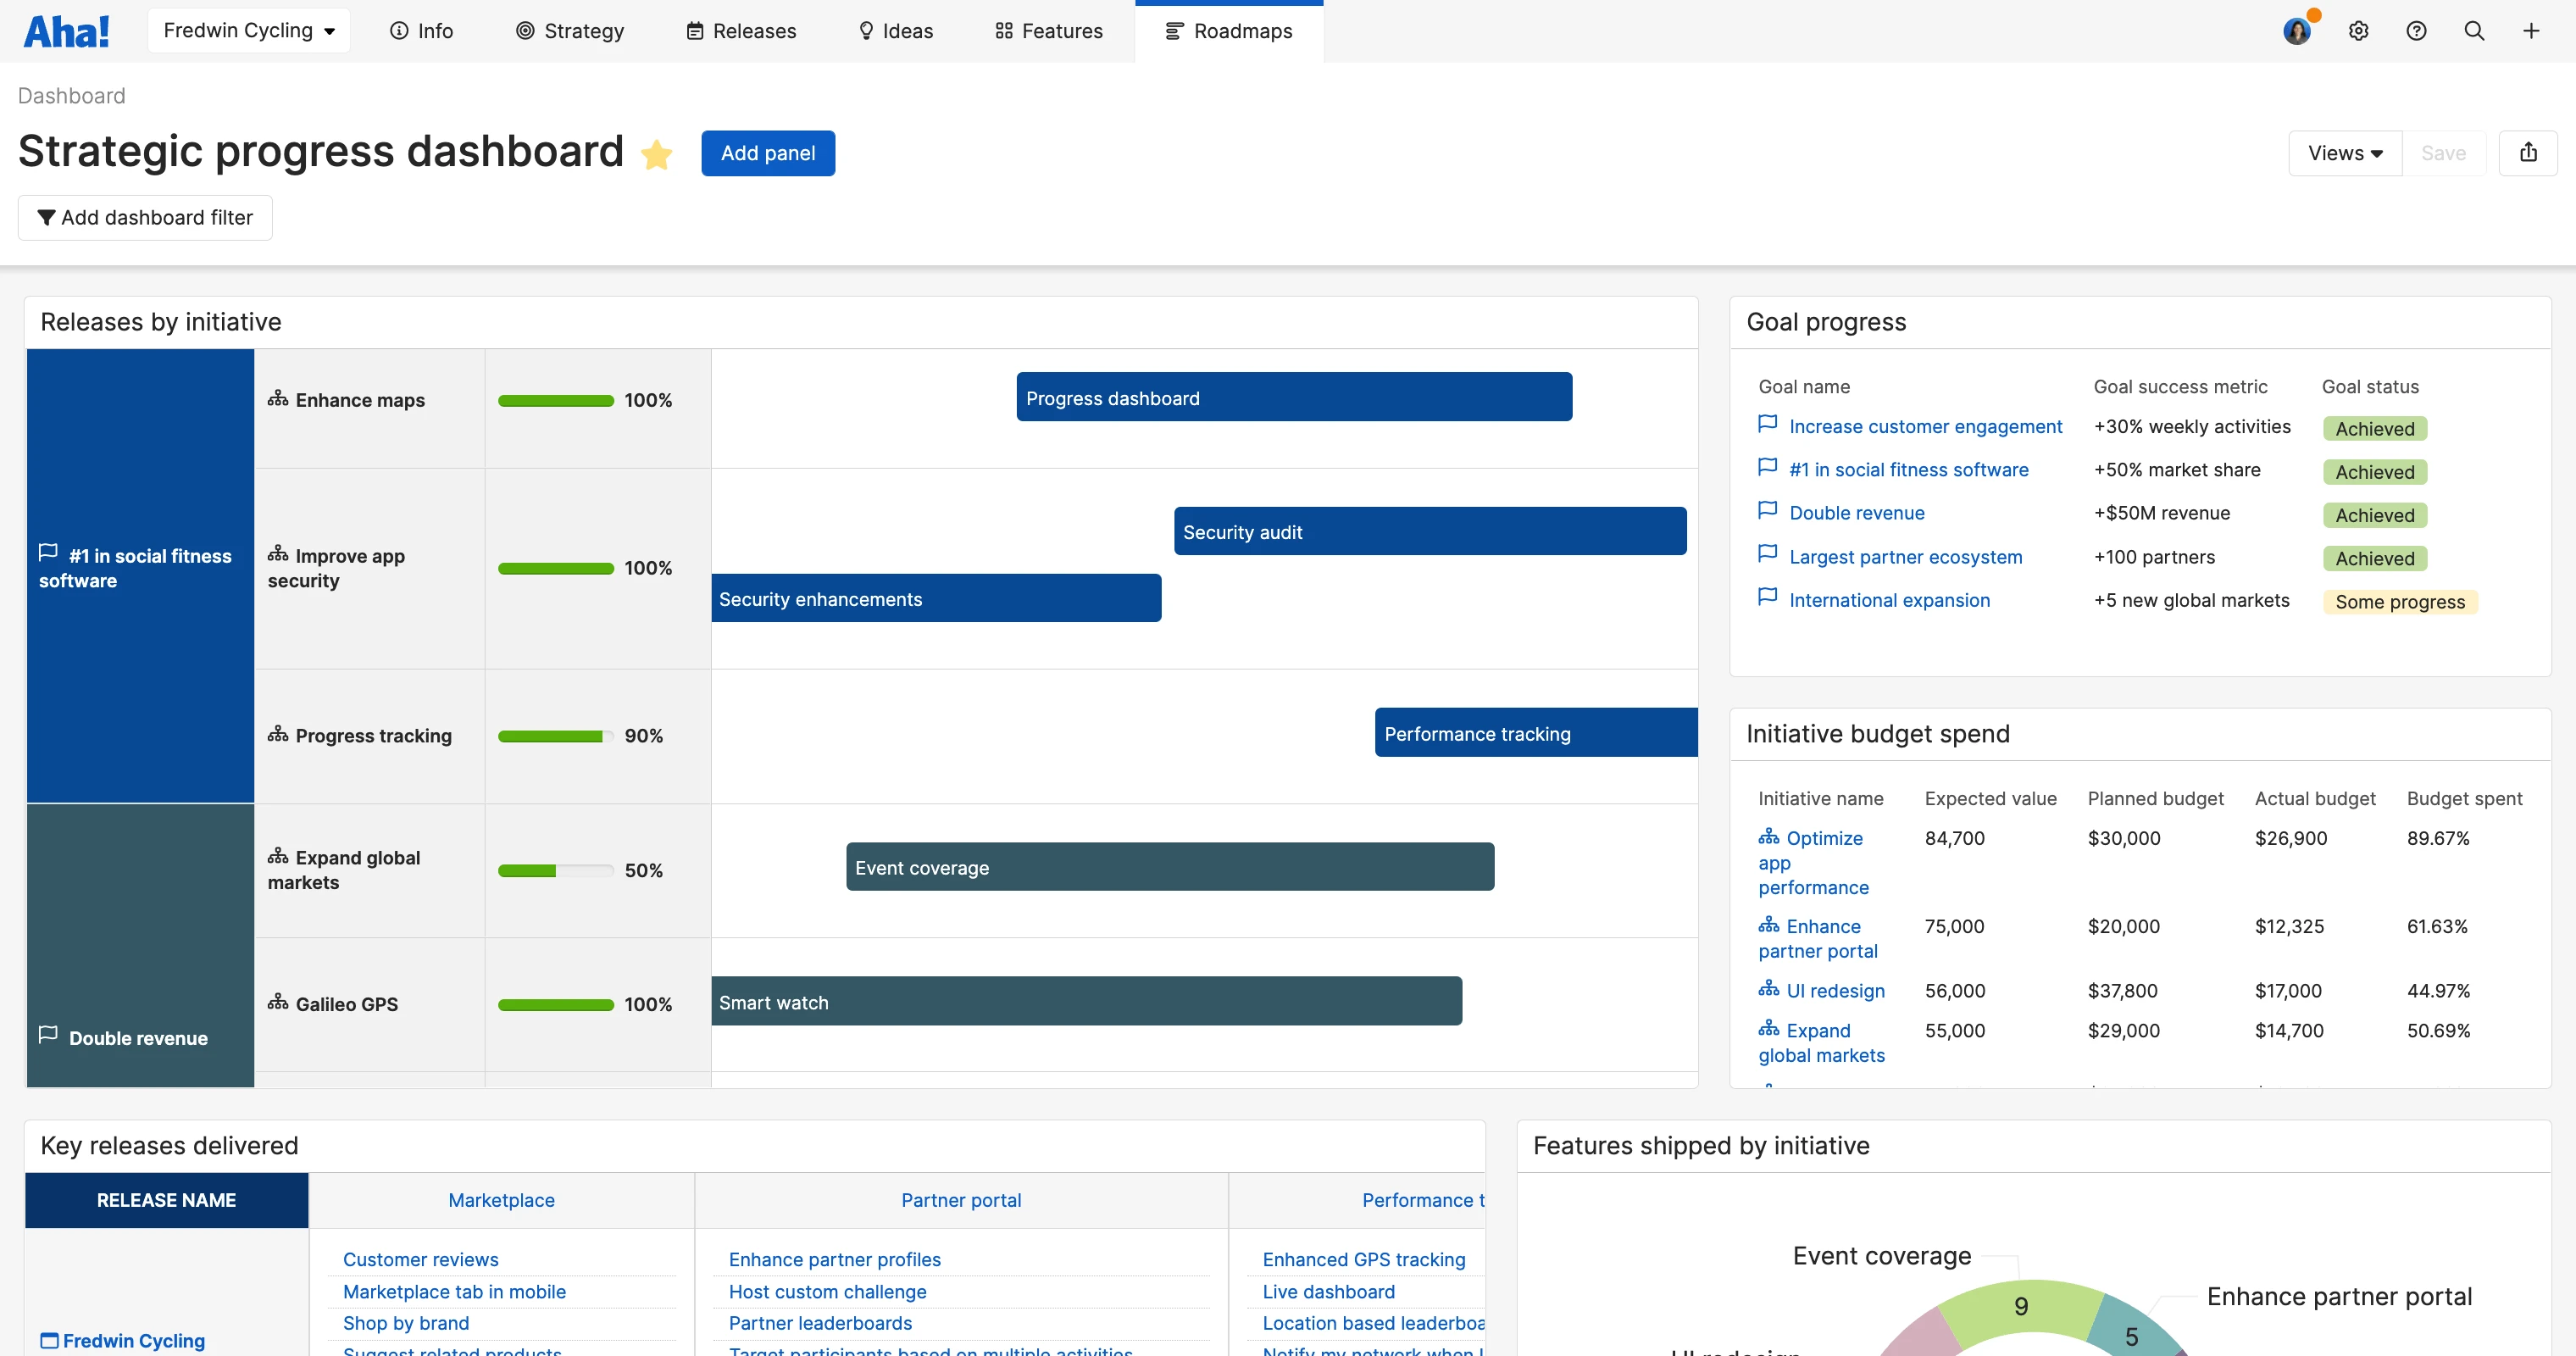
Strategic progress dashboard created in Aha! Roadmaps.
4 Ways To Report on Your Year-End Success in Aha! Software


The end of the year is a natural time to celebrate shared accomplishments. After a year with periods of high pressure and hard efforts, it is important to pause and review all that your team has done — both what you have delivered to customers and the value it has brought to the business. It is also a natural time to be critical about what is not working, so you can reset in the new year.
Let the four reports in this blog inspire you to show off your team's progress and productivity.
Every great product is a reflection of the people who build and support it. Success requires contributions from the entire product development team — folks in product management and engineering as well as marketing, sales, and support. This is why it is so important to celebrate achievements across the entire organization.
At Aha! each functional group has its own goals and initiatives — which ladder up to company-level goals. So it is standard for each group to create year-end reports based on their areas of focus. For instance, our marketing group might build a report outlining all of the activities that contributed to successful product launches or campaigns in the last half. Our product managers may want to create a view that shows how many new features or enhancements we shipped this year. And our leadership team will want to see a summary view that ties together strategic work across the organization.
We use our own software to create these reporting views (and so can you). You can choose from 75+ example reports in Aha! or use the powerful report builder to quickly customize your own visualization — using any of the data fields or records stored in your account.
'Tis the season for year-end reporting, so I asked the Aha! team to share a few of their favorite reports — from showcasing the completion of big goals to delivering on customer requests. Take a look:
Leadership: Progress towards goals
Leadership likes to see a summary view of how far the organization has come. A custom roadmap is the most powerful way to tailor the visualization across workspaces, goals, and initiatives. You can add your roadmap to a presentation with an option to keep it up-to-date so any final adjustments to your product data in Aha! are automatically reflected in the presentation.
"A custom roadmap like the one below is one of my most-used reporting views at the end of the quarter or year. I appreciate viewing the releases that impacted the success of our initiatives — it is a helpful way to connect our monthly work to company-level achievements." — James Harris, Director of Strategic Success
Product management: Features shipped
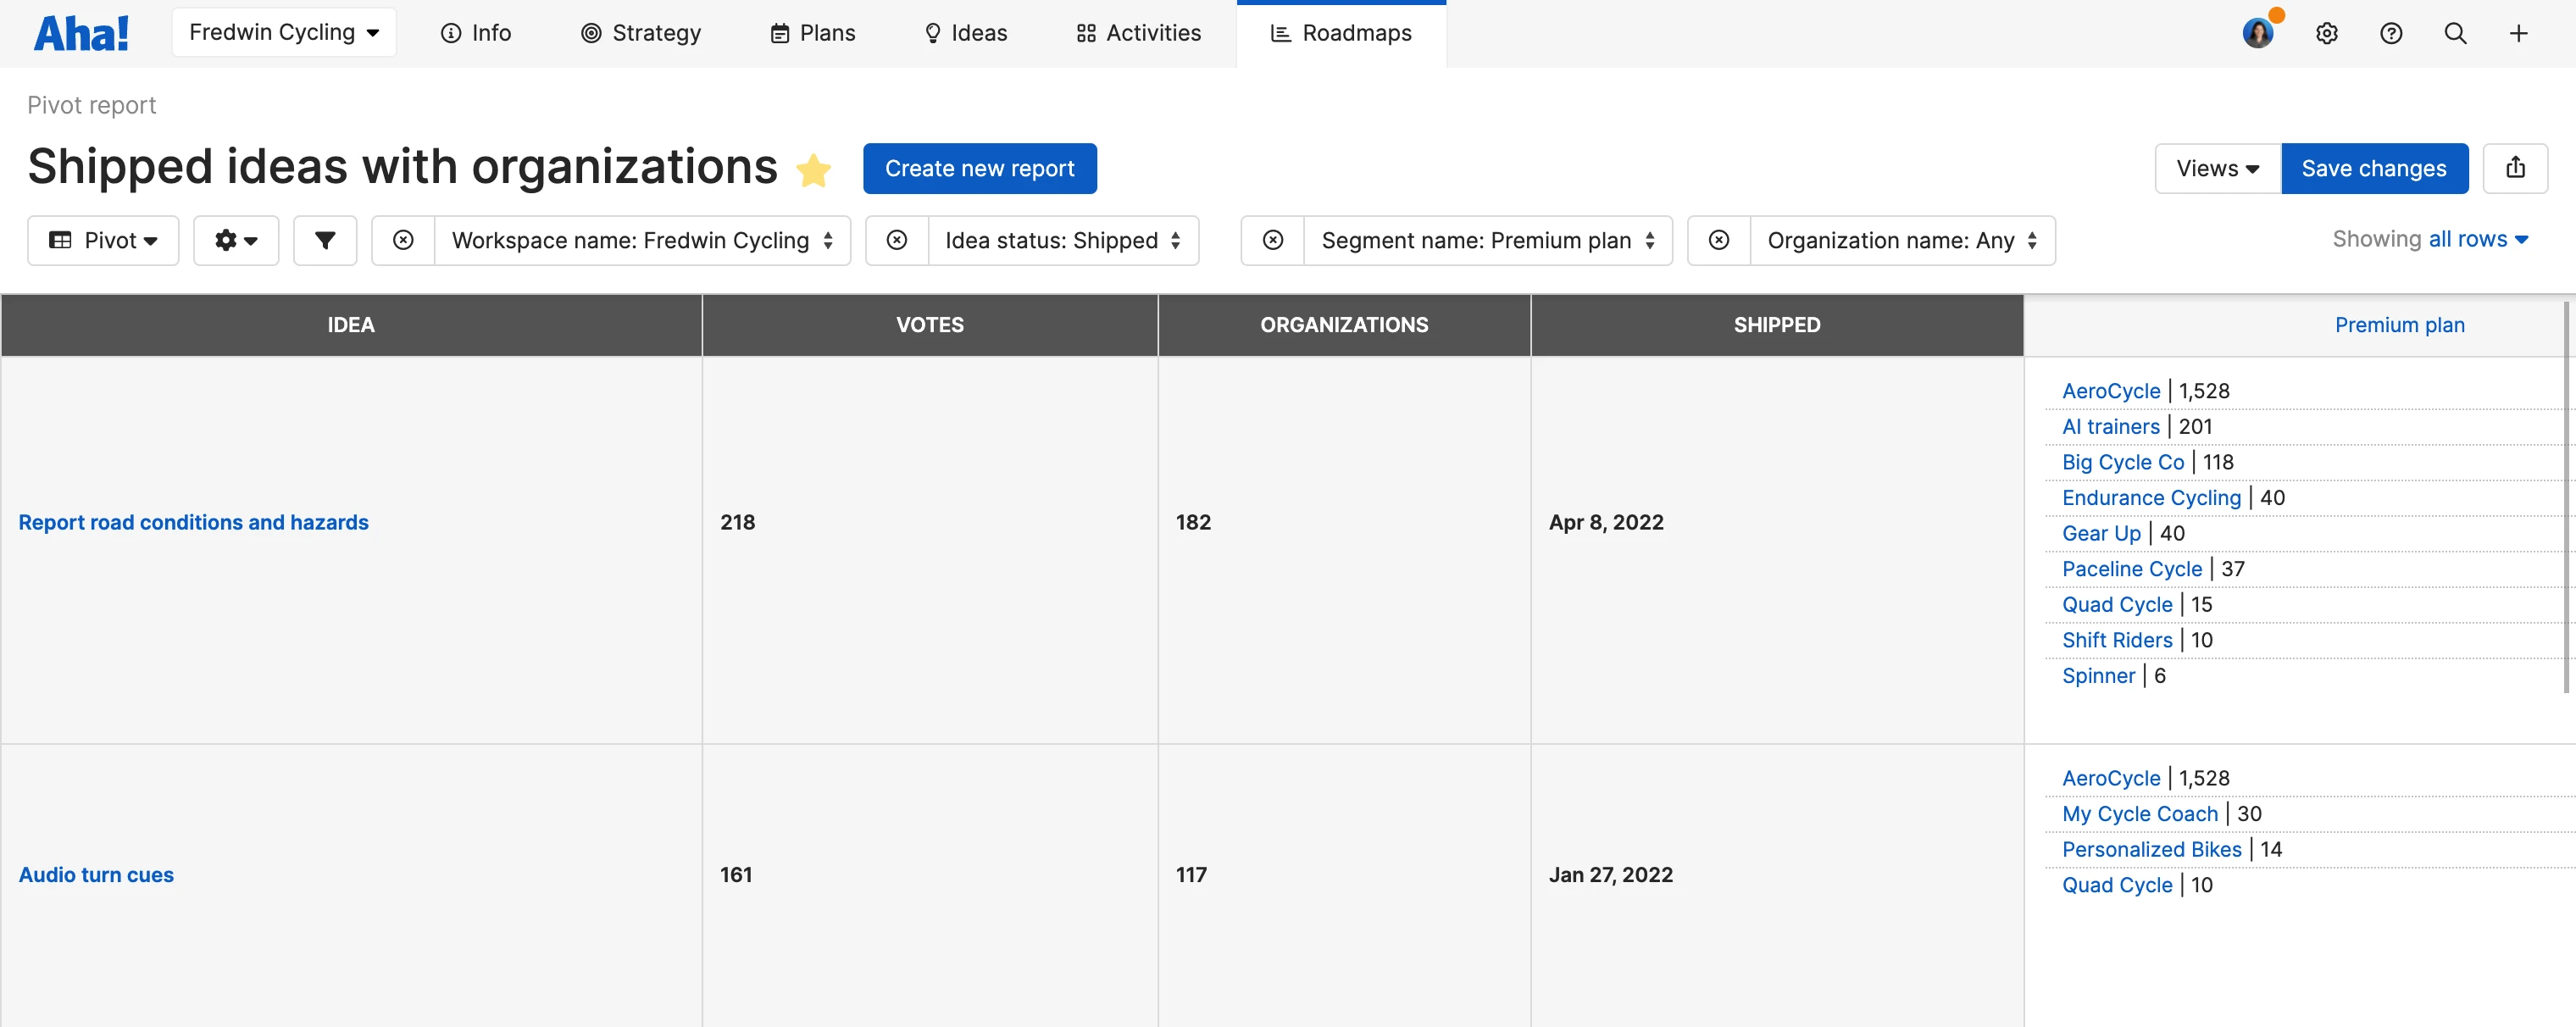
Our product and UX team want to know how many features we collectively shipped in a given time frame, including how many of those originated from a direct customer request. Viewing shipped ideas grouped by organization is a useful way to quantify how we are meeting our customers' needs. Customer Success and marketing appreciate seeing this report too, as it brings more context to the types of requests the team moves forward on.
"Being able to view ideas by organization in Aha! Ideas has been a game-changer for me as a product manager — now I can more deeply understand who is asking for what. In the sample report below, I am looking at multiple ideas and organizations at a time. I love sharing this type of report with internal teams so folks can see what we shipped over the course of the year. Our Customer Success team can also follow up with customers to see how they are liking the new functionality." — Kelly Sebes, Sr. Product Manager
Development: Value delivered over time
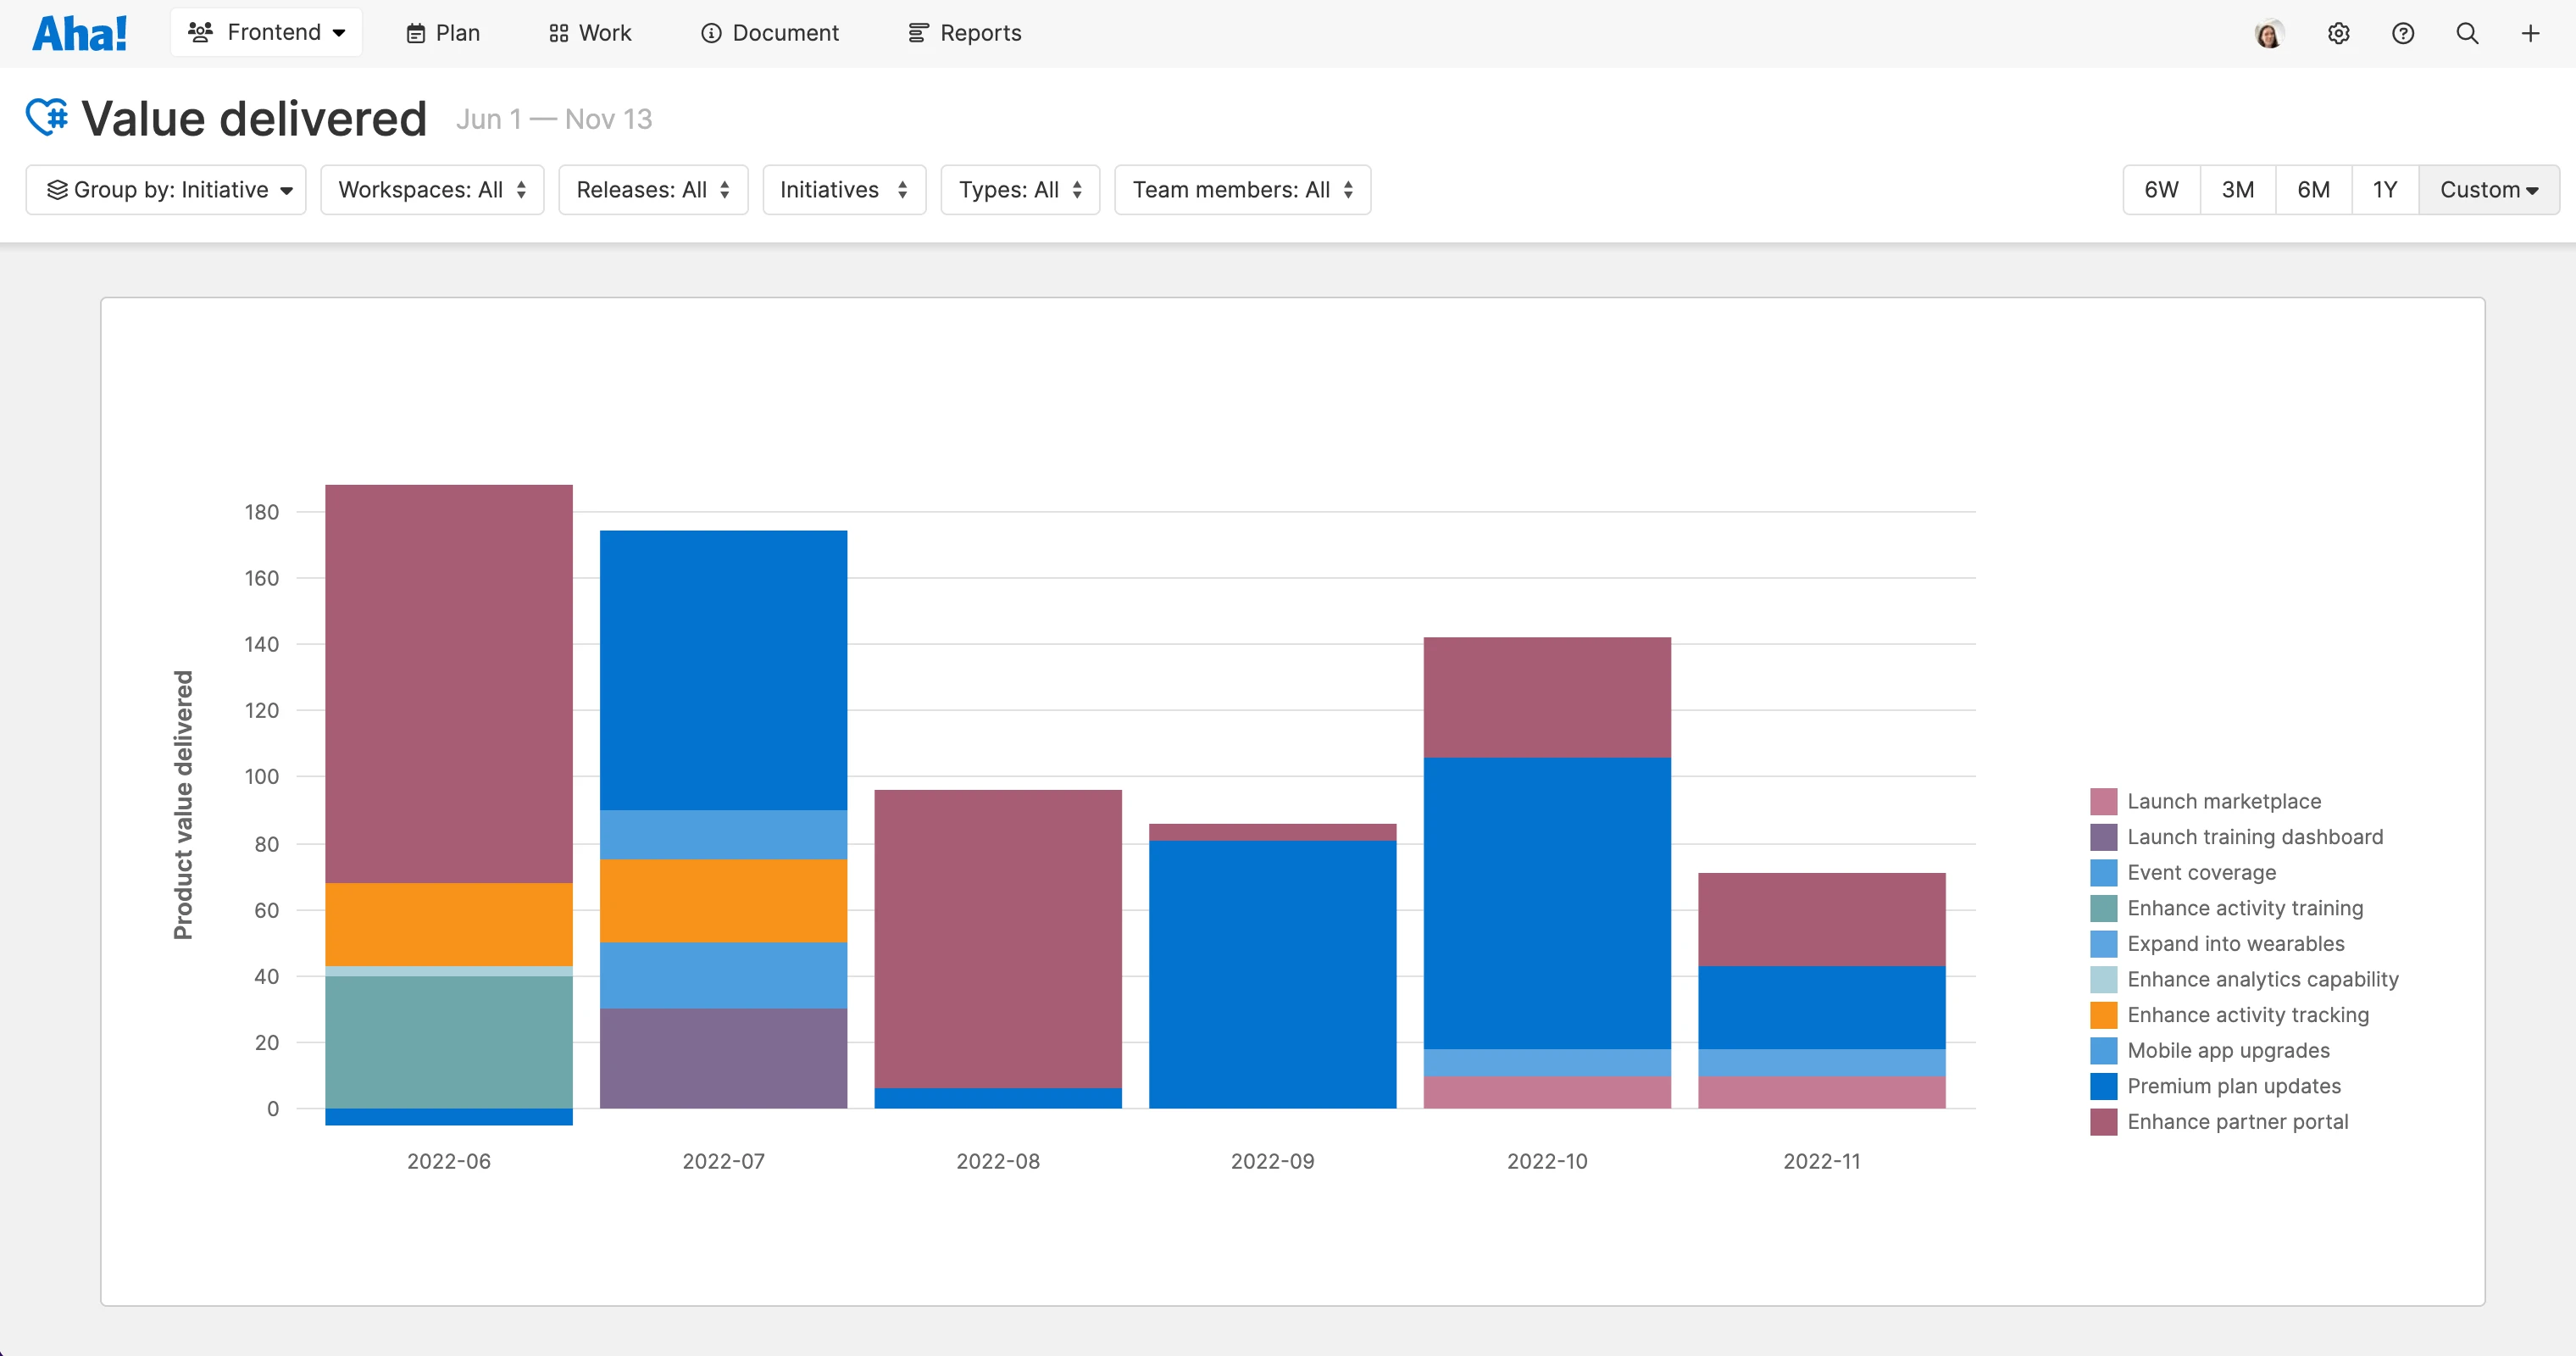
Developers at Aha! care as much about delivering real value to customers as our friends in product management do. Maybe this is why more than a couple of them told me that the new Value delivered report is their favorite recent addition to Aha! Develop. The report pulls from the product value score in Aha! to give you a sense of the overall value your work has on the product and the business — based on factors like number of customers impacted, level of effort, or how closely the work tied to strategy.
"It can be tough for technical teams to measure the impact of their work. You can focus on burndown, velocity, and throughput — but how do you assess the true value of what you have built? The Value delivered report is our answer. In the example below, you can set a target score and then compare value delivered over time. This can spark healthy conversations about where you should spend your time next or how to balance effort against outcomes." — Jeff Tucker, Sr. Product Manager
Marketing: Launch retrospective
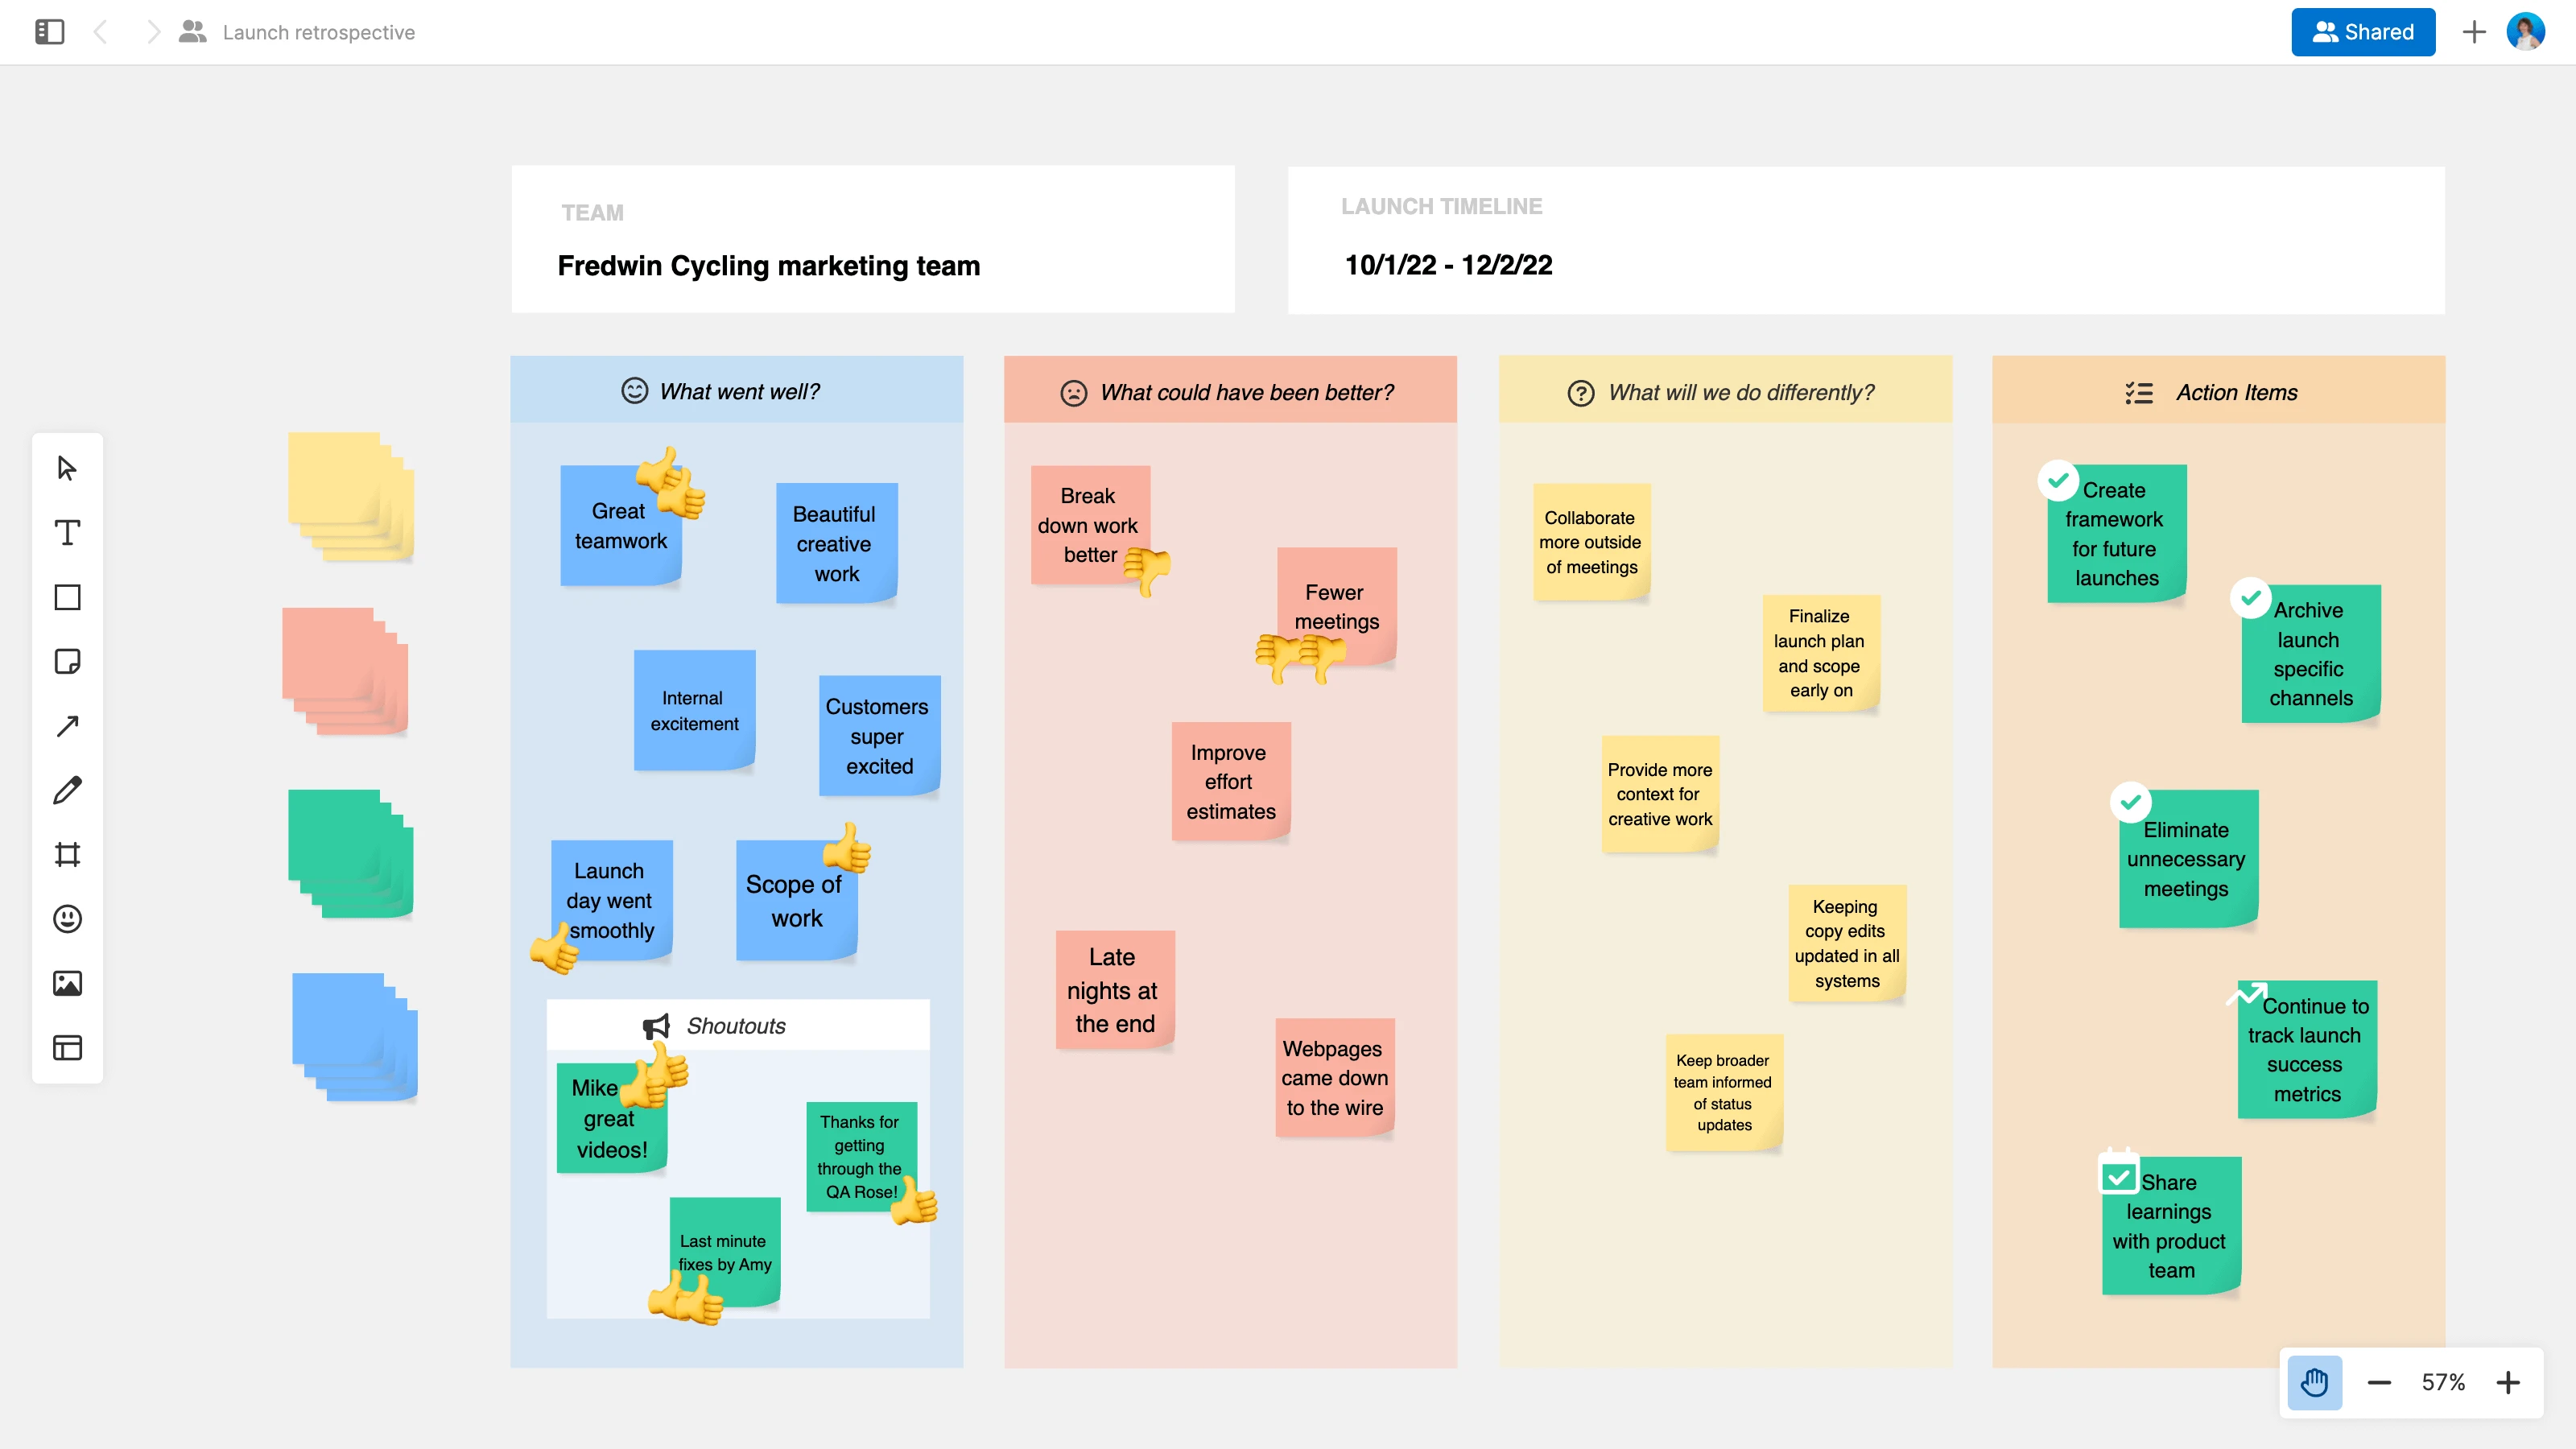
This final example comes from the product marketing team and it is much less report-like. But I find it worth mentioning because it is another way we use our software to wrap up a large effort before beginning the next — so it is well-suited to an end-of-year review.
"I love the retrospective template in Aha! Create and have already used it more than once. The example below resembles how we reflected on a recent marketing launch. Once we collected and discussed the feedback, we embedded the whiteboard view directly in our team meeting note in Aha! — this gives us a shared record of the learnings to revisit before our next big launch." — Amy Ellis, Group Manager, Product Marketing
Of course, these are just a few of the reports you can build. Yours will vary depending on the details that matter to you. If you have any questions along the way, do not hesitate to reach out by email. We are happy to help you sort out your reports (and toast to your accomplishments).
Use Aha! and be happy. See for yourself — start a free 30-day trial.