How PMs use Gantt charts
Gantt charts — essential or unneeded in product management? It is worth acknowledging upfront that some product managers and agile enthusiasts are skeptical of Gantt charts. Why? Because they still associate Gantt work with a waterfall approach to software and product development. But the reality is that using a Gantt chart does not mean that your workflow is slow, inflexible, or outdated. In fact, agile teams can greatly benefit from using Gantt charts to visualize the details of complex releases. After all, even agile product work requires you to manage cross-functional activities and stick to start and end dates.
What is a Gantt chart?
Let's start with a basic definition. A Gantt chart (for product teams) is a visualization of your product plans and when the team will achieve them. It is primarily a planning and scheduling tool showing key activities and tasks across a specific time period — as well as the phases, milestones, and dependencies along the way.
Visualize and share product plans in Aha! Roadmaps. Start a free trial.
Gantt charts were first used in the early 1900s, when management consultant Henry Gantt introduced the concept of plotting deliverables against time. The original purpose was to increase efficiency and productivity in factory operations. Gantt chart schedules were later used to help plan and build complex infrastructure projects, including the Hoover Dam and U.S. interstate highway system.
Today, everyone from business leaders to project managers uses Gantt charts to capture the details of all types of deadline-driven efforts. For the purposes of this guide, we will zoom in on how product managers and product development teams use Gantts in their work. Let's explore the following topics:
Why are Gantt charts useful?
In order to accomplish any effort, the entire team needs a plan. This is especially important when your project is big or complex with cross-functional dependencies — when certain stages of work or specific tasks must be finished before another team can begin work on the next phase.
Consider a software company that is preparing to launch major new functionality. The product marketing, sales, and customer support teams will need to undergo internal training in order to be able to communicate the benefits of the new features (and explain how the functionality works) to customers. Likewise, the engineering team will need to document and address bug fixes before the product is launched.
This illustrates one reason why Gantt charts are so valuable — they help you see all the interconnected work in one place, anticipate any obstacles or risks, and track progress against your plans. They provide clarity and visibility to everyone involved in a product release, aligning the entire product development team around a shared plan and timeline. Ultimately, using a Gantt chart makes it easier to meet your product goals and deliver new products, updates, or features on schedule.
Components of Gantt charts
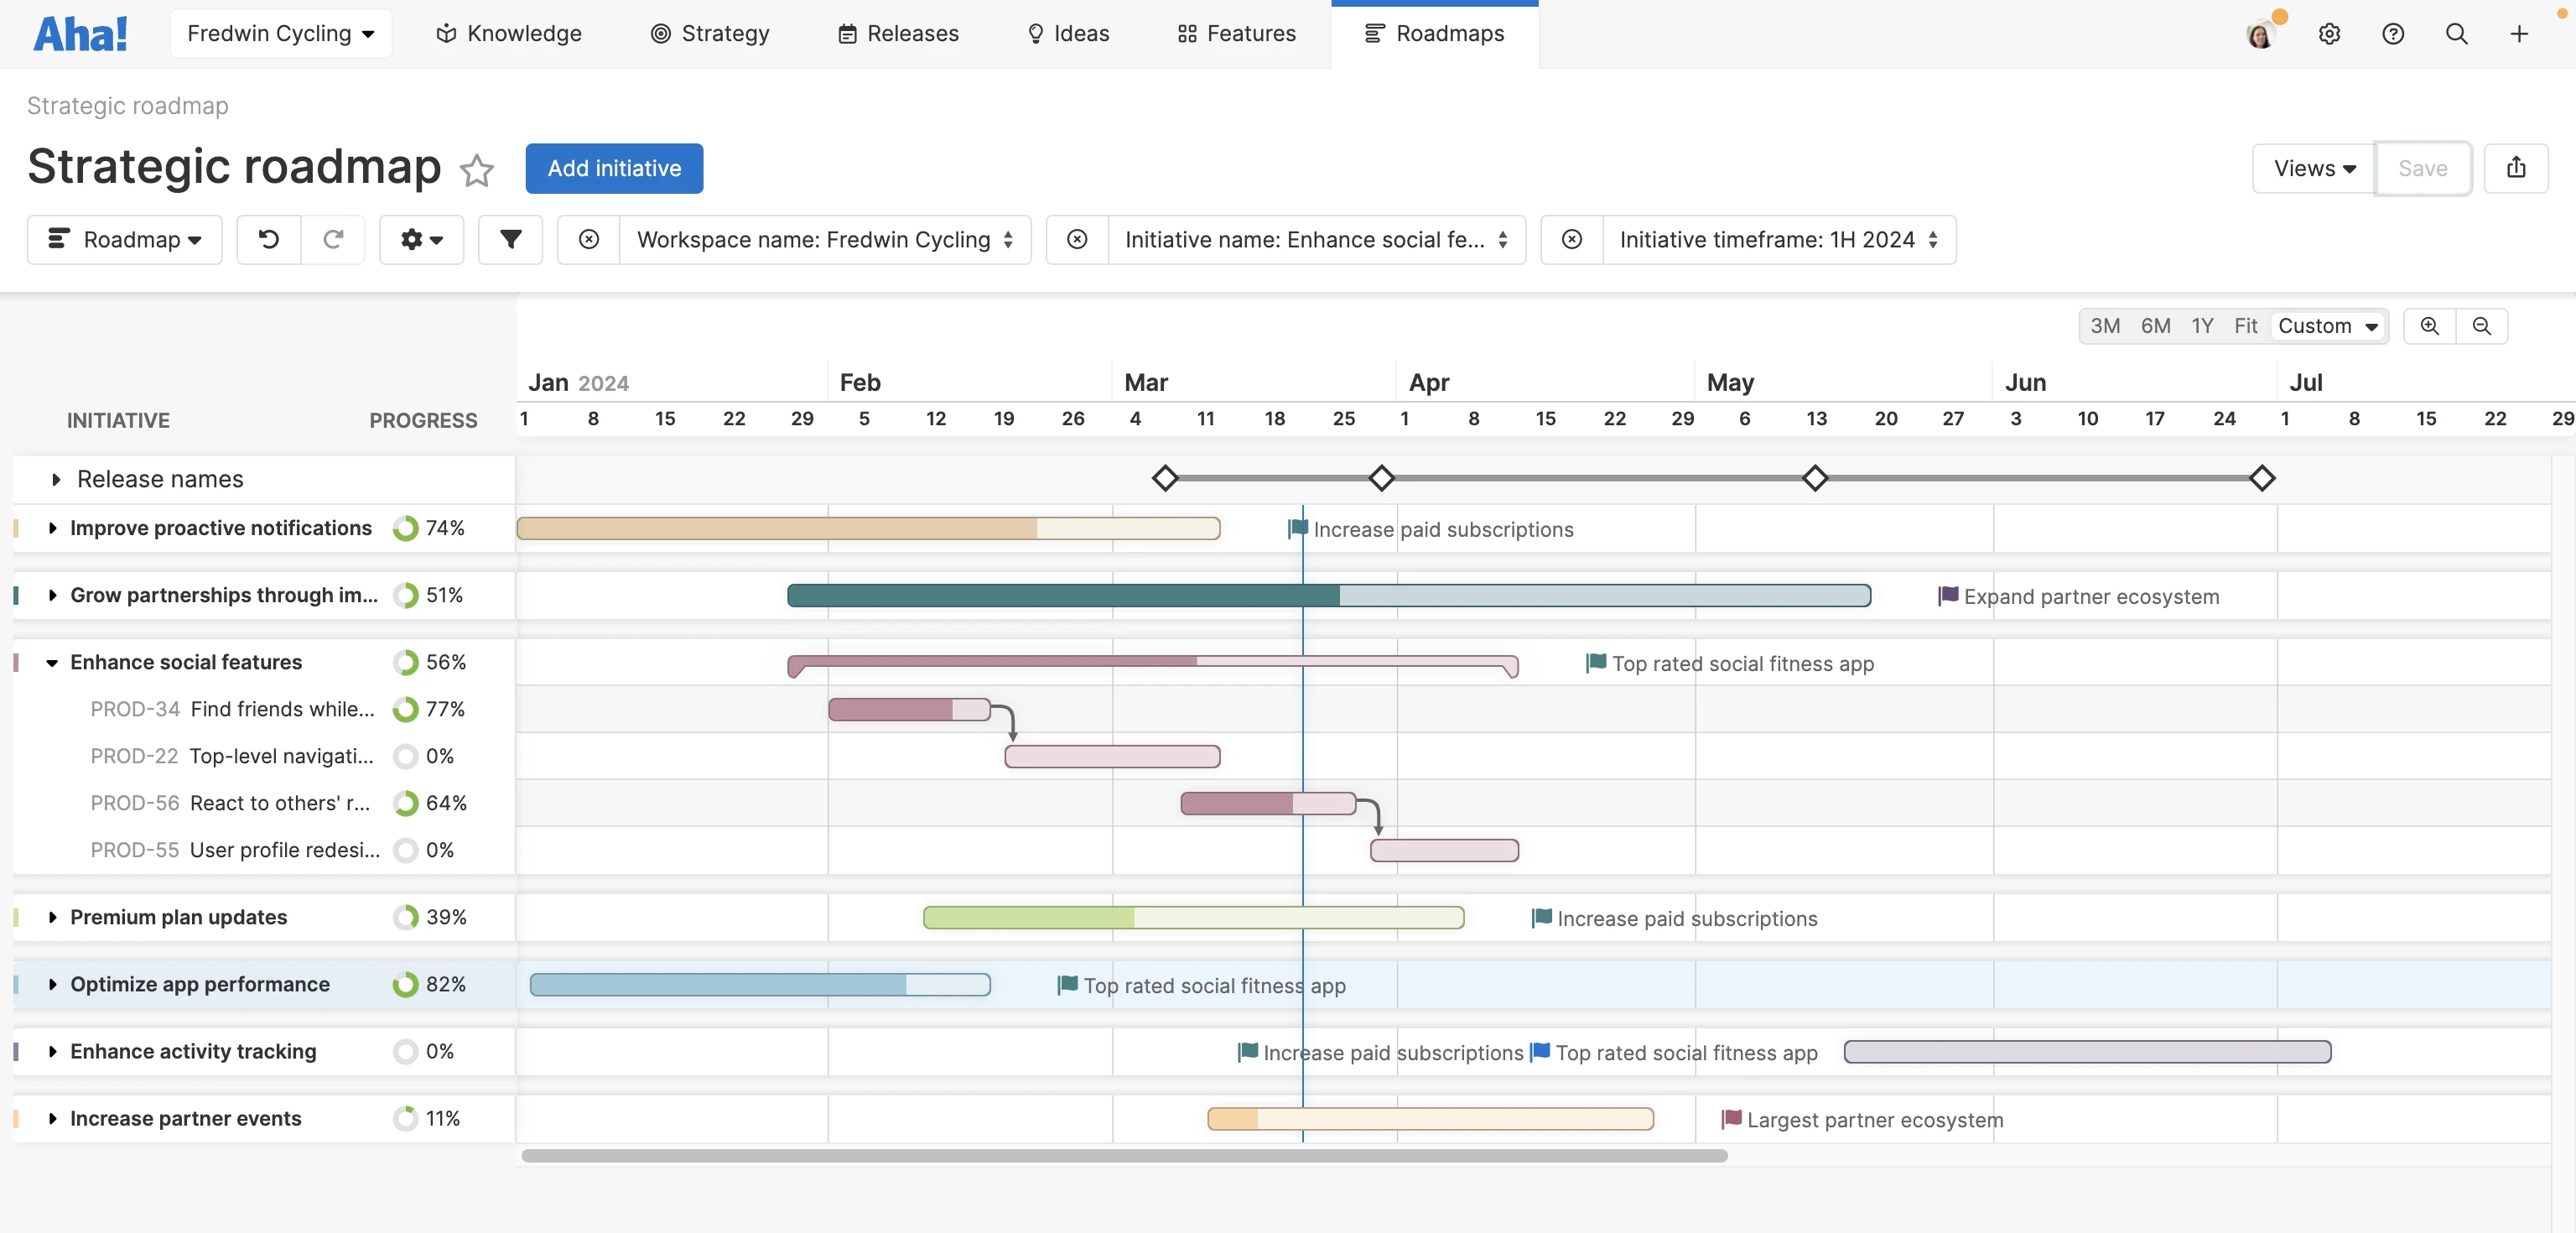
A big benefit of Gantt charts is the large amount of information you can quickly convey with them. Within a single view, you can show the different areas of work that must be completed, which teams are responsible, progress made so far, and the timing of it all. Most product teams pick a timeline that makes sense for their specific offering and launch plans — usually weeks, months, or quarters.
Here are some of the components to include on your Gantt:
Phases of work
Milestones
Dependencies
Activities or tasks
Project owners and assignees
Due dates
On this Gantt chart, look closely to see how a portion of some of the bars are shaded. This is a visual indicator of the percentage completed of that phase of work.
Of course, including the right visual elements is vital. Creating a Gantt that is clear and compelling requires that you know exactly what you want to convey and how you want to convey it. Gantt charts tend to be extremely detailed, so establishing (and consistently using) a visual system helps viewers understand all the details you are trying to communicate.
Depending on the type of Gantt view you want to create, you can incorporate horizontal or vertical bars to represent work, lines or arrows to show dependencies, and colors to designate different teams or the status of each phase of work. The aesthetics are really up to you and your preferences — what matters most is that you create consistent visuals so that everyone can understand the plans.
Gantt charts vs. product roadmaps
As we mentioned earlier, all types of product teams can find value in using Gantt chart views. This is true no matter what methodology you follow. You also need a strategic product roadmap to center your efforts around. Think of your roadmap as your high-level plans and your Gantt as the detailed work you will pursue to make your goals a reality. Each tool offers a different perspective on what you are trying to achieve.
Here is a closer look at the differences between Gantt charts and product roadmaps:
Gantt charts | Product roadmaps | |
Purpose | Capture the details of the work that must be completed (and when) in order to achieve product goals. Clarify how each cross-functional team contributes to an upcoming effort. | Capture product objectives and the big areas of effort needed to achieve them. Clarify how the product strategy supports the overall business goals. |
Scope | Define the "when" and "what" for all the phases of work needed to meet the delivery date. | Define the "why" (as well as the "when" and "what" on a high-level). |
Teams | While product or project leaders are usually responsible for creating a Gantt chart, everyone from product marketing to engineering to customer support should participate in the process and watch closely for updates to cross-functional work or dependencies. | While business or product leaders are usually responsible for creating a product roadmap, everyone across the broader product team (and throughout the organization) should offer input and have visibility into any updates. |
Update frequency | Update often — whenever phases are completed, dependencies shift, or deadlines are missed. | Update occasionally (once every month or quarter) — when business or product goals pivot or large milestones change. |
Most product teams use both a product roadmap and Gantt. The symbiosis between your product roadmap and Gantt chart is essential — the work on your Gantt must support the broad objectives on your product roadmap. This is how you can be confident that the team's work is actually aligned with the overall product strategy.
Gantt chart tips and best practices
Some product teams struggle with Gantt charts because the information on them quickly becomes outdated or inaccurate. This is particularly frustrating if you are part of an agile team that prioritizes speed and incremental innovation. Another common complaint is a poor user interface. Your Gantt might be visually unappealing, overly complex, or difficult to modify and share.
The good news is that these issues are all fixable — they often stem not from the Gantt itself, but from how well you use (or do not use) it as a tool. Here are four best practices to keep in mind that will help you sidestep many of the challenges listed above:
Accurate Keep the information on your Gantt chart current. Update it whenever plans, dates, or project owners change. (If updates happen frequently, consider choosing a purpose-built product management tool that updates your chart automatically based on adjustments made to your work phases or timing.)
Flexible Many tools include templates with Gantt chart functionality that you can quickly modify to fit your needs. This can make it easy to create your Gantt, share views, and collaborate with teammates.
Consistent Whenever you update your Gantt chart, make sure to follow the visual conventions you have already established for your chart. This means being mindful of color schemes, how you indicate dependencies between work, and other elements such as shading on progress bars.
Direct Gantts by nature are detailed and complex. But it is important to not overcomplicate or overstuff your chart with information — otherwise it can become confusing or overwhelming to viewers. Aim to be as straightforward and concise as you can and stick to communicating only the most pertinent information on plans and timing.
The best Gantt schedules are easy to understand, look good, and complement the other types of product planning tools that your team already uses.
Creating your own Gantt chart
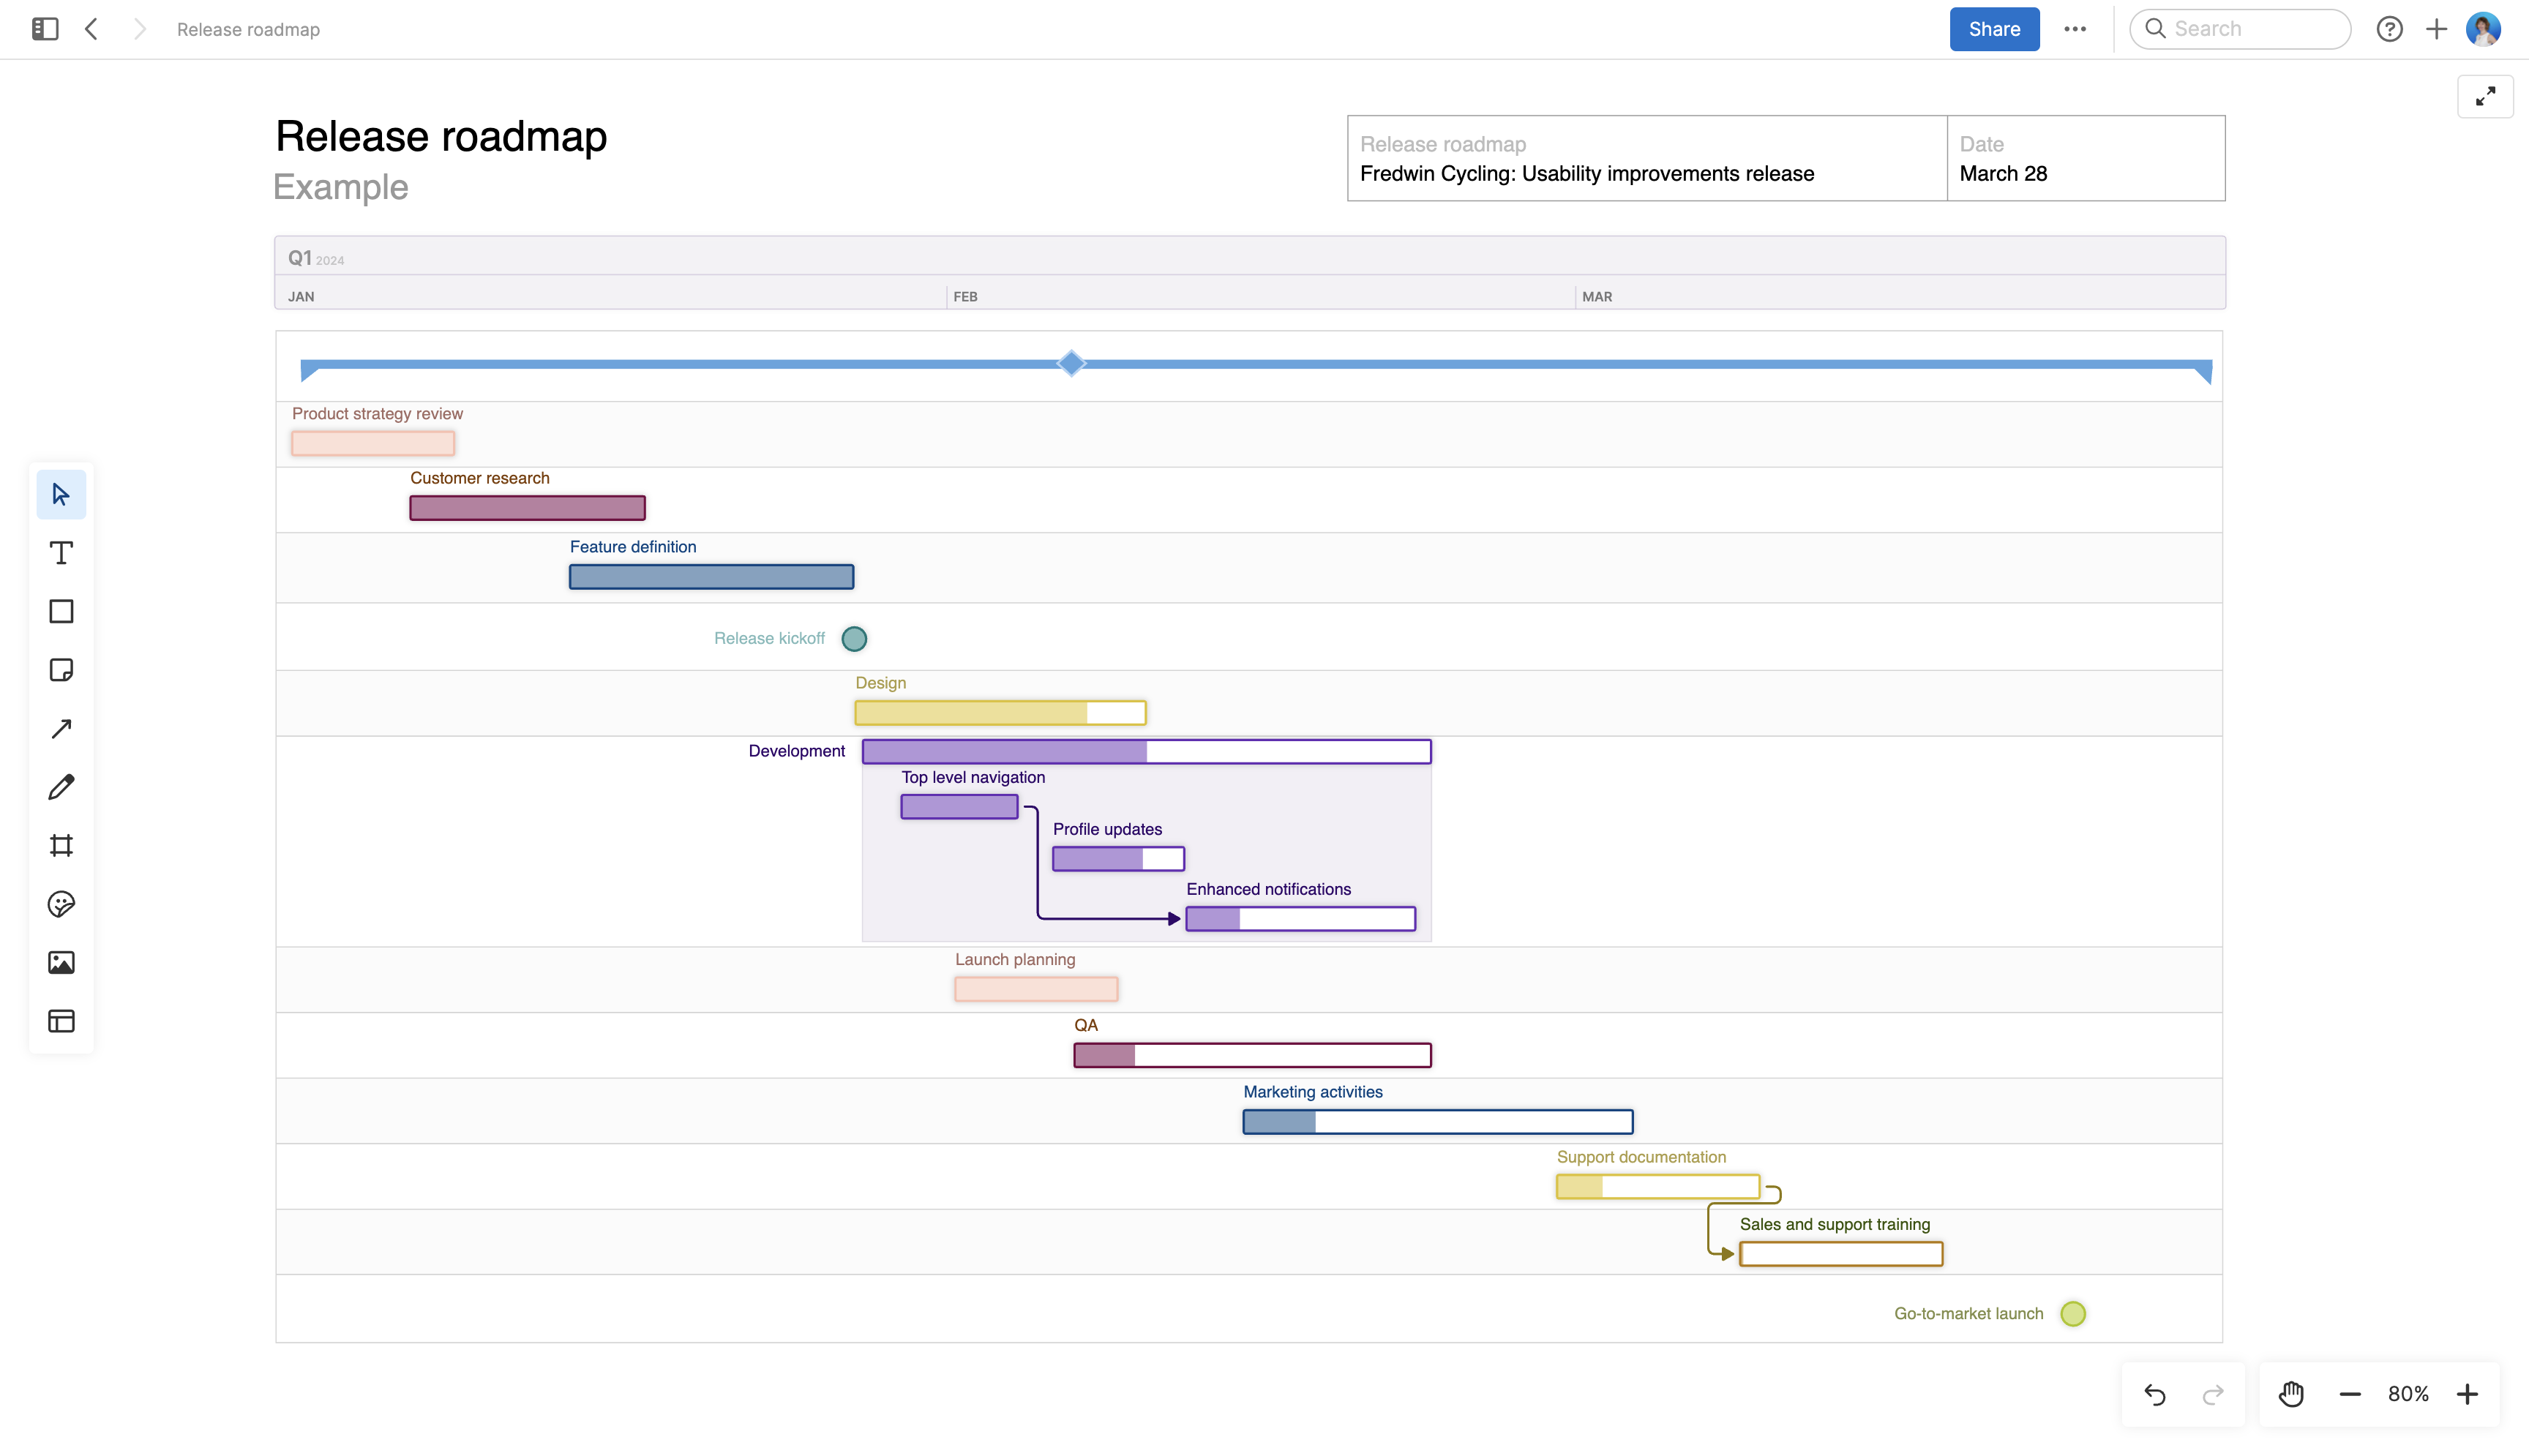
If you are just getting started with Gantt charts, consider using a template to help you. This Gantt-style release roadmap template in Aha! software makes it simple to build out a timeline on a whiteboard — while including important details like milestones and dependencies. You can also download our free Excel and PowerPoint Gantt chart templates to try other types of Gantts.
When you are ready to create a more structured Gantt chart, give Aha! Roadmaps a try to build one in minutes. You can collaborate with teammates, track updates in real time, and create different Gantt views depending on the audience you need to present your plans to — all in a single tool.