Fishbone diagram template
Identify a problem's potential causes — focusing on people, process, equipment, materials, and environment
Use template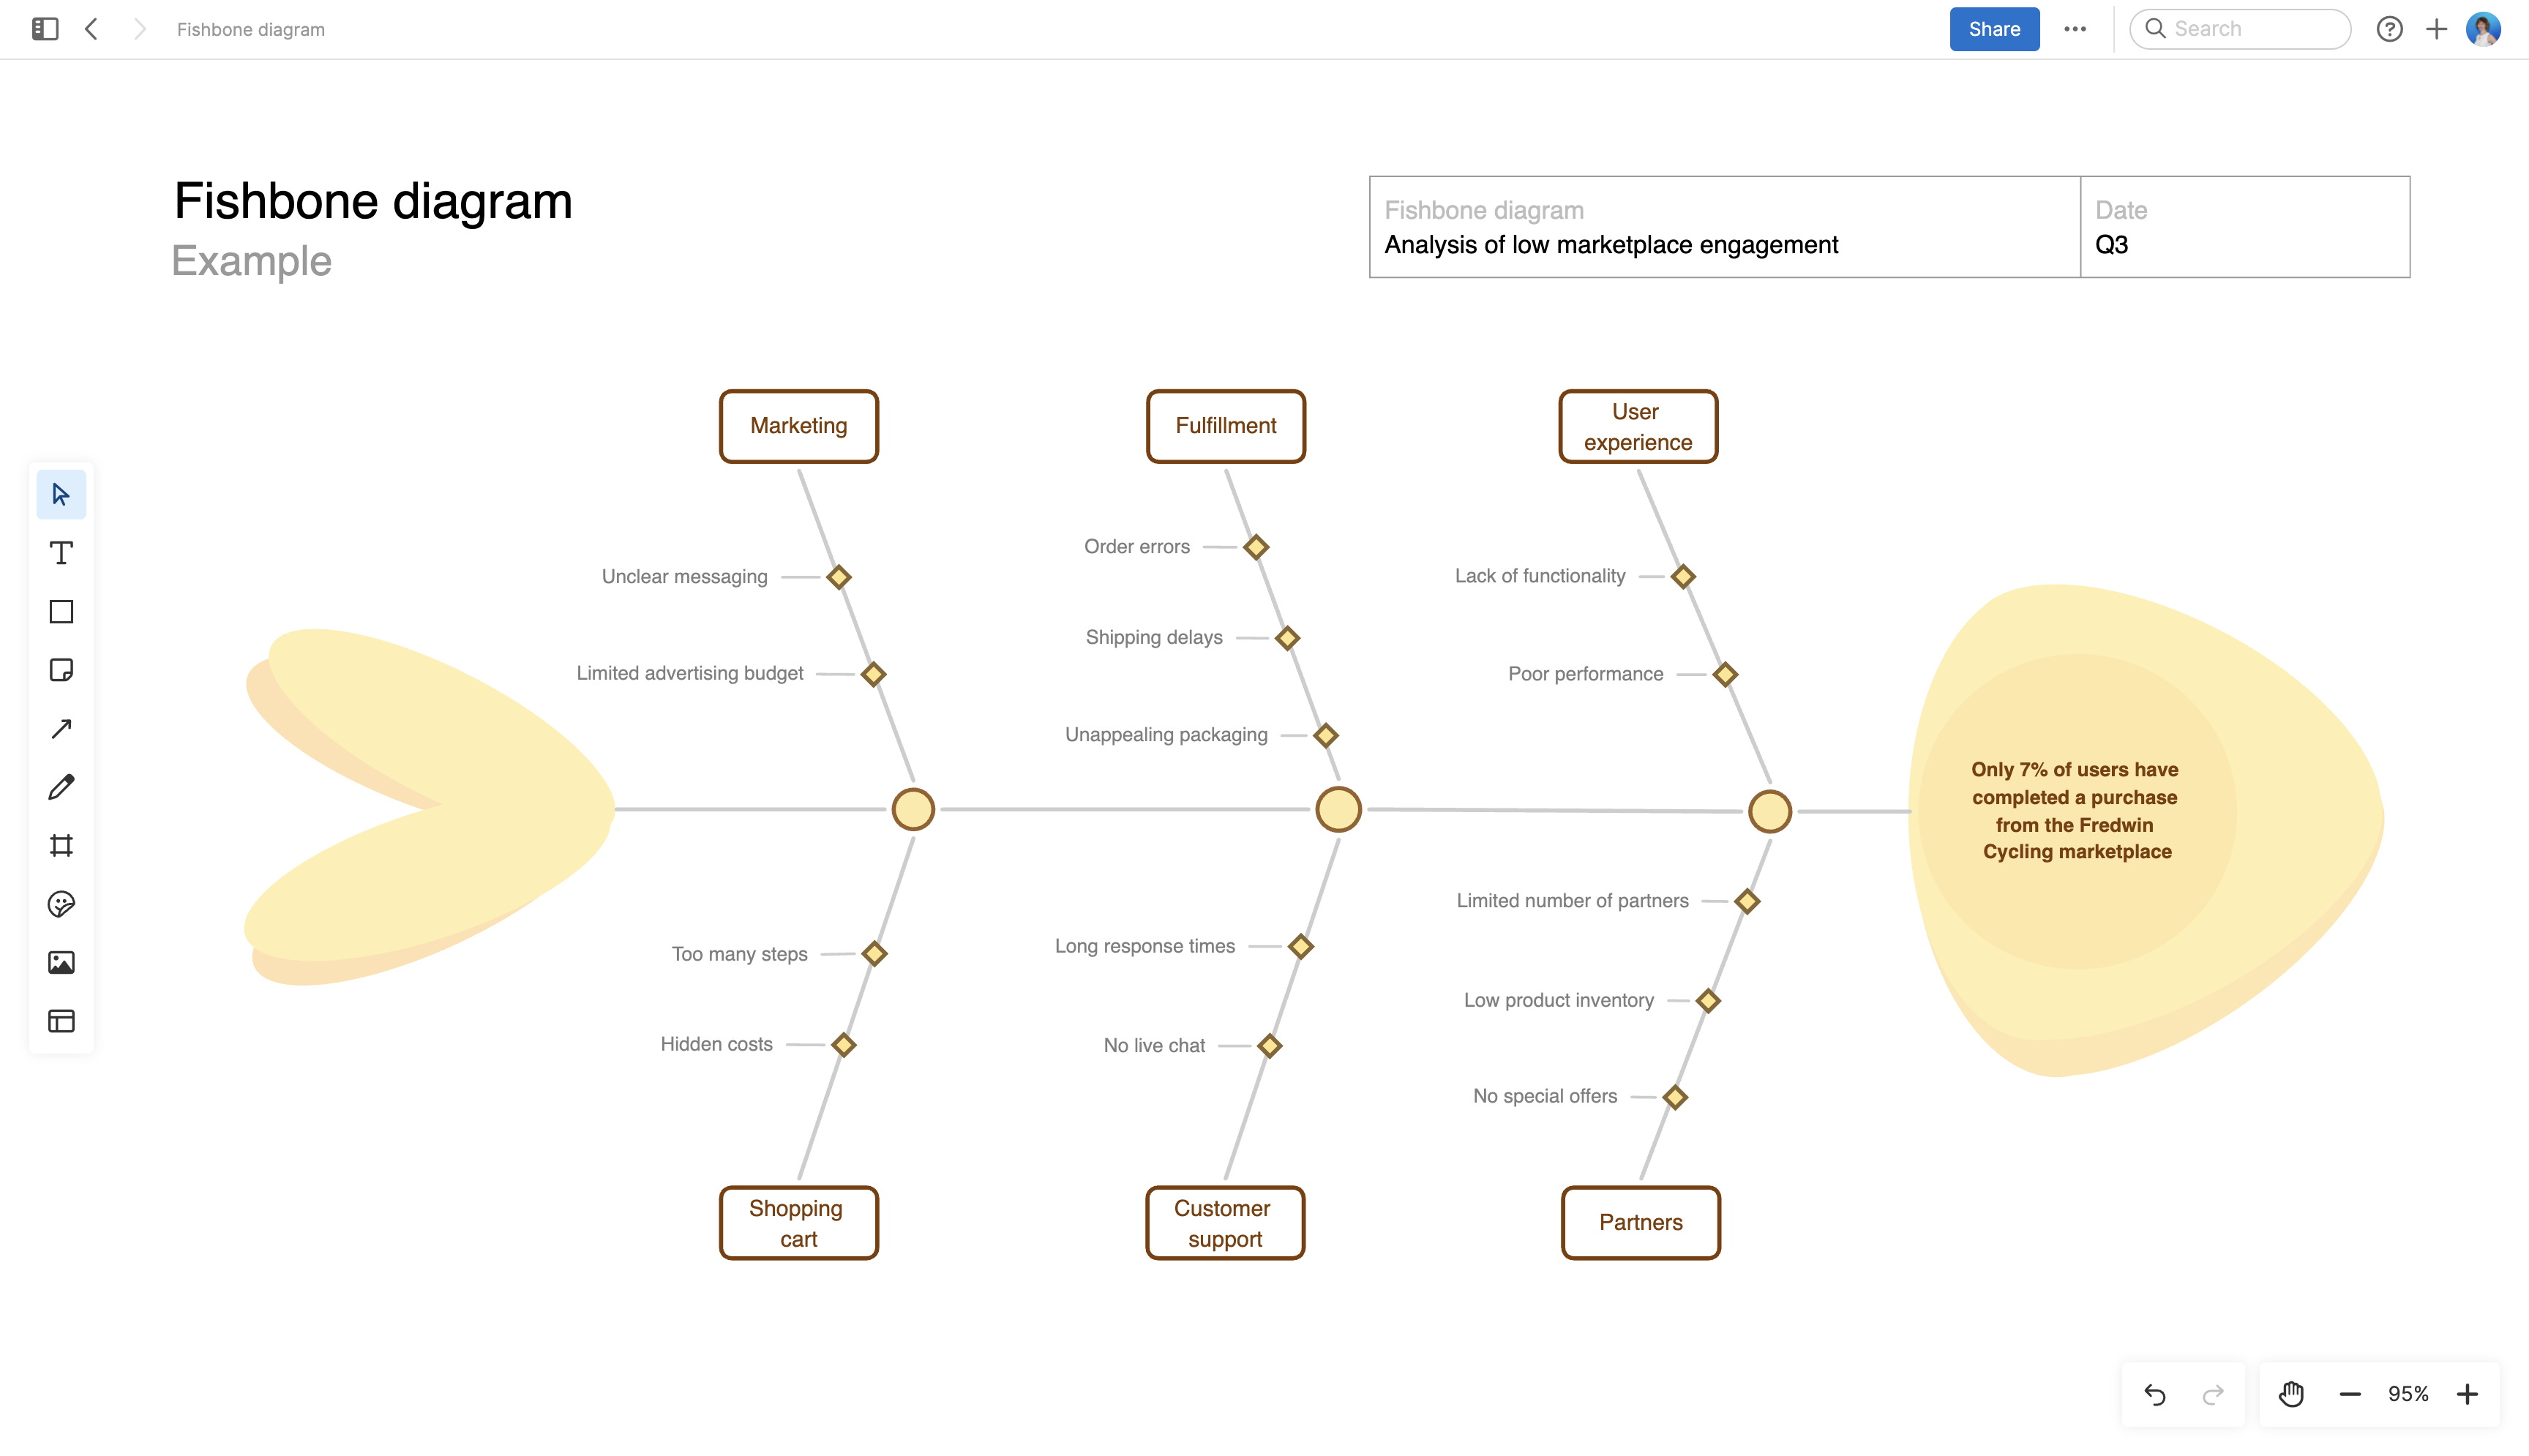
About the fishbone diagram template
A fishbone diagram (also known as an Ishikawa or cause-and-effect diagram) is a visual tool for exploring an issue and identifying its root causes. Product managers and development teams use this template to uncover the "what" and "why" behind a challenge. It can help you work through product-related problems such as lagging performance, slow adoption, or poor user experience.
Included in the fishbone diagram template
This fishbone diagram template includes built-in capabilities such as:
A menu of classic whiteboard features (including sticky notes, grids, and emojis)
Quick access to best practices and a pre-filled fishbone diagram example for guidance
Inline comments to gather feedback, questions, and ideas from teammates
A voting tool to collect confidence votes from collaborators
Shapes you can convert directly into Aha! work records
Presentation frames to easily share your work
How to use the fishbone diagram template
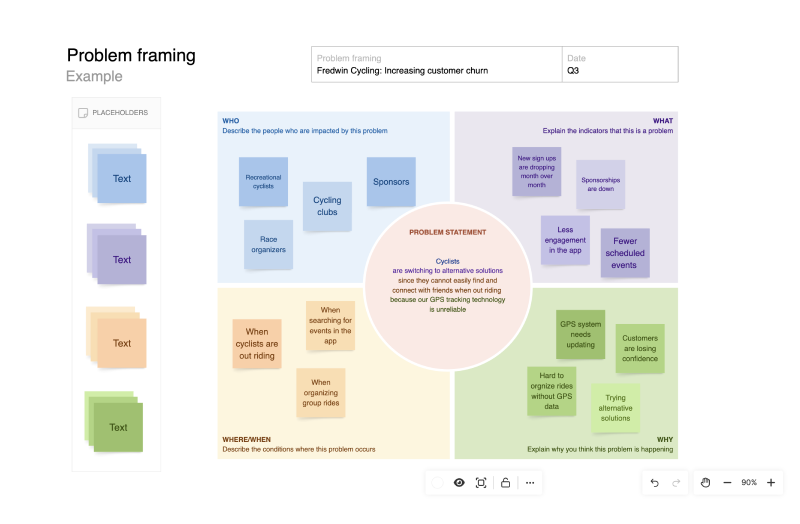
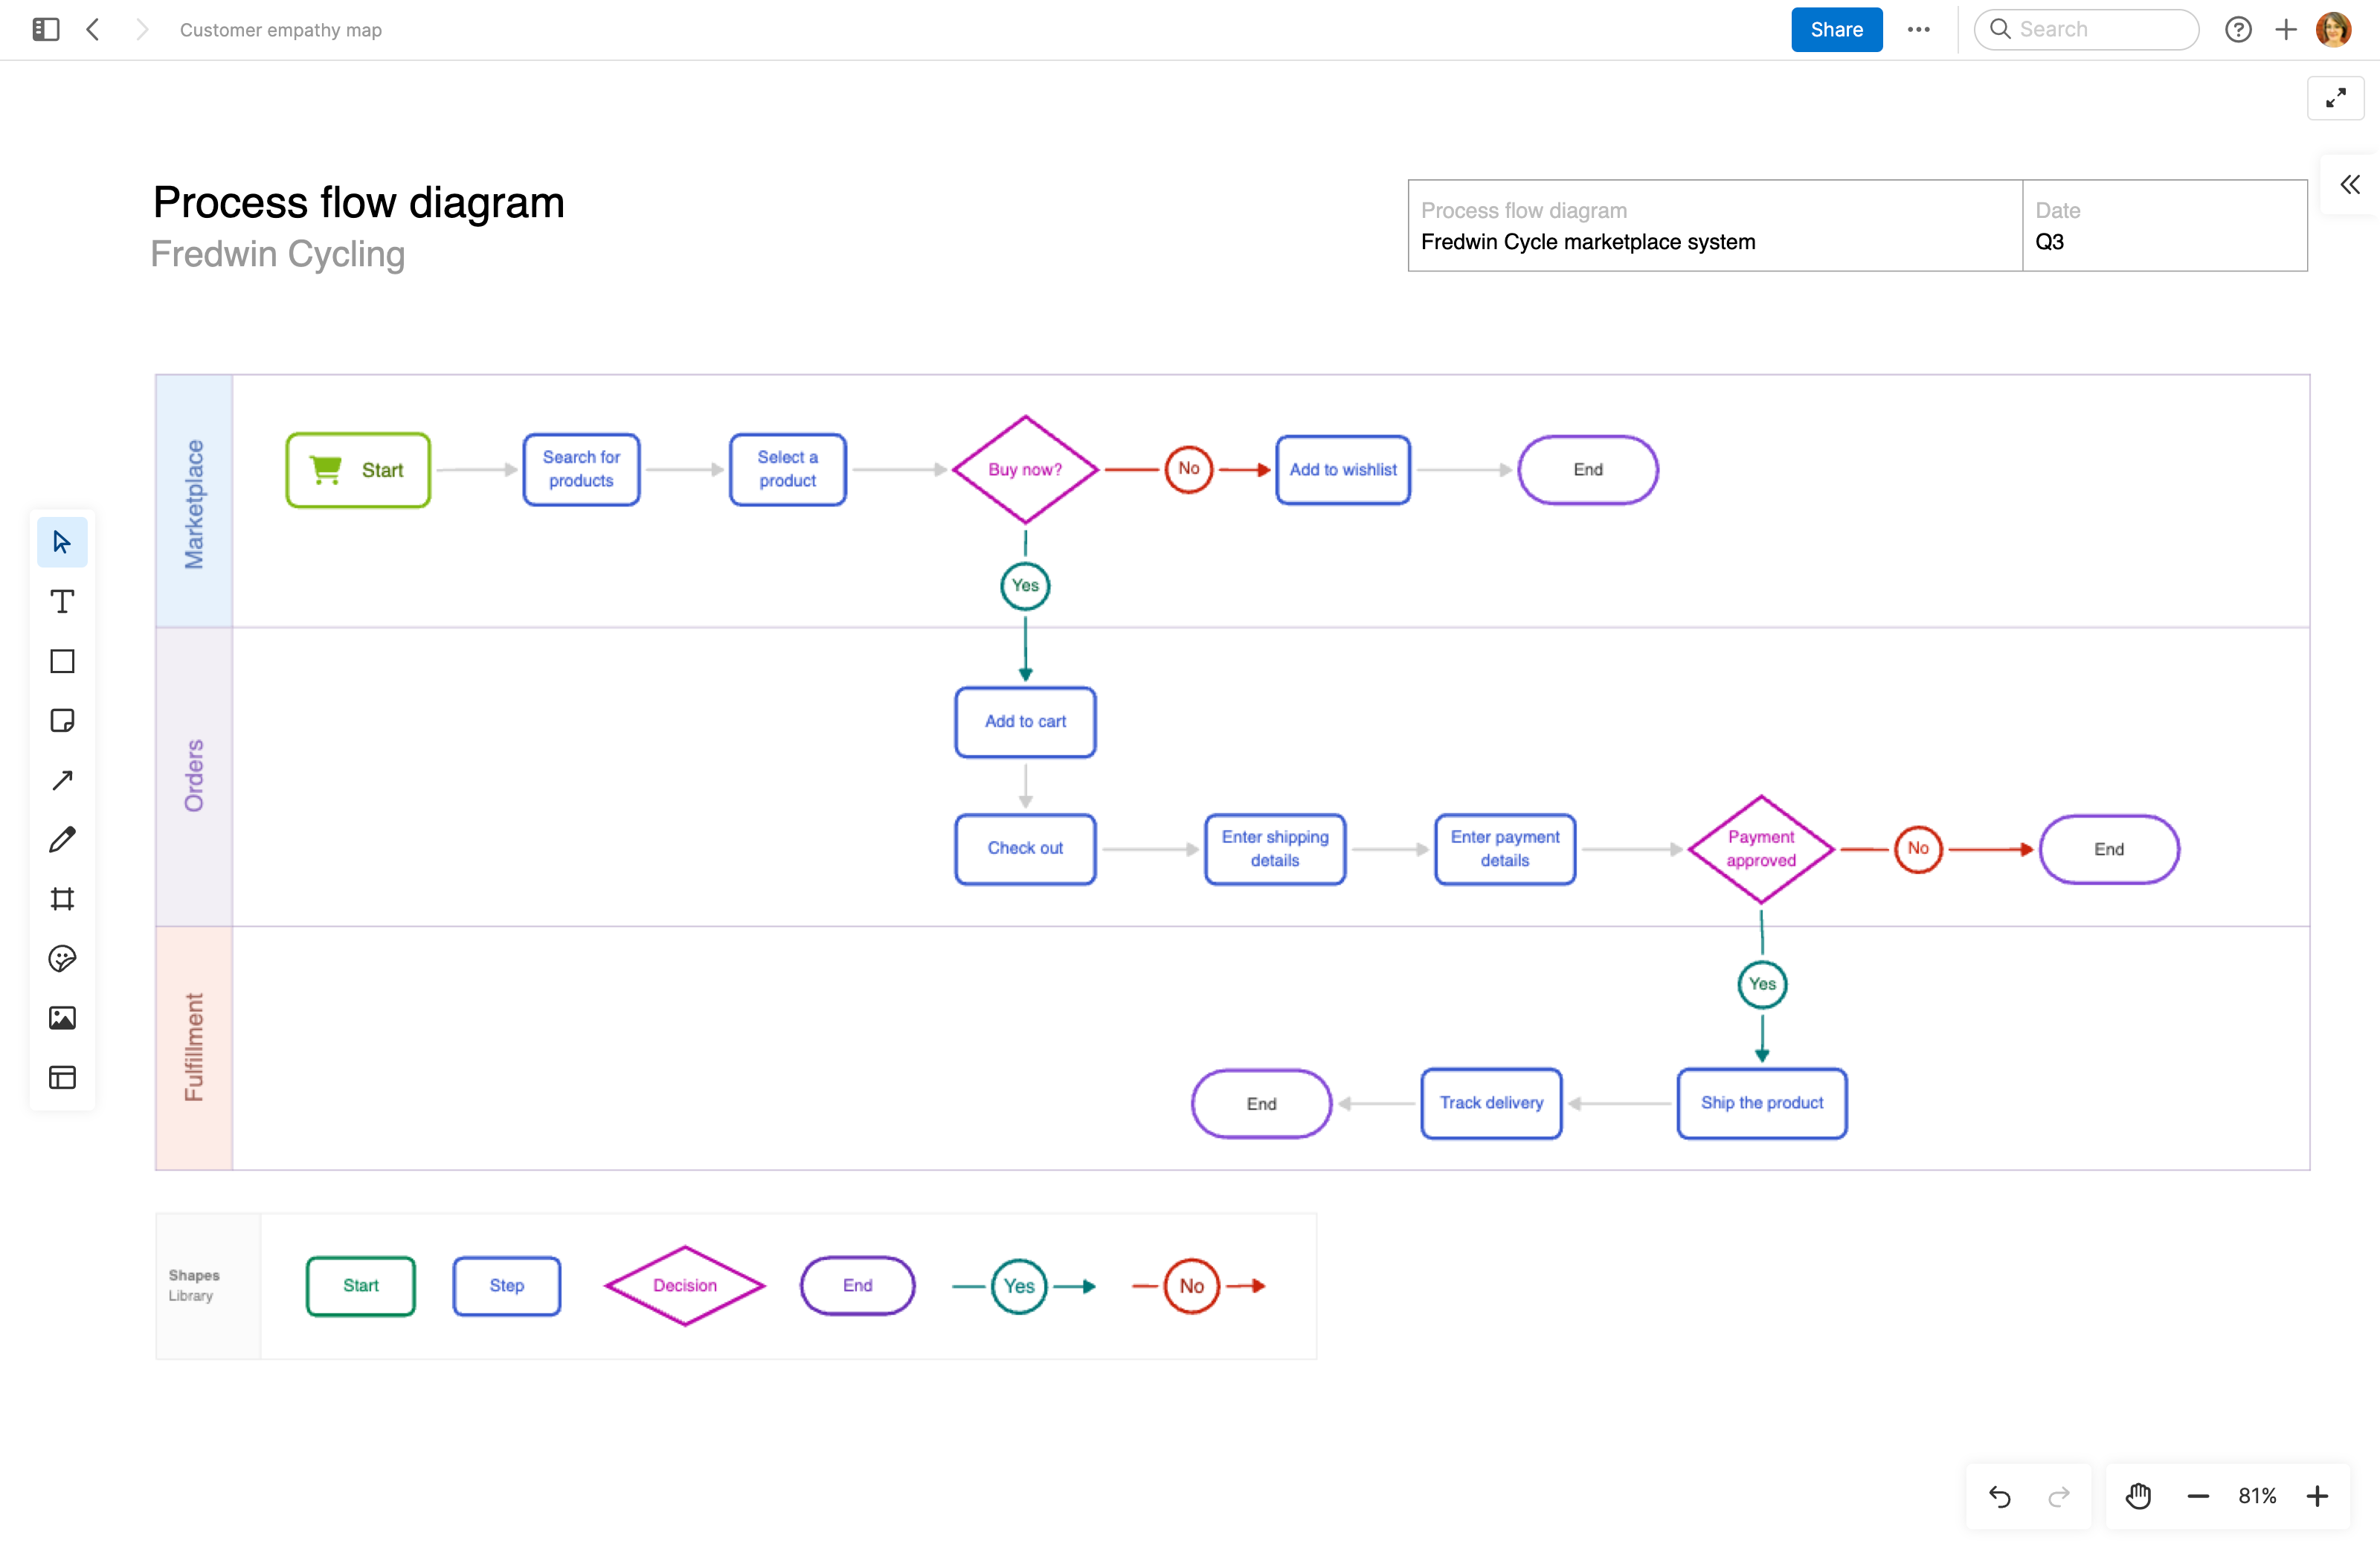
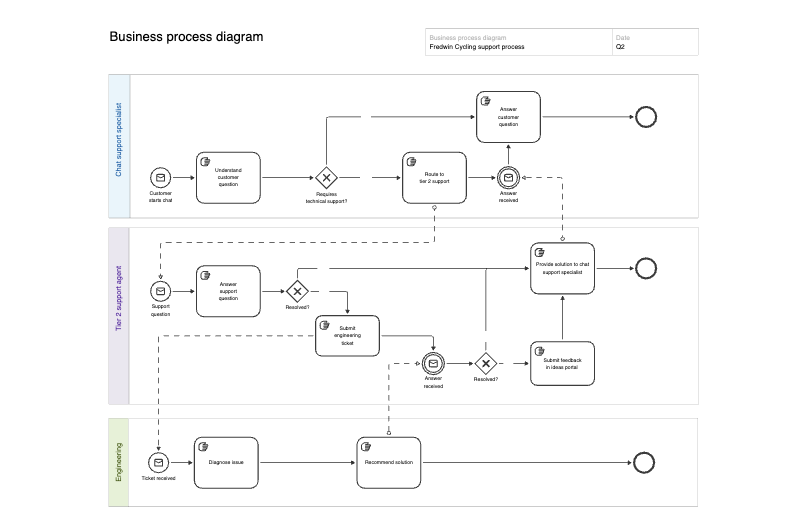
A fishbone diagram helps you break down a problem into the underlying issues that might cause it. The "head" of the fish represents the problem, while the "bones" and "joints" symbolize the broad themes and specific causes.
Typically, product teams organize the diagram thematically around people, process, equipment, materials, and environment. But feel free to adjust the template to suit your own needs.
You can share the whiteboard to invite dialogue with teammates (do this live or asynchronously via inline comments). The process can facilitate better decision-making going forward as you address root causes.
Best practices
Investigate multiple factors to uncover the root causes of product-related problems.
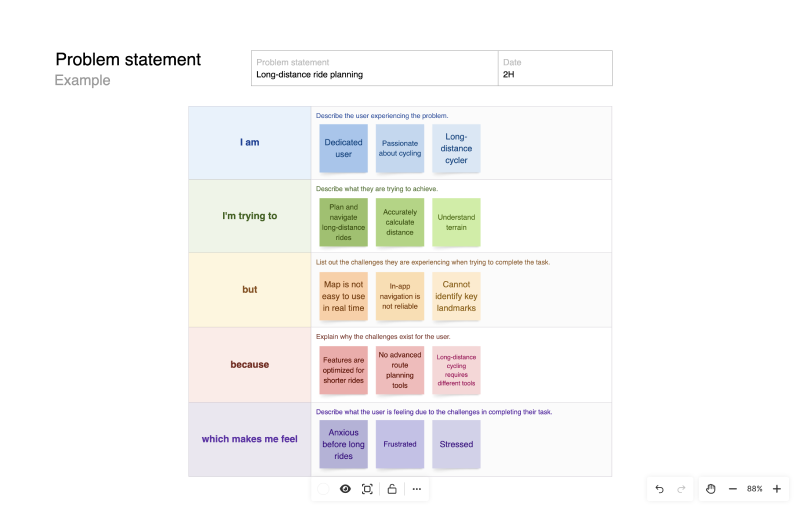
Define the problem: Clearly articulate the issue you need to analyze. Place a problem statement on the template within the fish's head. The more specific, the better.
Add details: Identify major categories that contribute to the problem — such as people, process, equipment, materials, and environment.
Brainstorm causes: For each category, capture specific factors, actions, conditions, or influences that might contribute to the issue.
Explore solutions: Consider the causes you identified and prioritize which ones to address first based on feasibility and impact. Then, discuss next steps with the team.
FAQs about the fishbone diagram template
Why is a fishbone diagram important?
Fishbone diagrams give product teams a structured approach to solving problems. You can use them to identify and clearly communicate potential root causes. This helps the team see the problem's scope and determine which smaller issues to address.
What are some fishbone diagram best practices?
Start at the head of your fish — write the problem you are trying to solve. Then, work backward and outward to fill in the details. Use brainstorming sessions to gather input from relevant teammates on your diagram. And gain consensus by voting on which potential causes to investigate.
How detailed should a fishbone diagram be?
Include only the information you need to explore a problem's root causes (e.g., shipping delays, long response times, and low product inventory). If two bones are similar, consider consolidating them to keep your diagram clean and understandable.
Is this template free to use?
Yes. To use this fishbone diagram template, sign up for a free 30-day trial of Aha! Whiteboards. (You can also try this template in Aha! Roadmaps if you need a complete product management solution.) Easily customize the template to suit your needs, then share it with as many people as you want (for free) to streamline collaboration.