About the data flow diagram
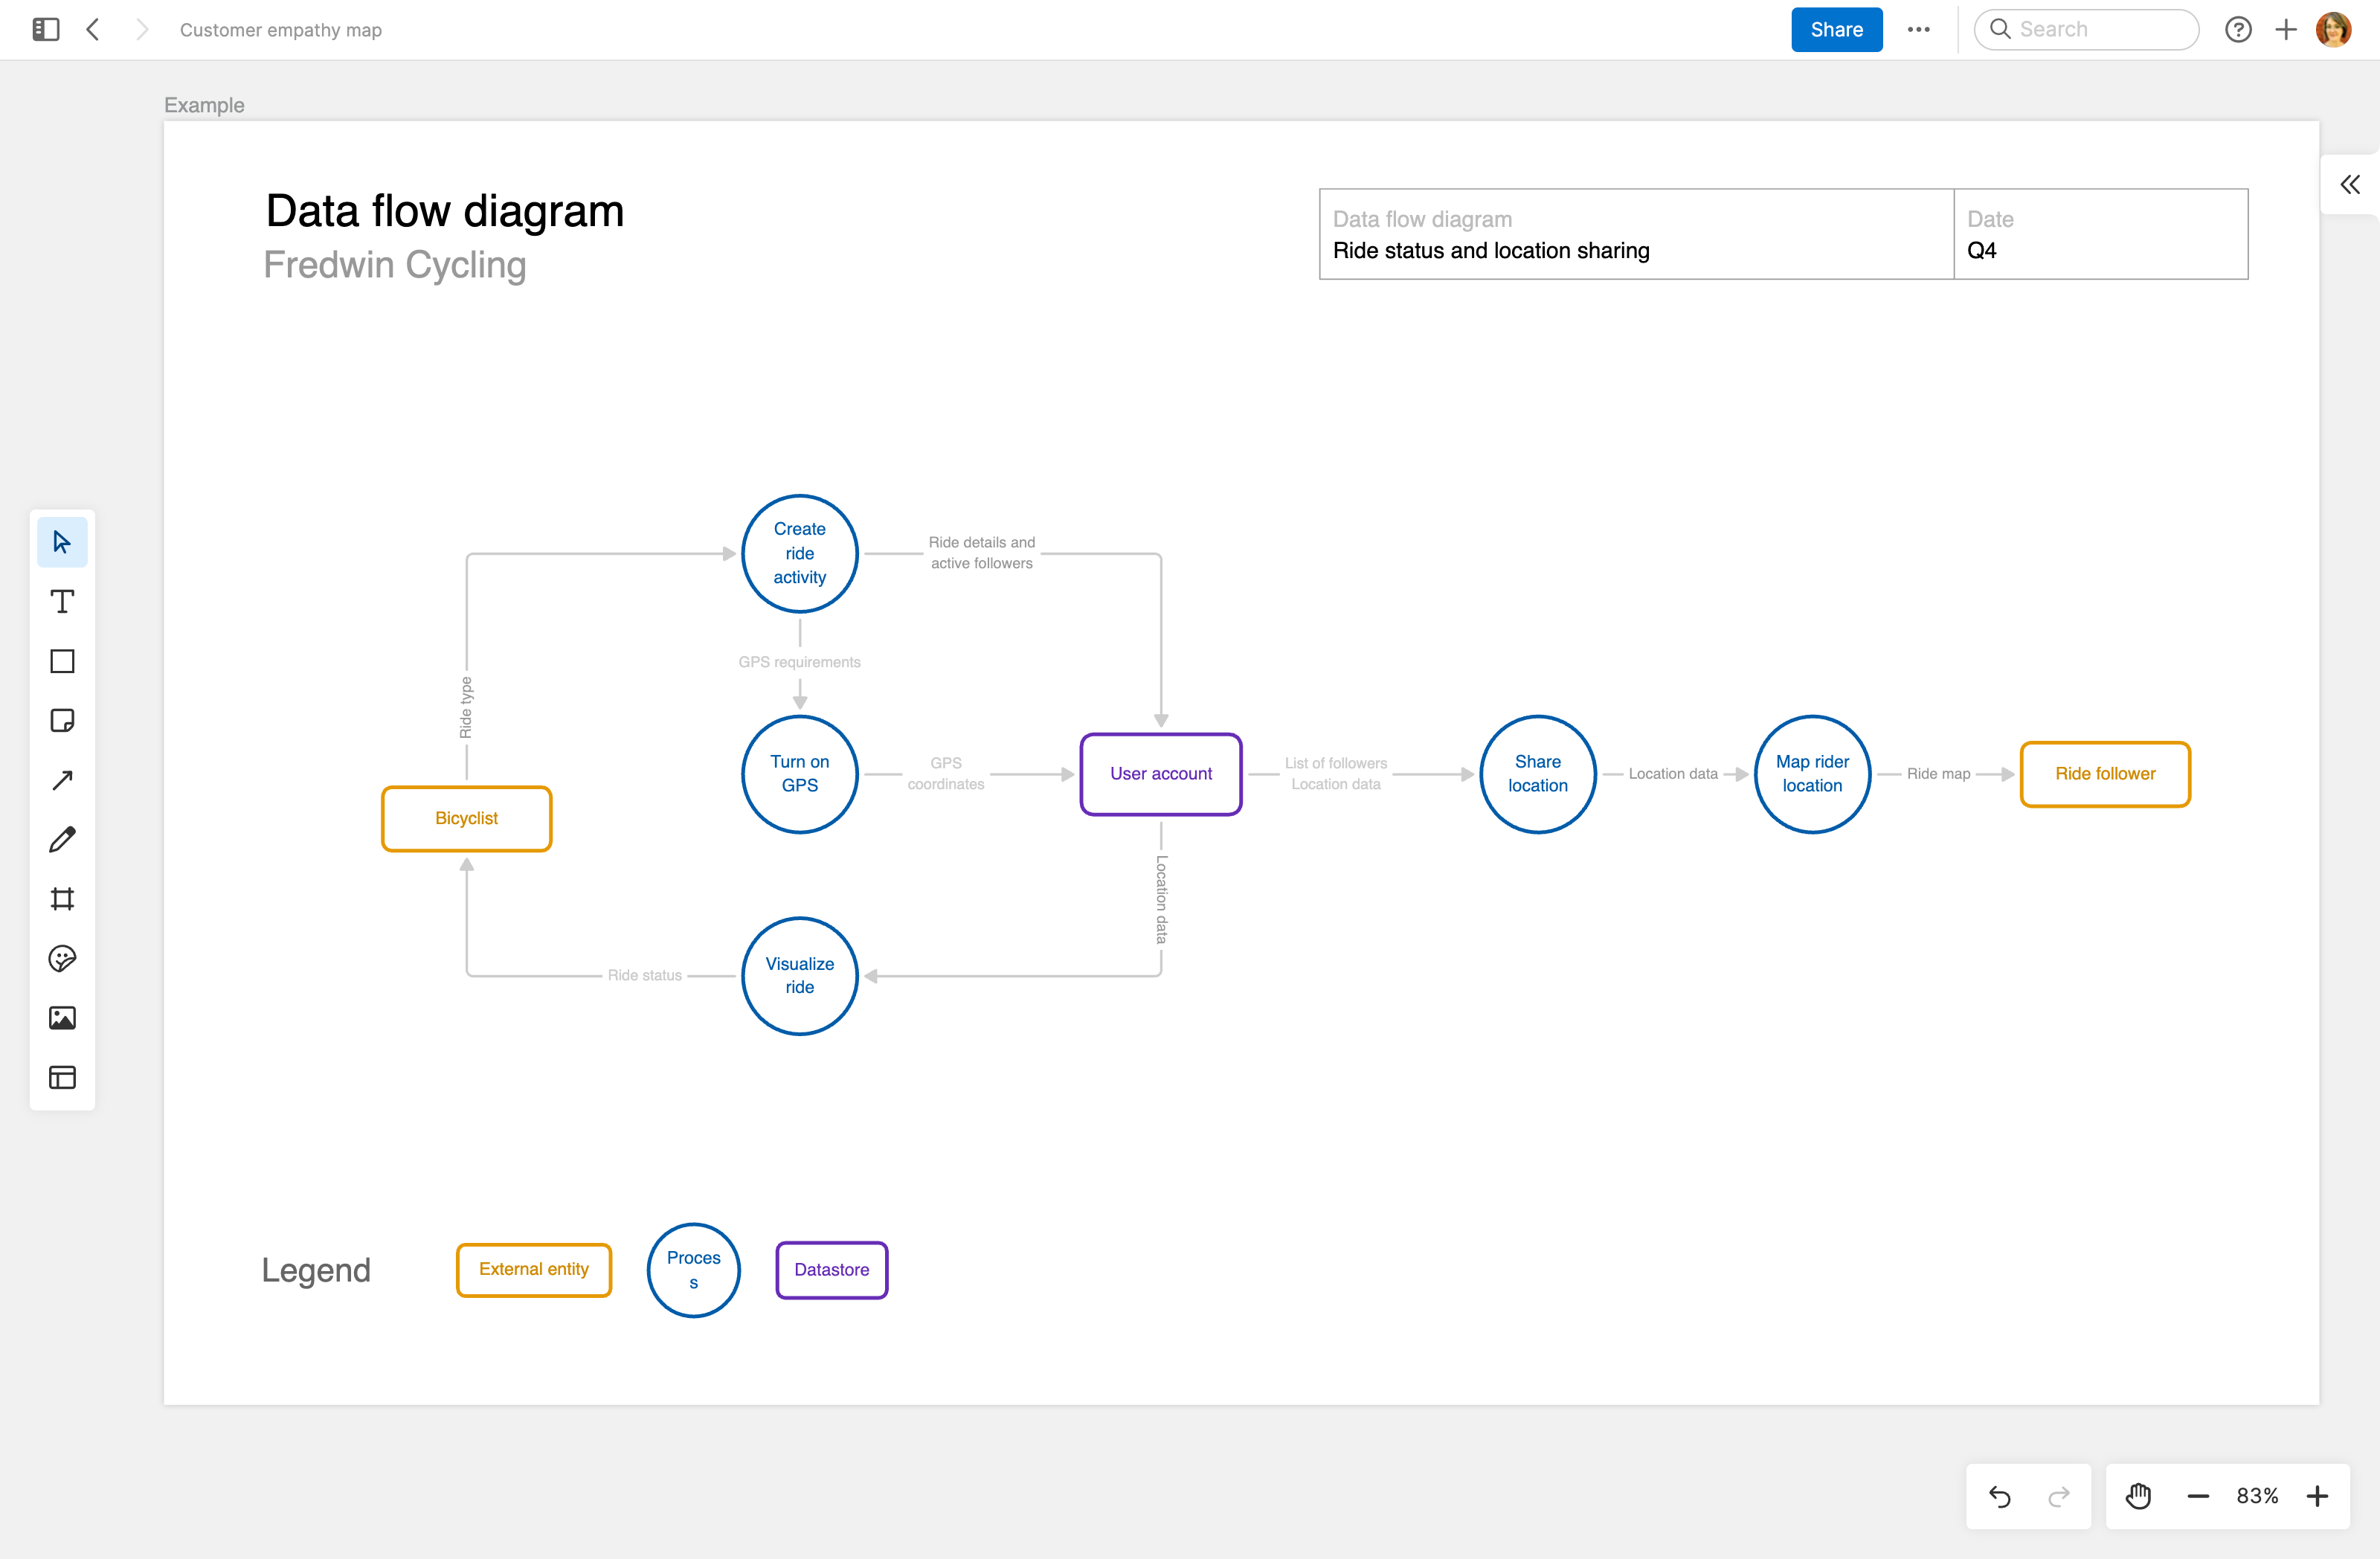
A data flow diagram (DFD) is a visual tool that helps viewers understand how information moves through a system. Product teams use DFDs to illustrate complex system designs or processes so they can identify opportunities to improve. For example, you could use this template to map the journey of a customer order — from placement and billing through accounting and shipping. This can help you refine your designs, uncover inefficiencies, and encourage cross-functional collaboration.
Included in the data flow diagram template
This data flow diagram template includes built-in capabilities such as:
A menu of classic whiteboard features (including shapes, sticky notes, grids, and emojis)
Quick access to best practices and a pre-filled data flow diagram for guidance
Inline comments to gather feedback, questions, and ideas from teammates
Presentation frames to easily share your document
How to use the data flow diagram template
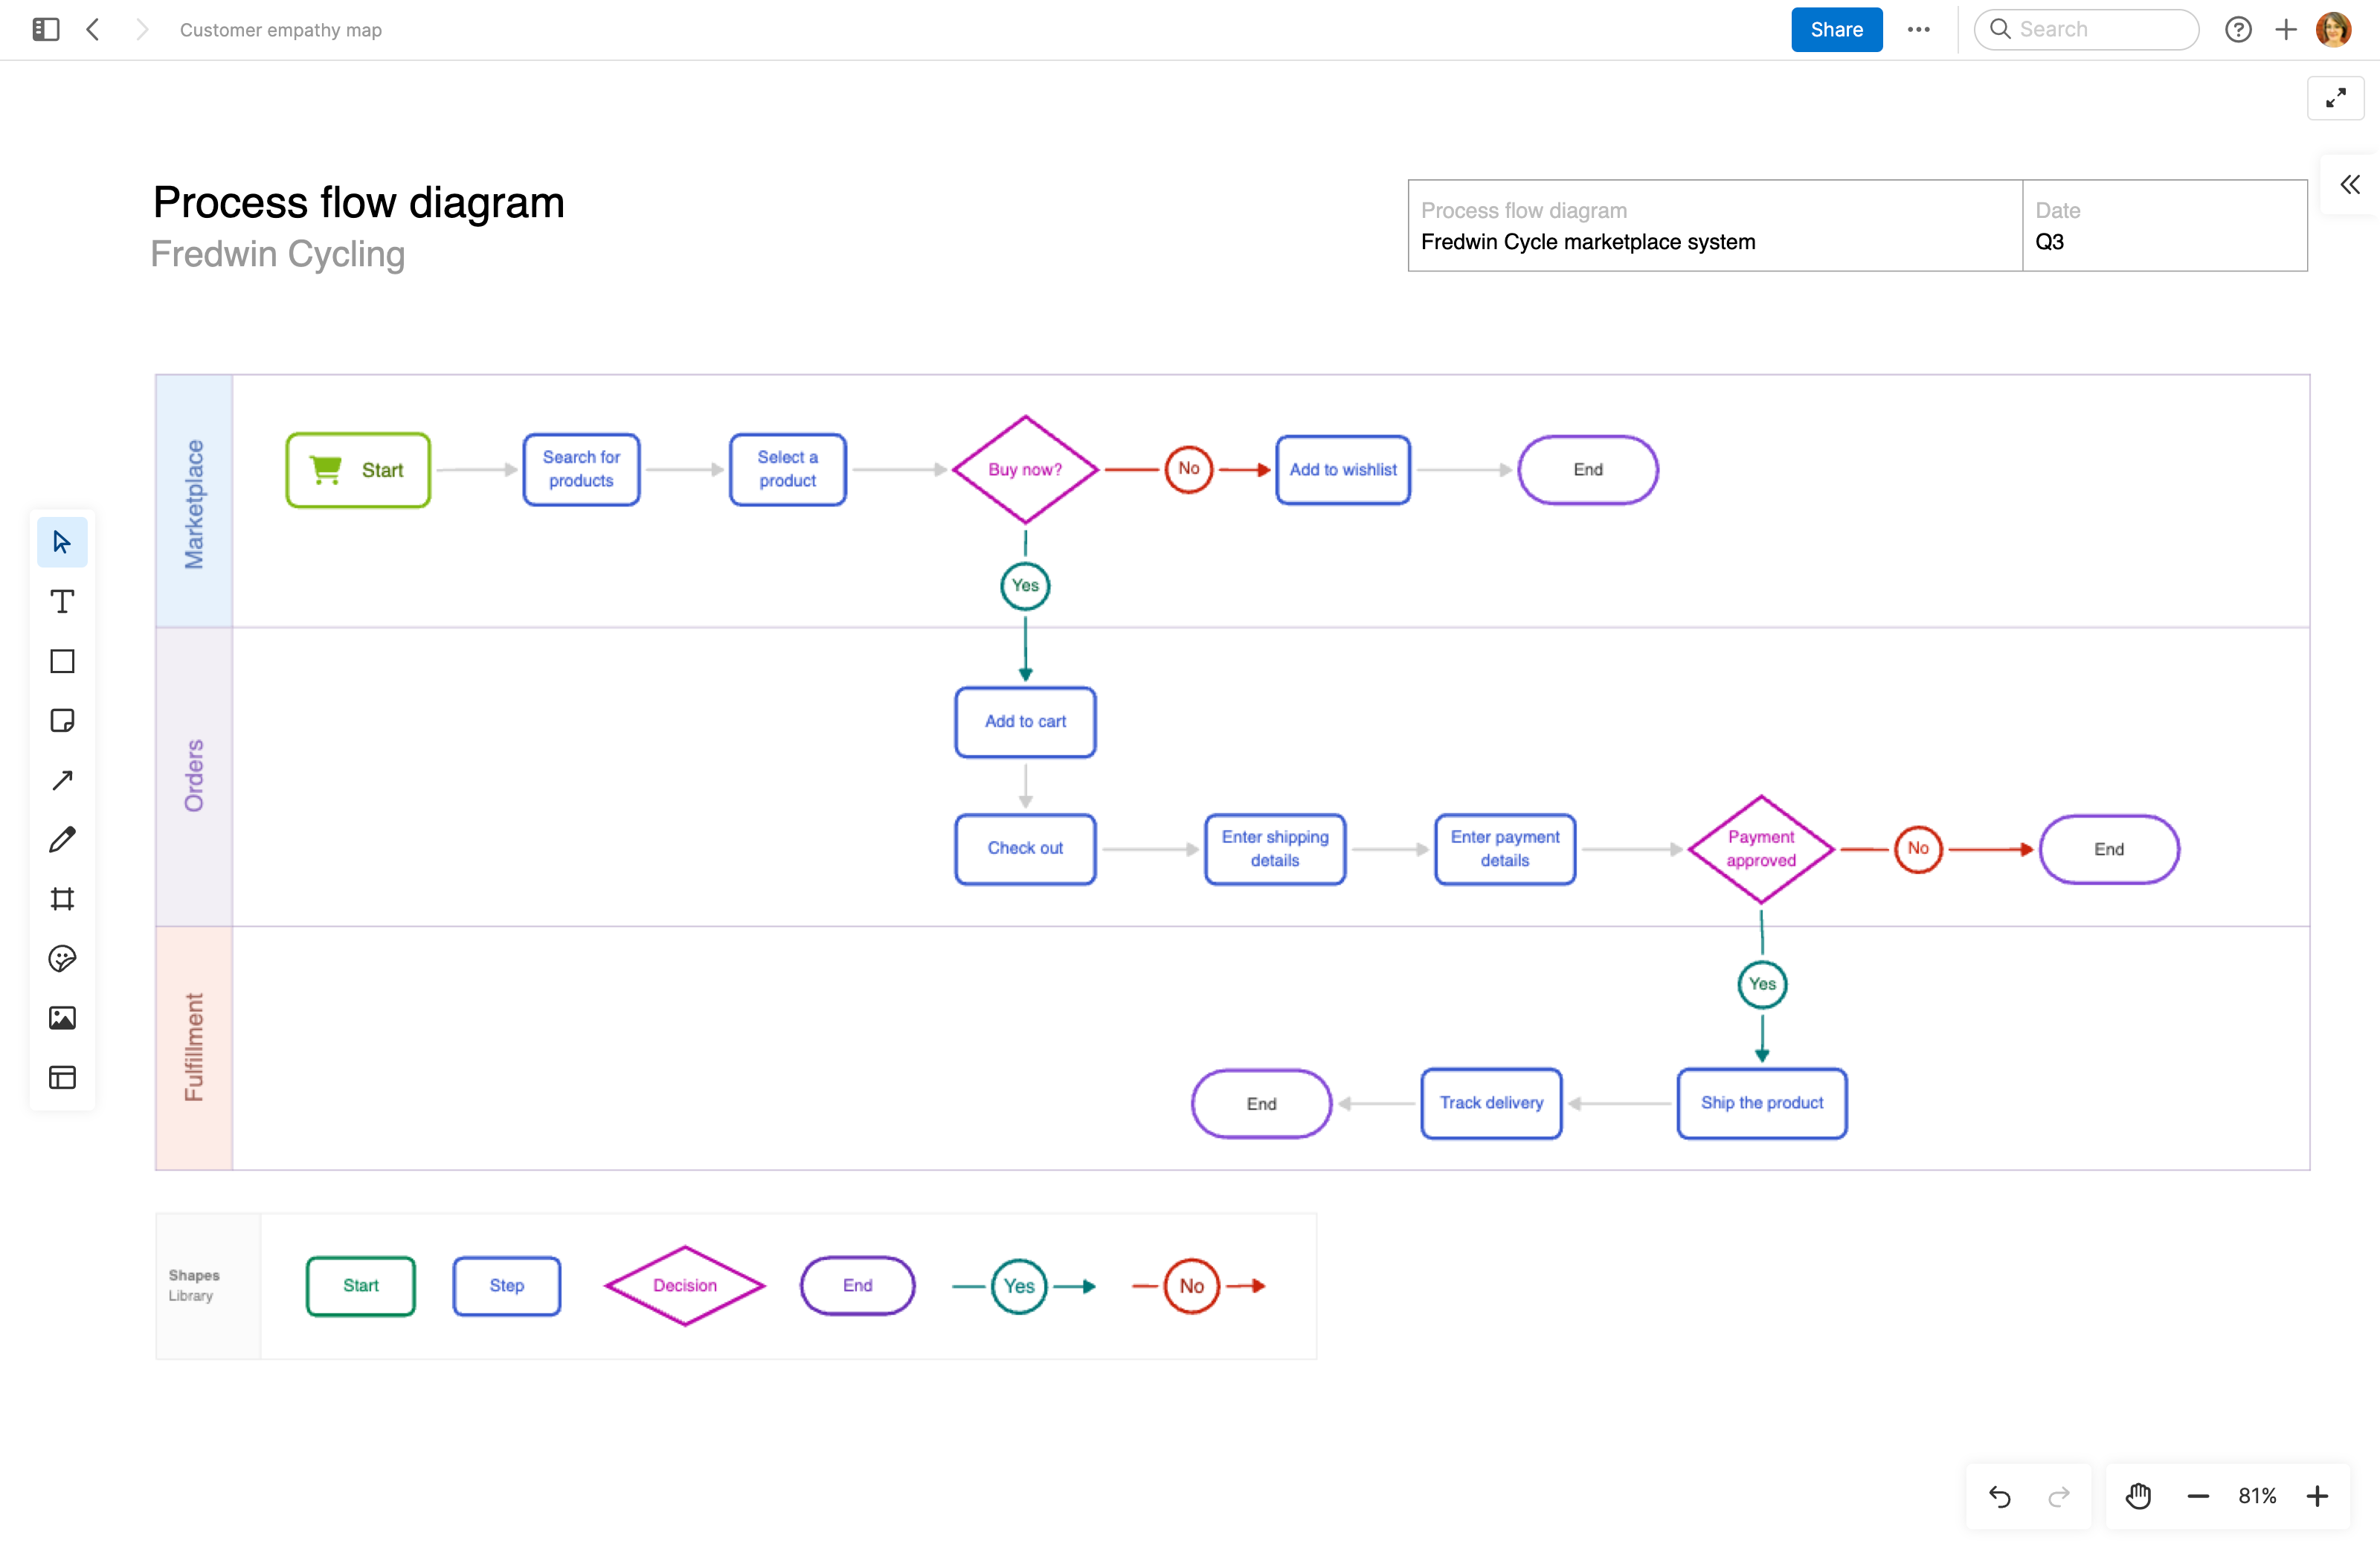
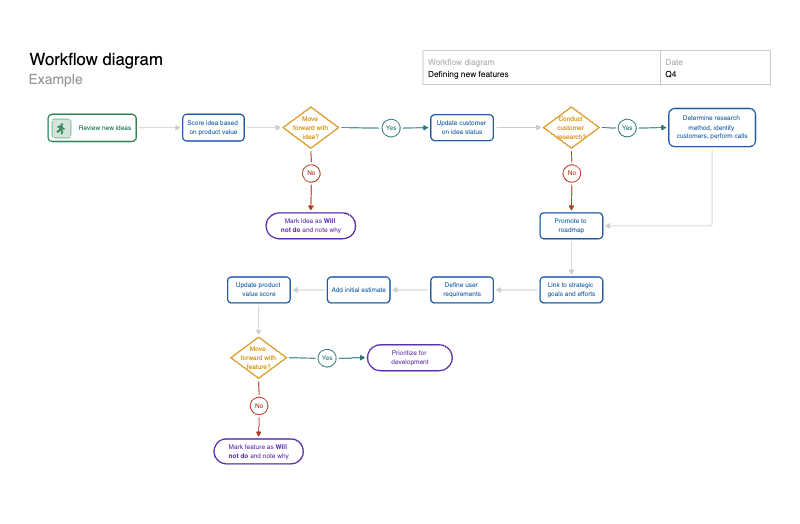
Data flow diagrams make it easier to understand and analyze how information flows through complex systems. There are usually four components in a DFD:
Processes: These represent the activities in the system that take in inputs, perform operations, and produce outputs
Data flows: These arrows depict the movement of data from one process to another, or between processes and data stores
Data stores: These data repositories store information for later retrieval or use
External entities: These can be people, other systems, or external data sources
Use consistent symbols and arrows in this whiteboard template to visualize the four components above. Real-time drafting means you can collaborate with cross-functional teams to add steps or modify the diagram together.
Best practices
Visually represent a process or system's high-level structure and data dependencies.
Identify scope: Decide exactly what system or process you will model and determine the relevant data to include
Visualize data flow: Use a consistent set of symbols. (These are included in the template, but you can customize them if you wish). Mark processes, data stores, and external entities to illustrate how information moves through the system in a logical order.
Keep it simple: Minimize the number of processes and data flows represented on your diagram to reduce complexity. Group related processes together, label all elements, and add color.
Validate accuracy: Review your data flow diagram with subject matter experts. Incorporate any feedback to make sure you are correctly showing how data flows through a process or system.
FAQs about the data flow diagram template
Why are data flow diagrams important?
A data flow diagram (DFD) is a visualization of how information moves through a system. Illustrating this helps everyone understand processes and identify inefficiencies or bottlenecks. This is especially important for gaining stakeholder alignment when teams design or improve systems.
What are some data flow diagram best practices?
Start with a high-level view of your system, then break it down into smaller components. Use consistent symbols and labeling as you go. Review the diagram with teammates to make sure it accurately represents the system or process you are analyzing.
Who is the data flow diagram template for?
This template is built for product managers, business analysts, developers, and designers. It is particularly useful when product teams plan or refine technical processes.
Is this template free to use?
Yes. To use this data flow diagram template, sign up for a free 30-day trial of Aha! Whiteboards. (You can also try this template in Aha! Roadmaps if you need a complete product management solution.) Easily customize the template to suit your needs, then share it with as many people as you want (for free) to streamline collaboration.