Just Launched! — Share Your Product KPIs via a Dashboard


"Groundbreaking." "Time-saving and fun!" These are just a few of the ways Aha! customers have described the new reporting dashboards. We love hearing about how pleased many of you are with this new functionality — you love being able to visualize your product plans and progress in one place. Now it is time to share these beautiful views you have been busy creating.
You can now share dashboards as webpages, presentations, and PDF or PNG files.
You can add nearly any report to a dashboard as a panel and arrange the layout to bring your KPIs together in one place. Along with sharing, we also added a legend option to dashboard panels so you can specify the data points displayed in your charts, pivot tables, and custom roadmaps.
Need a refresher on where to begin? Start here:
Build a dashboard
Go to the dashboard overview. Create one then add panels to showcase your progress and plans — from charts to custom roadmaps. Refine your view to bring important metrics into focus. You can arrange the panel layout and edit panel views, titles, and add legends as shown in the example below.
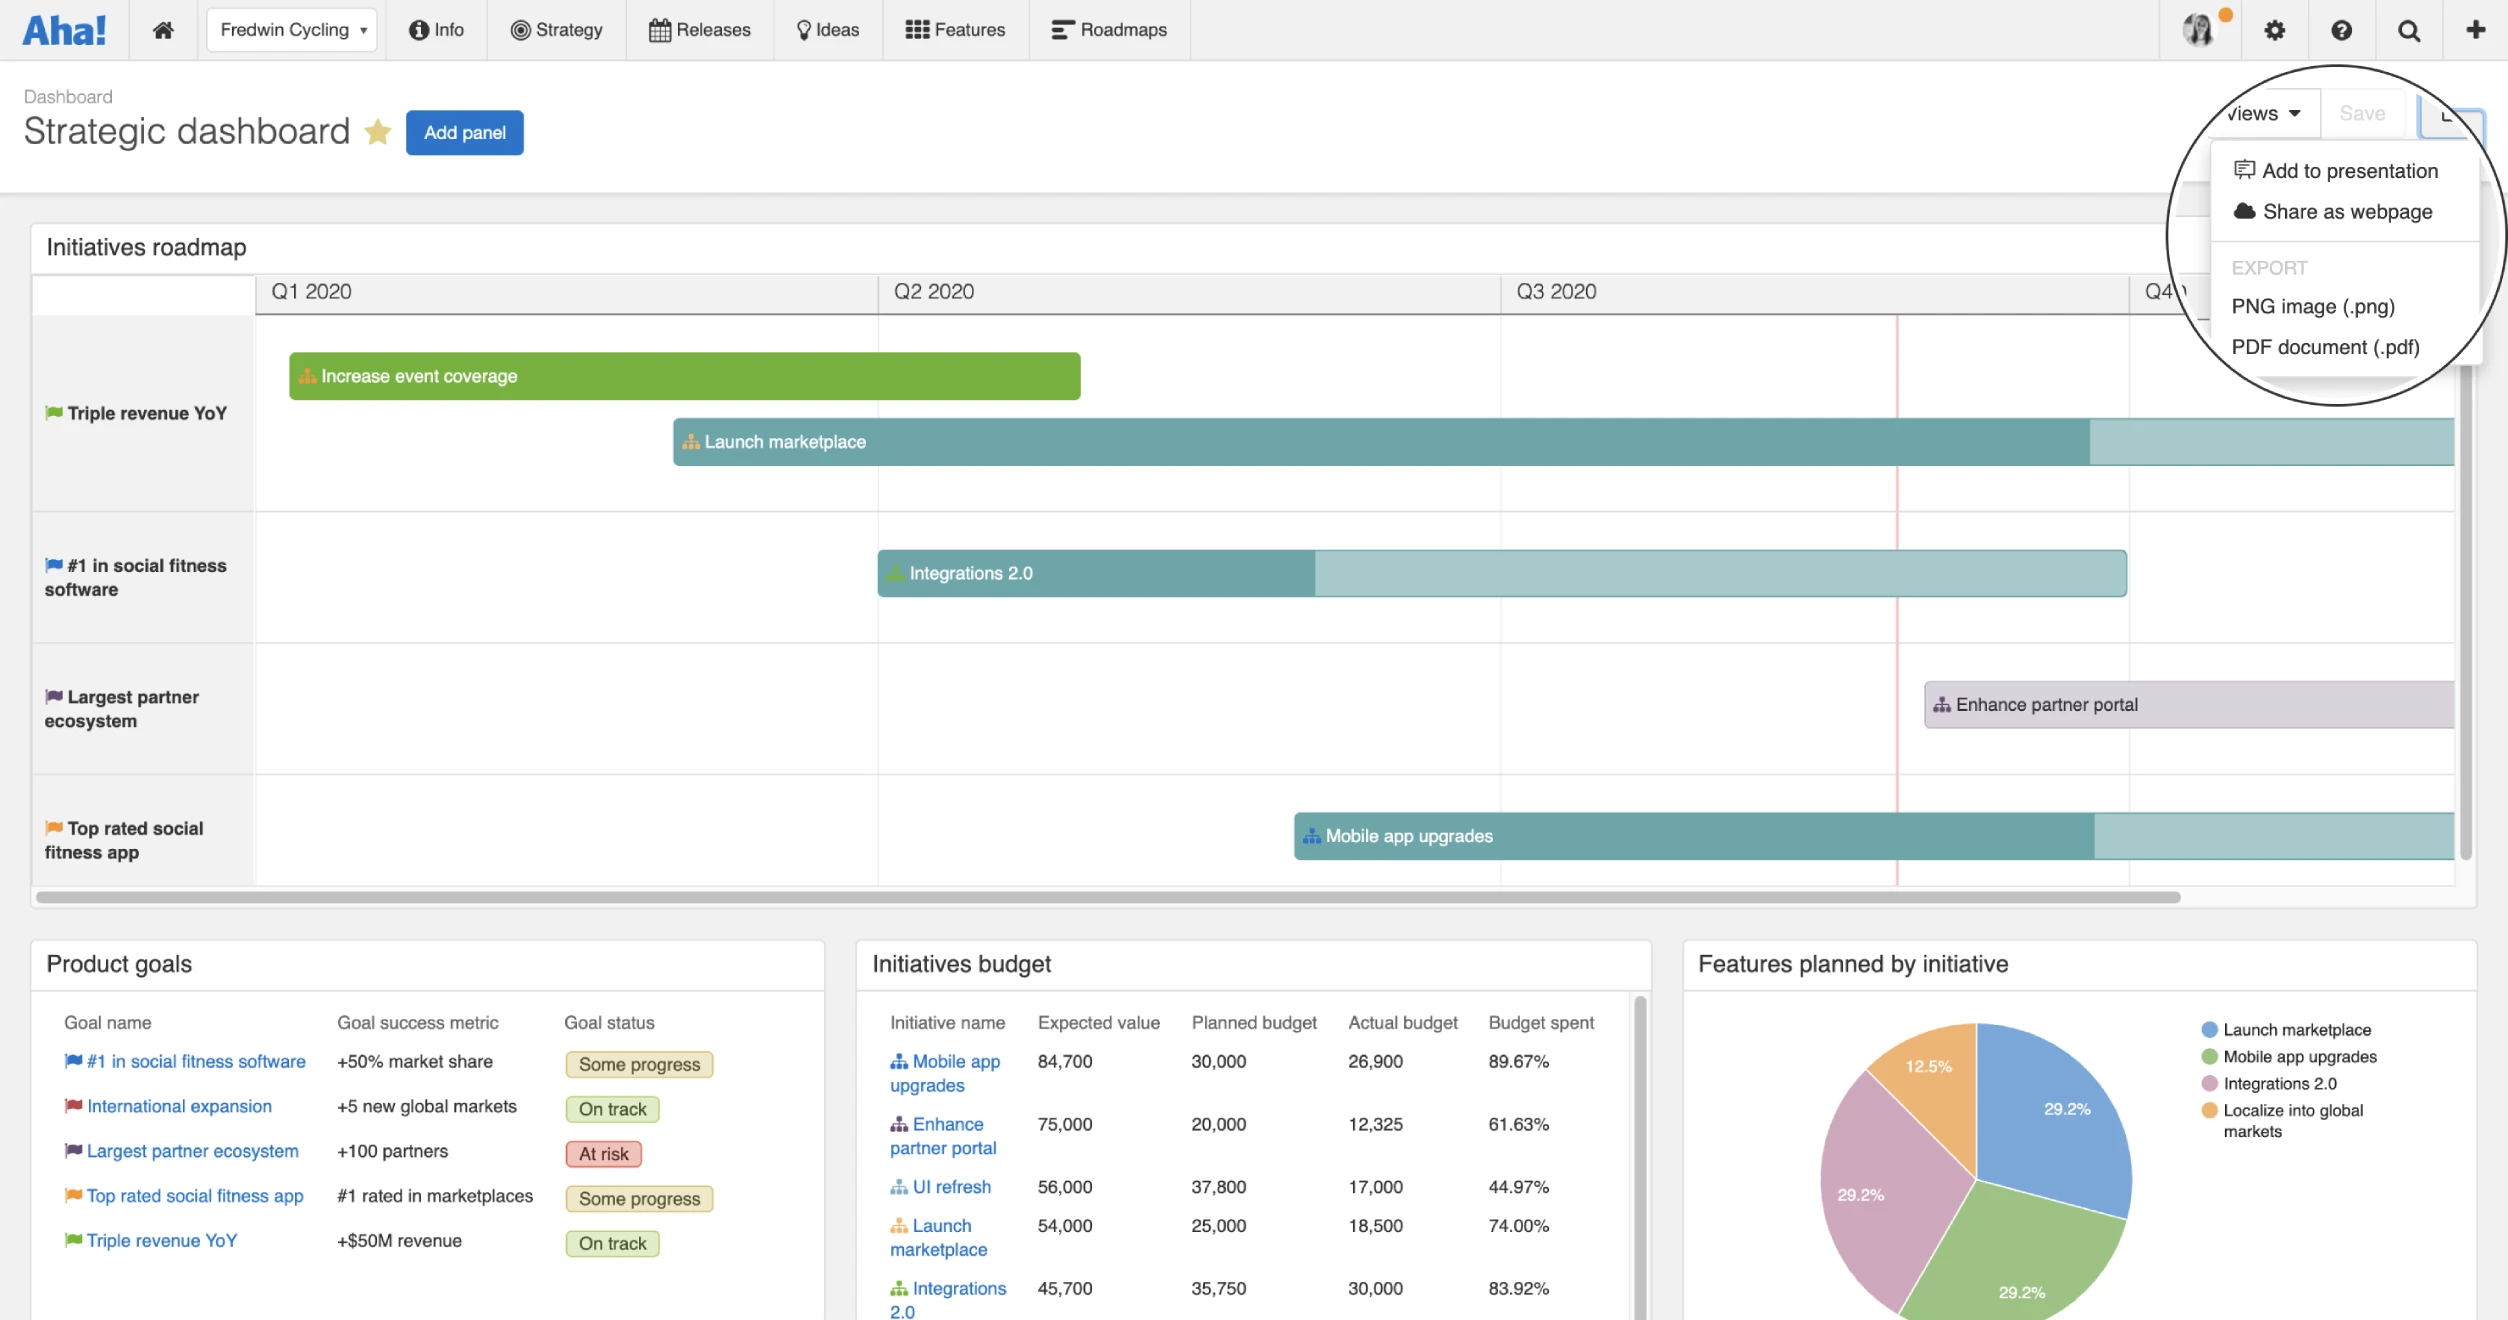
Choose how to share it
You now have a few different options. You can include your dashboard as a slide in an Aha! presentation, add it to a secure webpage, export it as a PDF or PNG file, or embed it in other tools, such as Confluence. Only the creator of the dashboard can share it as a webpage. Account administrators can enable webpage sharing in account settings. In the example below, we created a webpage link.
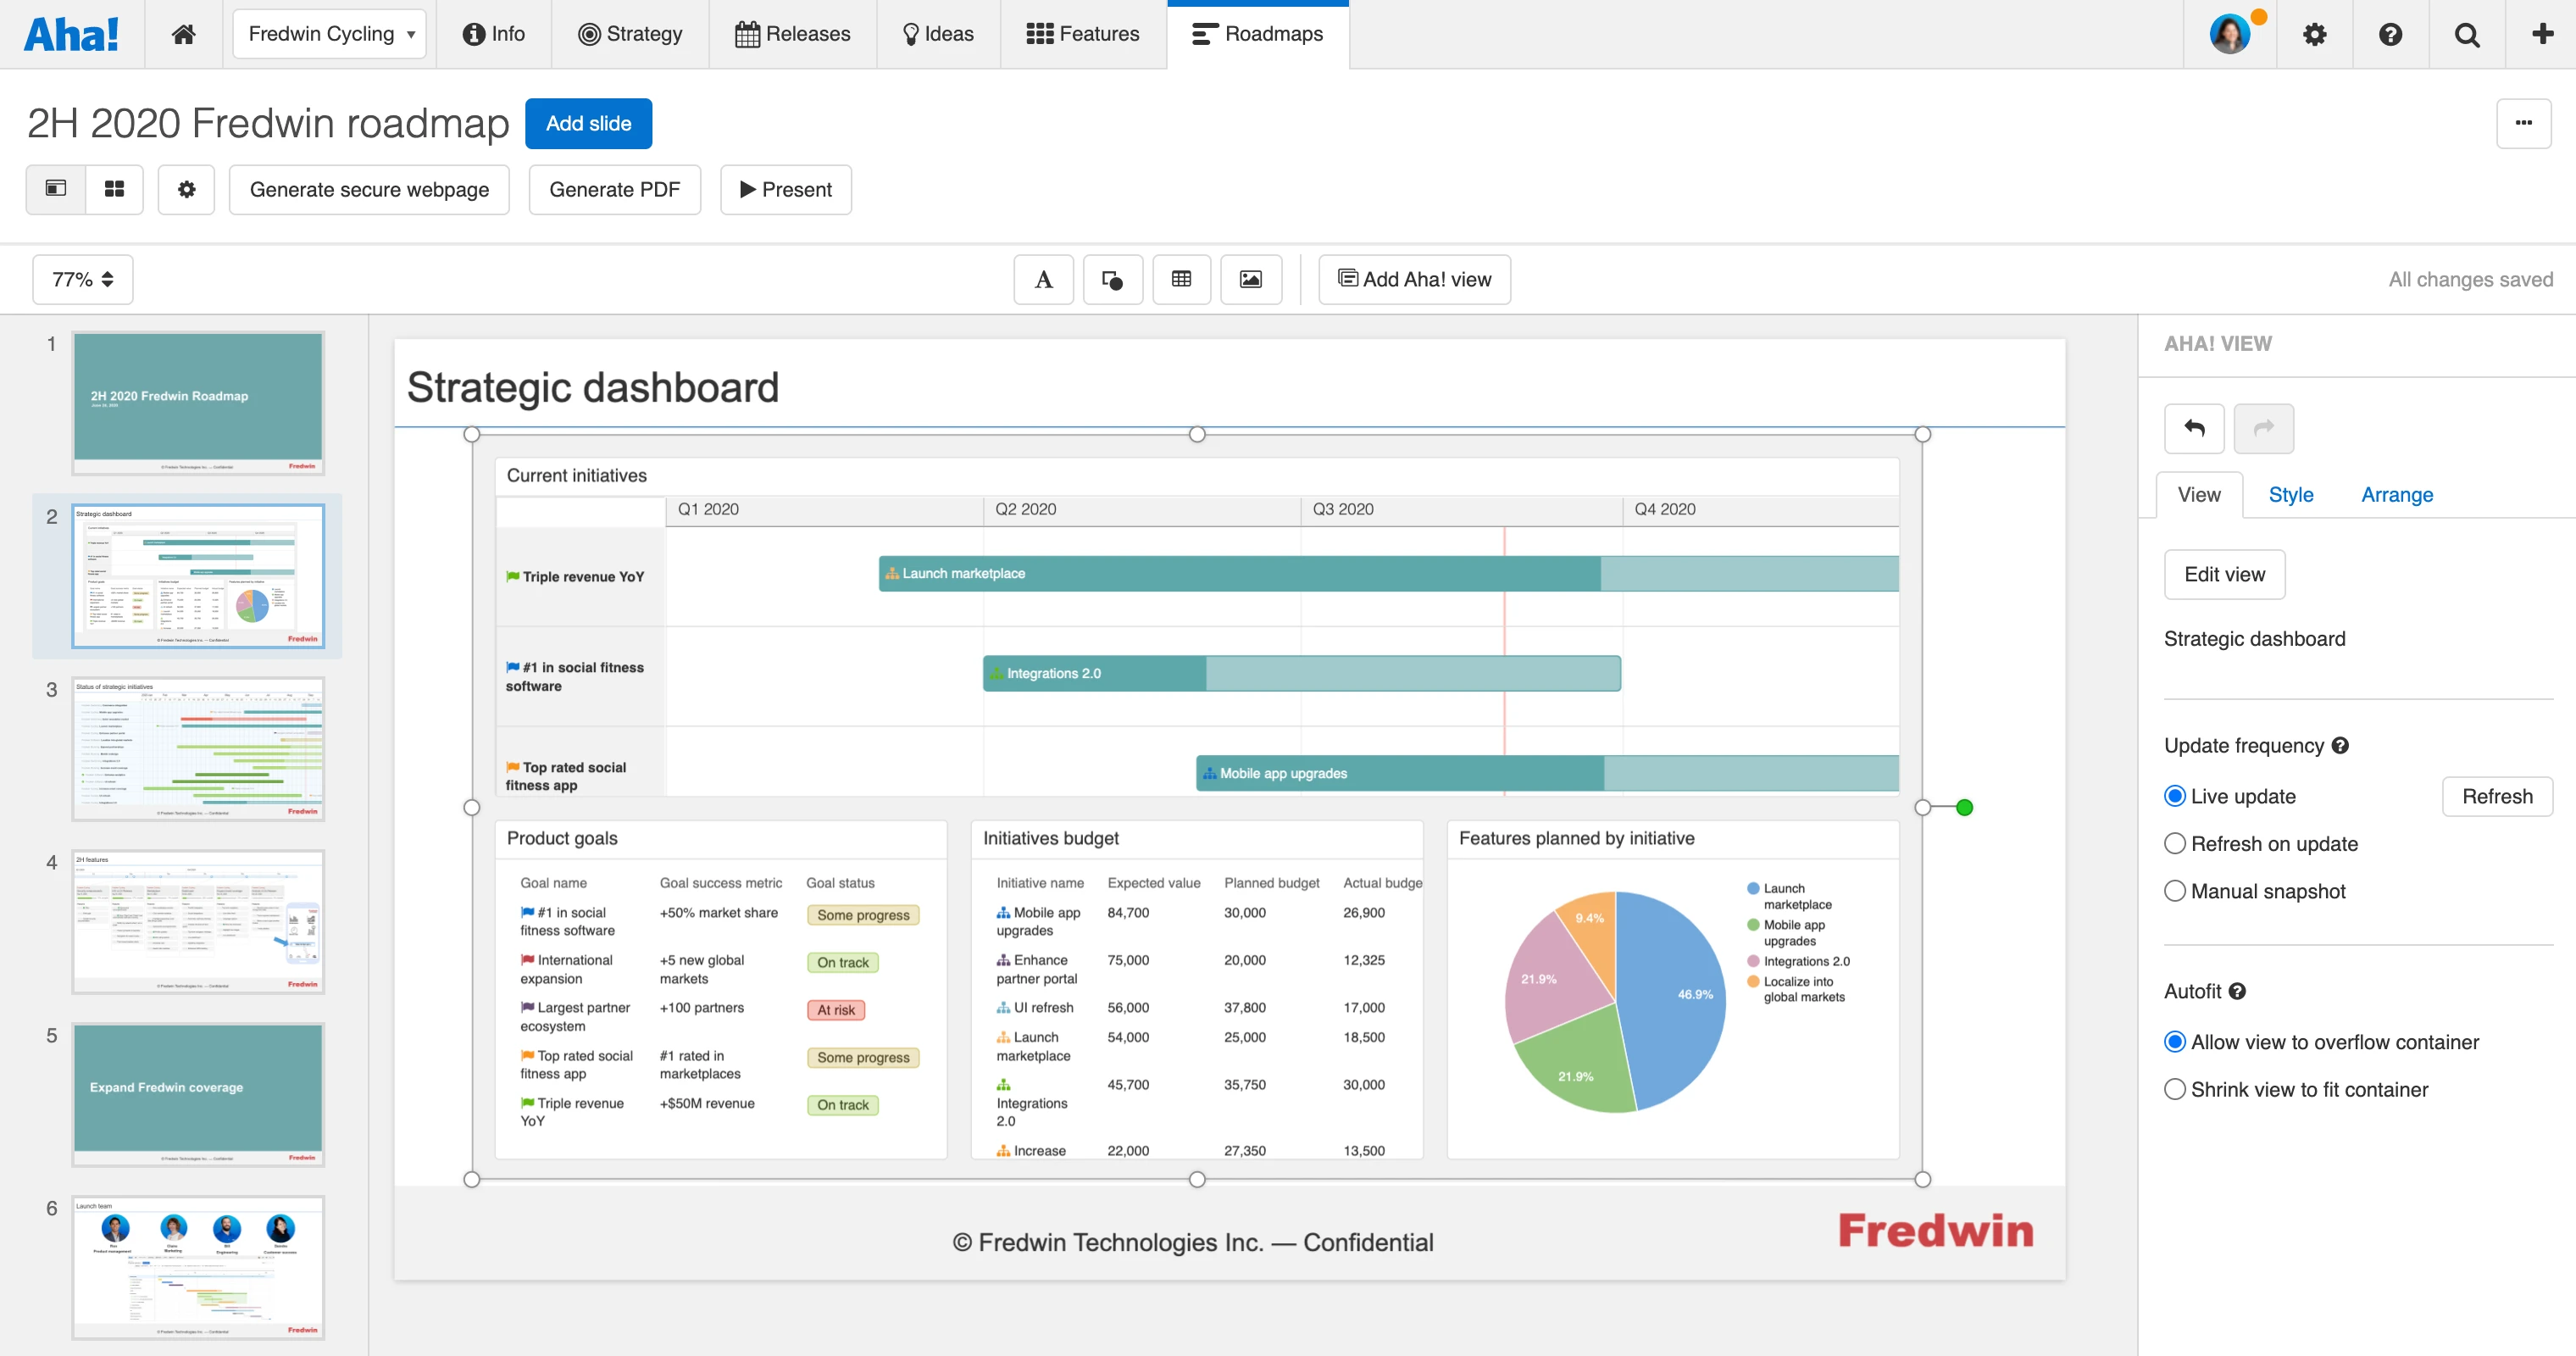
Present your product KPIs
Including a dashboard in a presentation is a great way to share your KPIs in the context of your roadmap story. Each report panel in your dashboard slide is directly connected to your product data. And you can choose between a live view or refresh on update. So as soon as your team makes progress, the data shown on the dashboard will show the latest.
Centralizing your product data is a powerful way to keep the team motivated and informed.
To learn more about how you can use dashboards to track key metrics, register to join our live tutorial on September 16, 2020. Aha! product expert Rose Thompson will show you how to build essential dashboards for strategy, feature delivery, and idea management.
Sign up for a free Aha! trial — be happy
Dashboards are available to all Aha! customers. If you are not already an Aha! customer, you may want to sign up for a free 30-day trial or join a live demo to see why more than 300,000 users trust Aha! to build lovable products.