Just Launched! — New Reporting Dashboards for Tracking Product and Project KPIs


Product managers need to track lots of data and report on the team's success. That is why Aha! comes with a powerful analytics engine and more than 75 example reports. You can capture all of your product data in one place and build the exact report you need. But you often need more than just one report to gauge real progress. So we are excited to unveil new interactive dashboards in Aha! — now you can see all your KPIs in one view.
You can now view multiple reports in a single, interactive dashboard.
You can include any saved custom roadmap, list report, pivot table, or chart as a panel. When you do, a copy will be made of the saved view. This is intentional — so you can edit the filters and styling on either the original report or the panel without impacting each other. Add up to 20 panels and arrange the layout using drag and drop.
When you are ready to share your dashboard with teammates, give it a title and select which parent lines or workspaces you want to make it available in. This way, you can control access based on a user's workspace permissions.
You can report on just about anything and organize your panels any way you want. Here are just a few ways you can get started with dashboards:
Monitor strategic gains
See how you are doing against your strategy. The dashboard below provides an overview of KPIs — such as the status of goals, financial metrics, features planned by initiative, and percent of work completed. Now you can quickly evaluate the progress of major business investments in a single view.
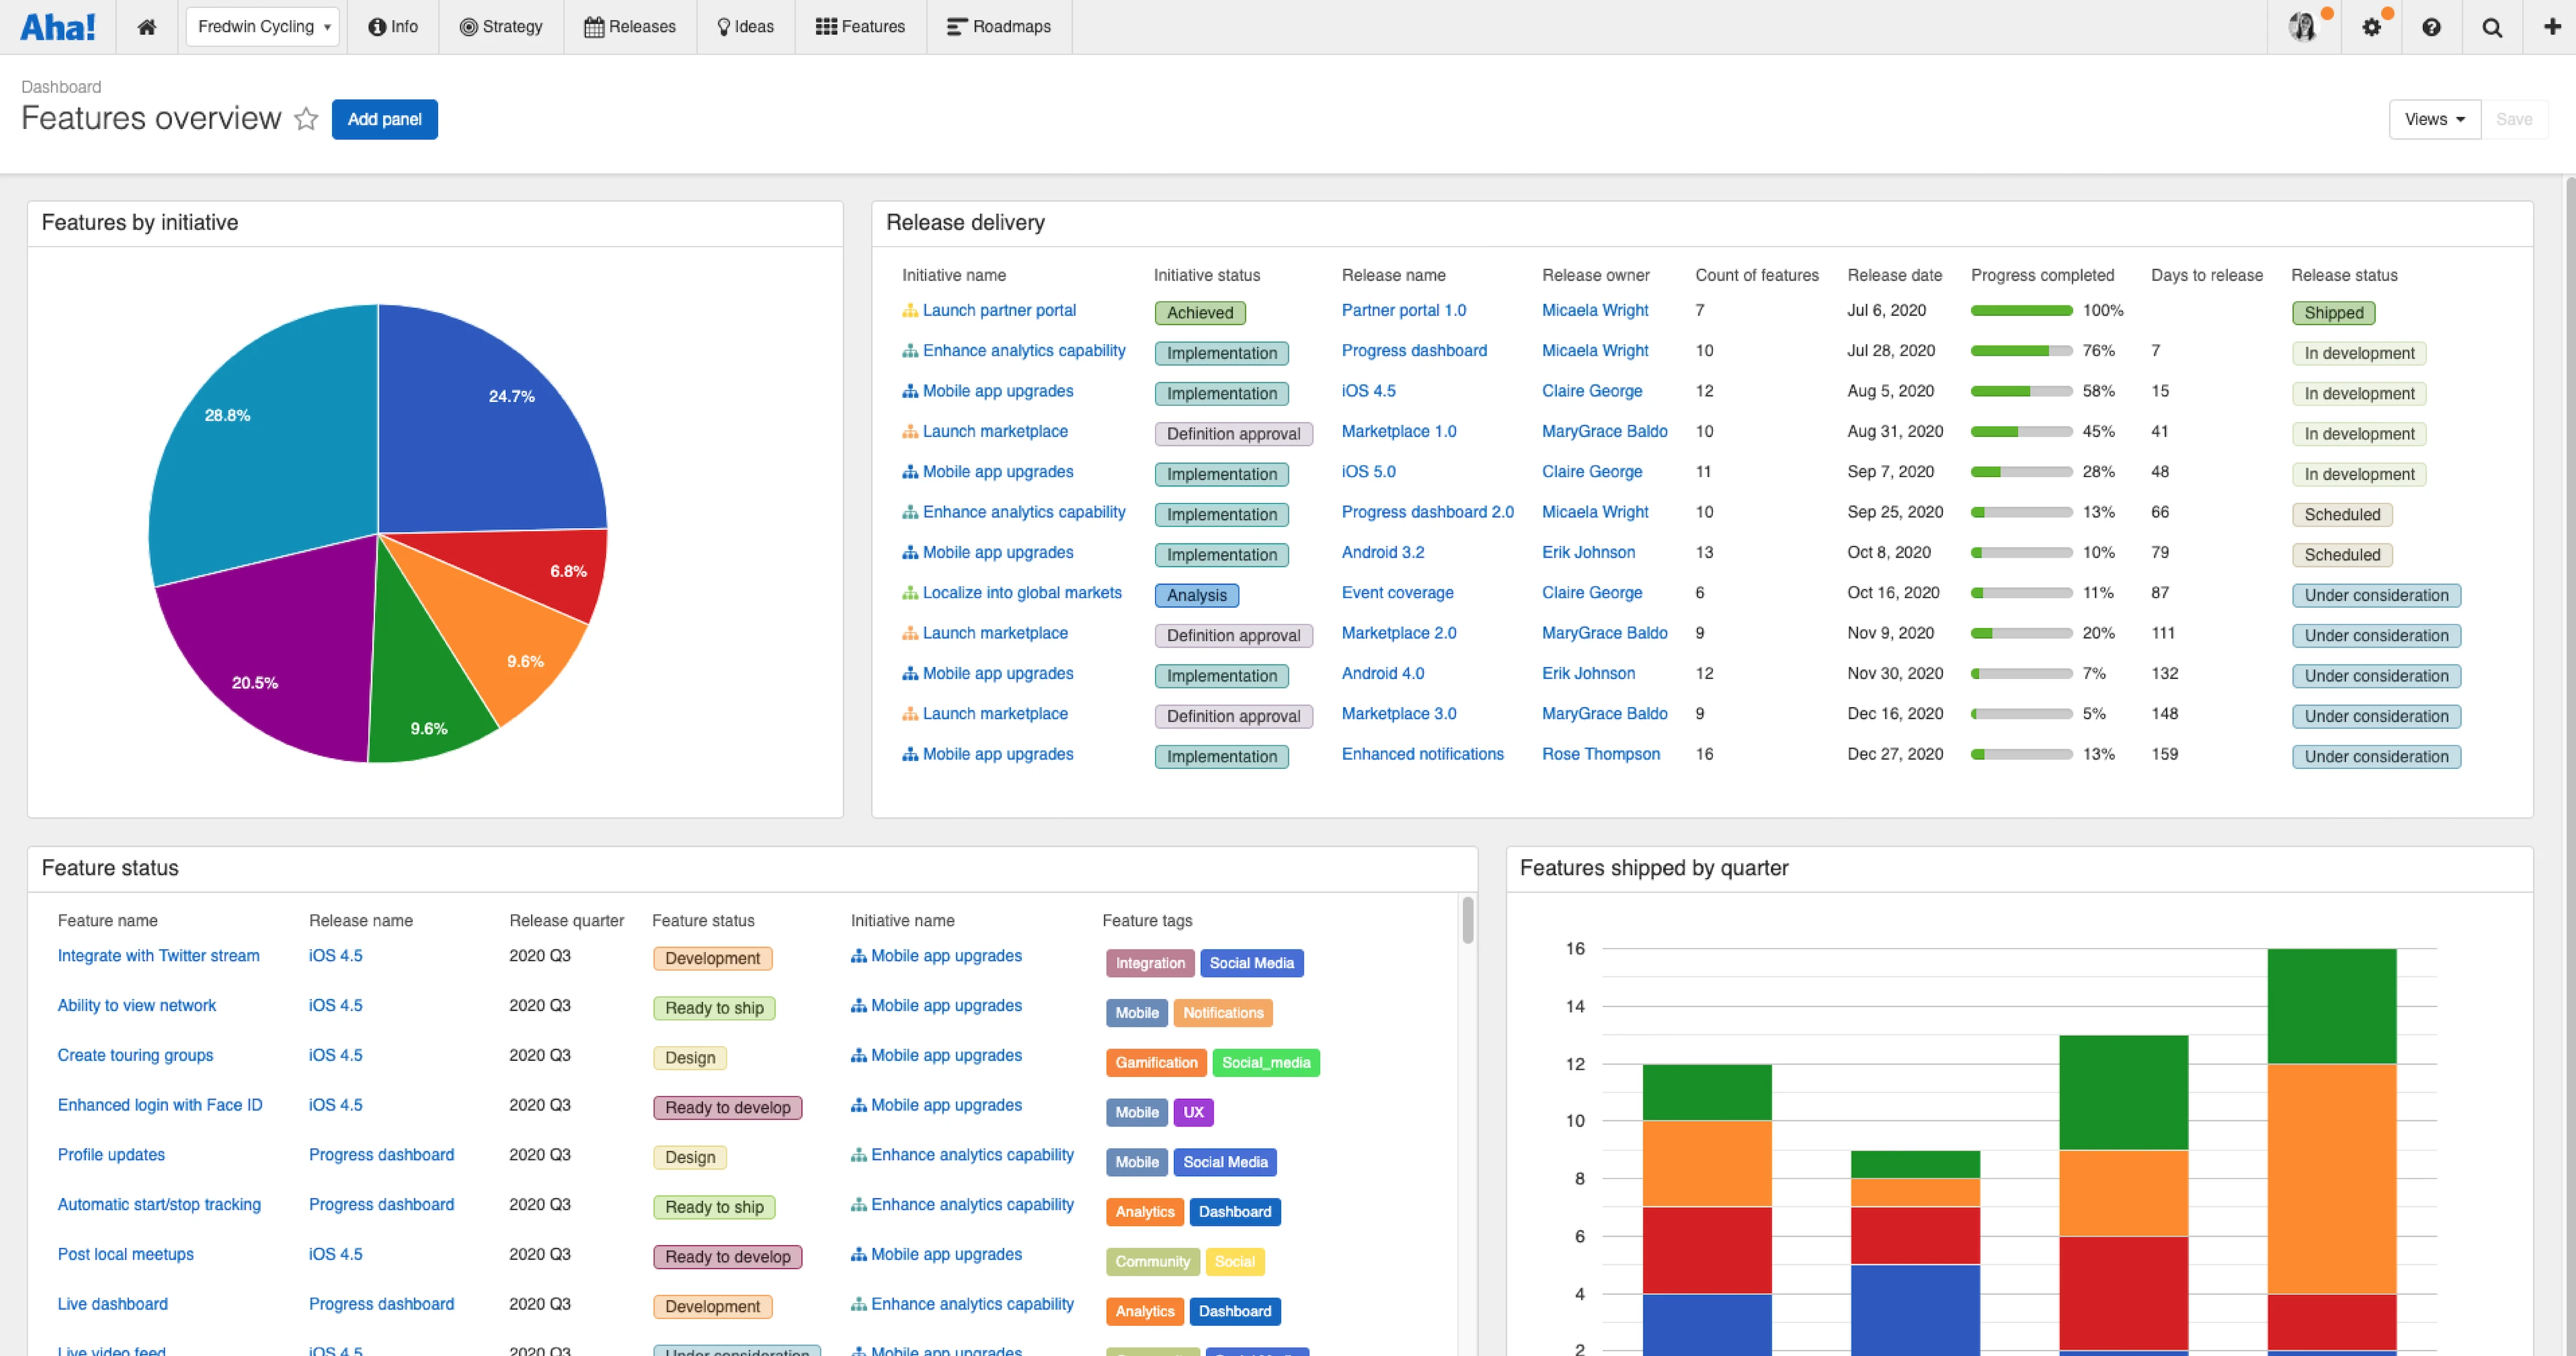
Highlight team progress
Evaluate team velocity so you can deliver on time. In this example, we created a dashboard for analyzing delivery metrics — including the status of epics, number of features shipped each month, and release progress. We can instantly see how the team is performing and if there are potential issues that need to be addressed.
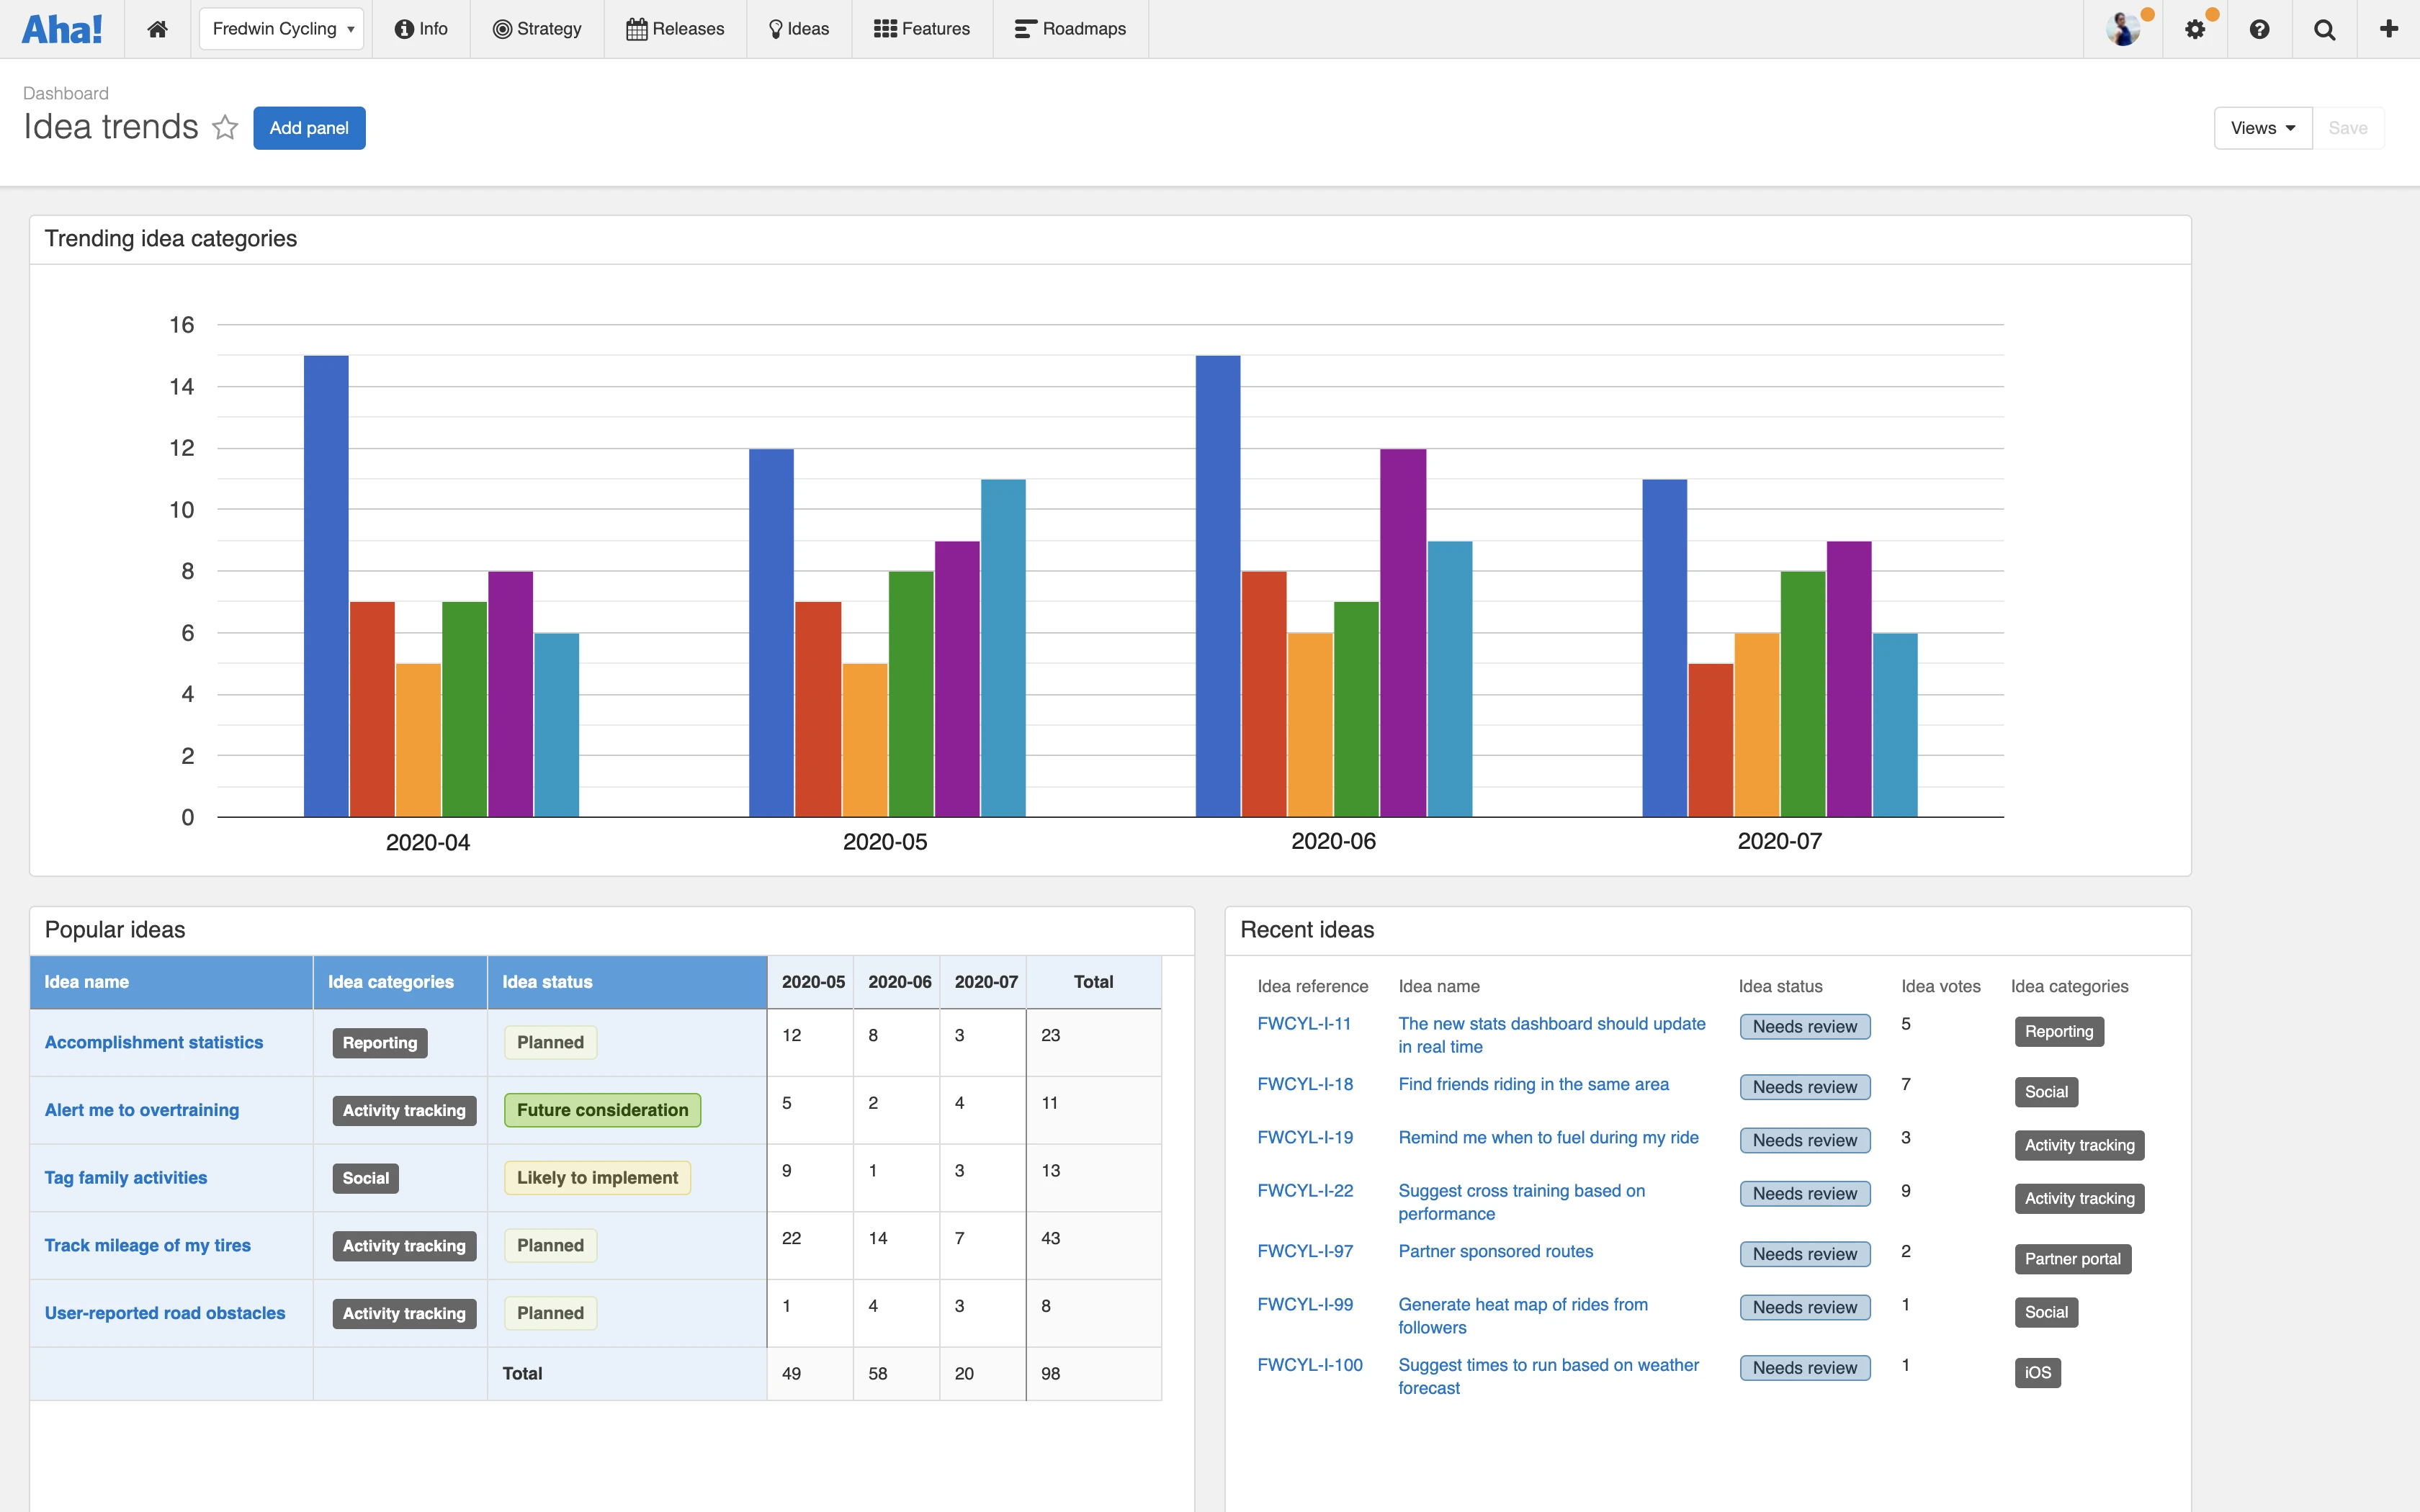
Track customer feedback
Dashboards are ideal for analyzing idea trends. Include multiple reports — such as trending ideas by category and popular ideas — so you can better understand what will bring your customers joy. Adding a panel for recently submitted ideas helps you stay on top of which requests need review.
Dashboards help you understand exactly how your products and projects are progressing.
One more thing to note — previously, "reports dashboard" referred to the section of the application where you accessed all of your saved roadmaps, reports, and presentations. With the addition of this new functionality, we thought it made sense to change that section to "overview," since it is the general summary of all your saved views.
From progress against your strategy to detailed metrics about the actual work, we hope this new functionality will help you quickly gain the insights you need. Let us know what types of dashboards you create. We love hearing about the innovative ways customers like you are using Aha!
Sign up for a free Aha! trial — be happy Dashboards are available to all Aha! customers. If you are not already an Aha! customer, you may want to sign up for a free 30-day trial or join a live demo to see why more than 300,000 users trust Aha! to build lovable products.