Introducing a new chart experience in Aha! Roadmaps and Aha! Ideas Advanced
Create Beautiful New Charts to Visualize Your Aha! Data


Part of what makes Aha! software so powerful is our analytics and reporting engine. You can instantly turn your product data into compelling visualizations — such as bar, column, line, pie, scatter, and bubble charts. And you can customize nearly every aspect of those charts to make them look the way you want. But jumping back and forth between the chart and settings modal to fine-tune the details could make the experience somewhat cumbersome. So, we created a dynamic new way to build the perfect chart.
Charts in Aha! software are now easier to configure with a streamlined aesthetic — so you can visualize your data exactly the way you want.
The first thing you will notice is a visual refresh. We updated the styling and default color palette — so your visualizations look even more dazzling. We also streamlined chart configuration. Customization settings are now accessible right inside the chart view and changes are applied in real time. This helps you work faster to create the perfect visualization.
There are a few other enhancements too. For example, you can now sync the colors of each chart's data series with the colors used in your Aha! data — such as status, records, and tags — to ensure consistency. And you have more control over options such as data labels and counts. We also organized the settings by topic and removed a few options that were rarely used to give you a clean and uncluttered experience.
Many of you have a lot of existing reports. So, let's go over the transition plan. Starting today, new charts will be created using the new design. You can update saved charts one at a time using a new button in the chart view. This action will resave your chart — including any customization settings except for custom series colors — in the new format. You can switch back and forth between the styles until August 2, 2021, when the new experience will be permanently applied.
Here is a look at three different chart types so you can better understand what's new:
Pie charts
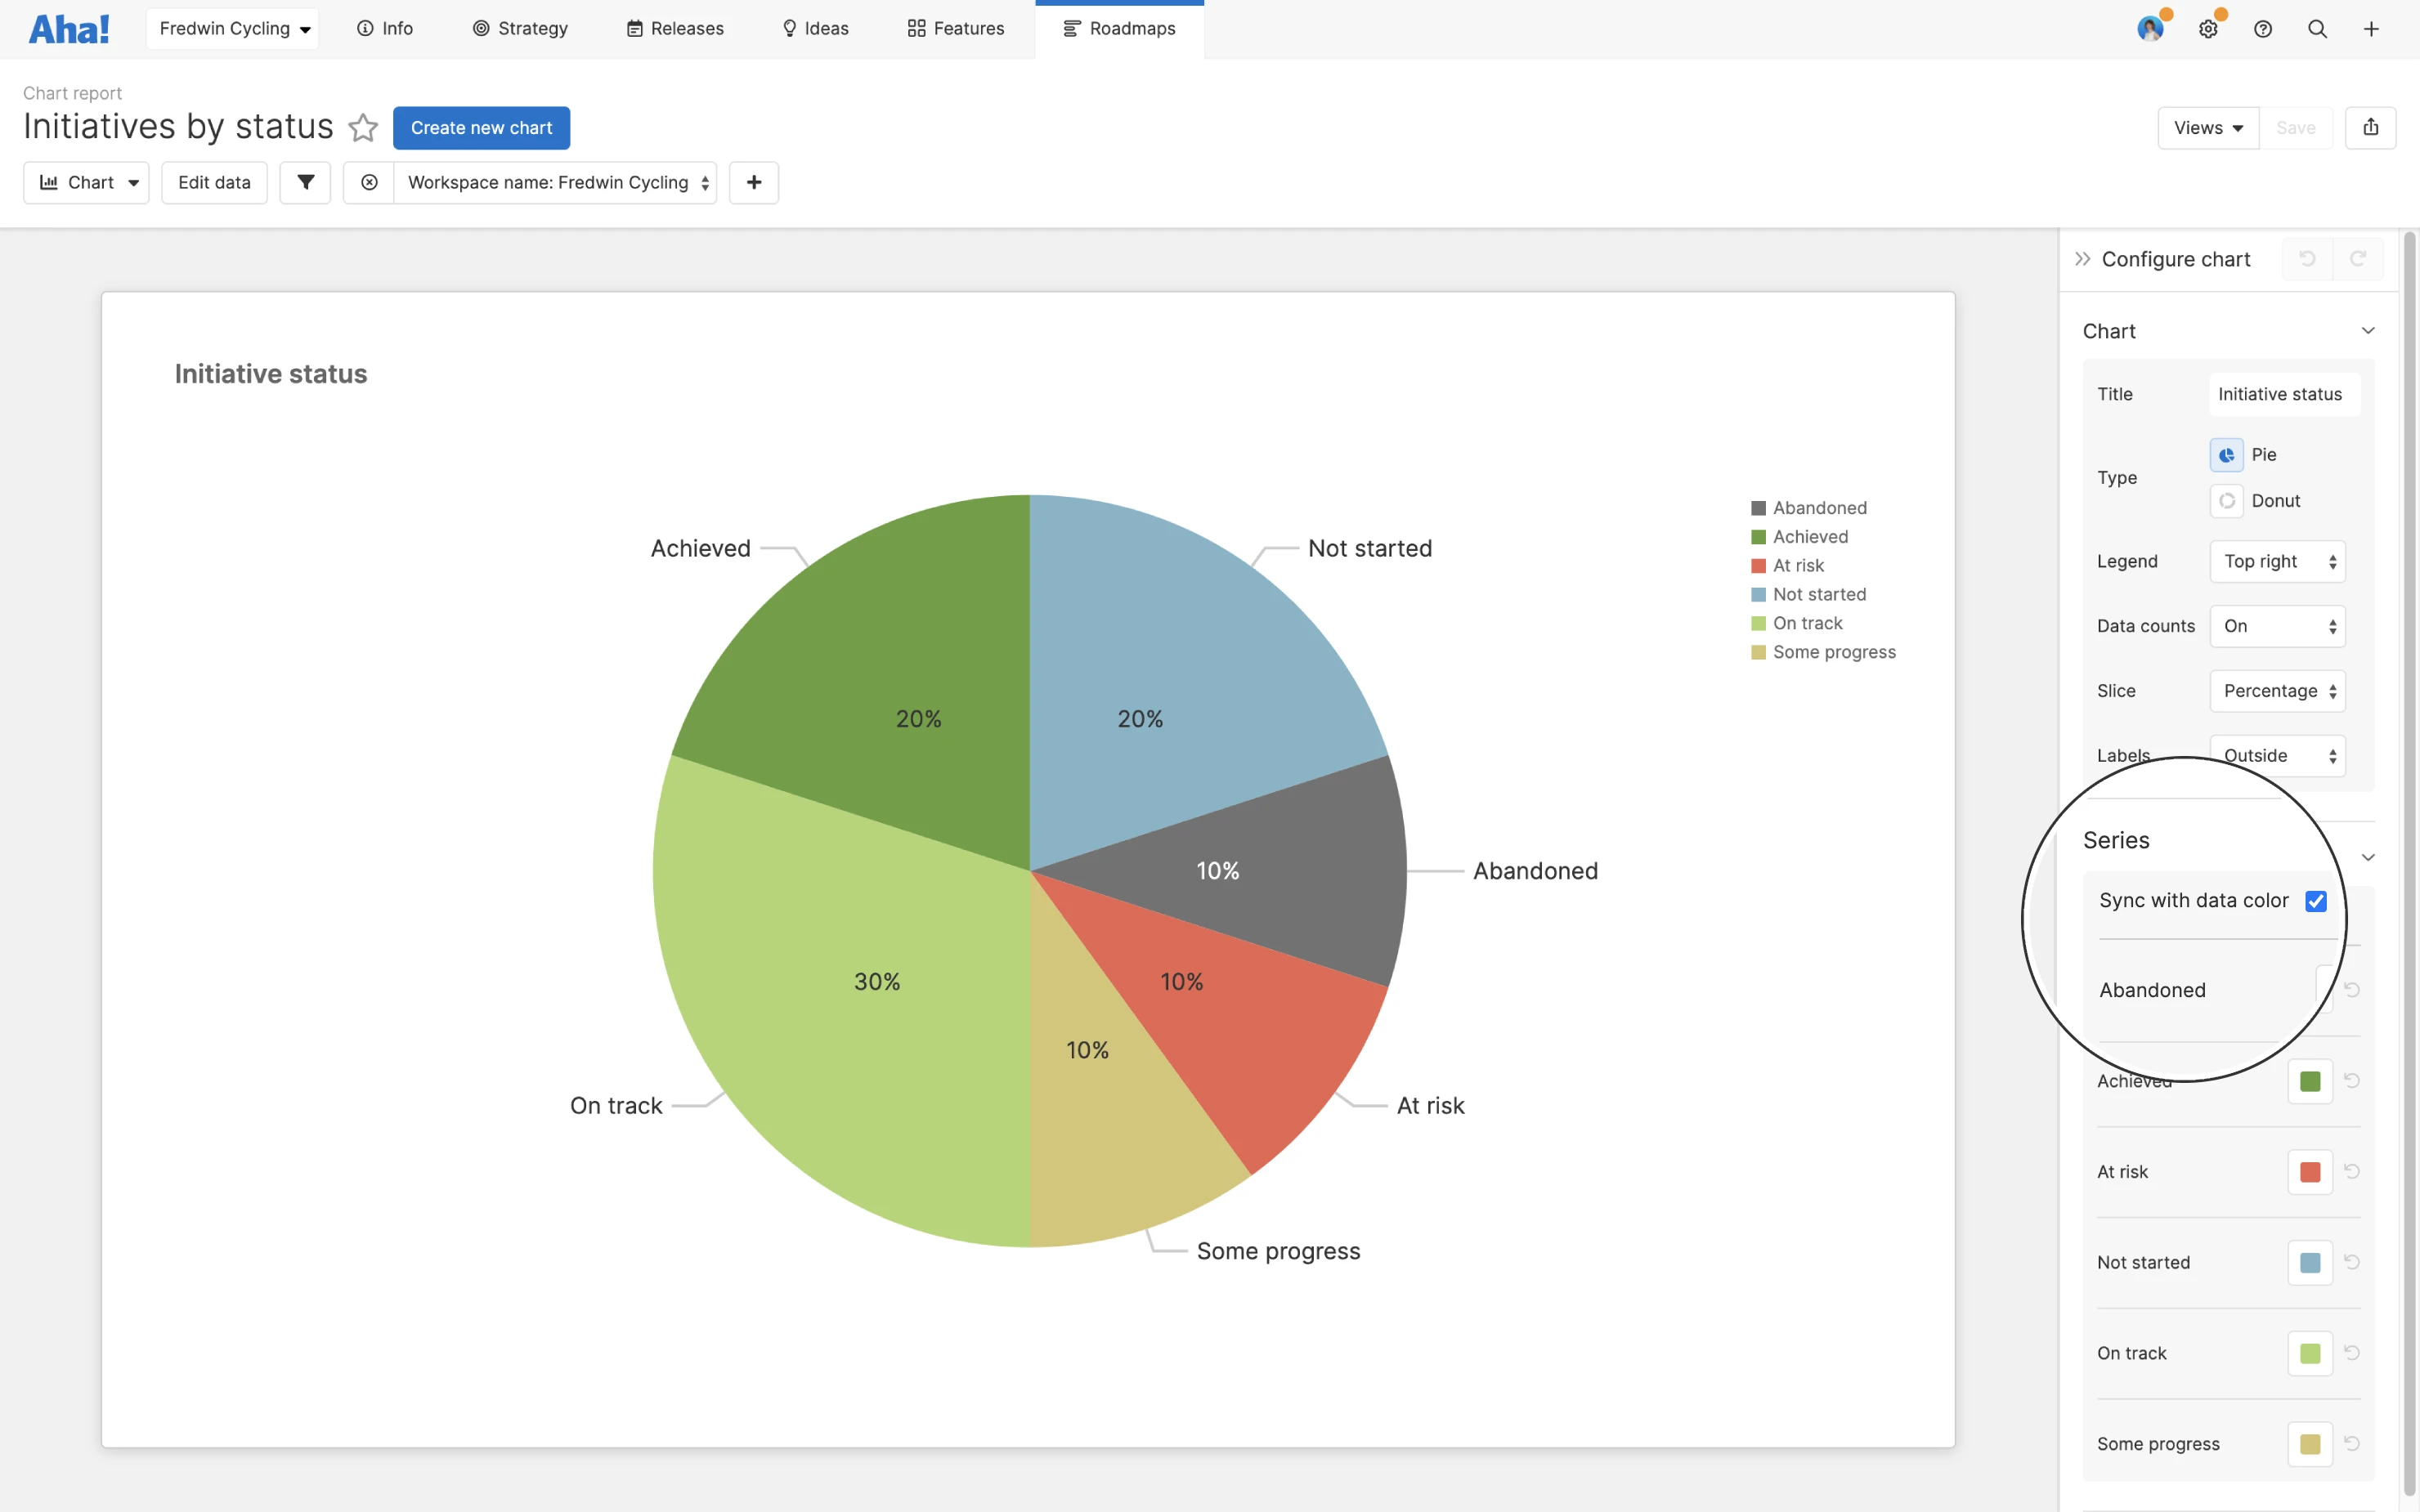
The pie chart below shows the total count of initiatives by status — so we can gauge progress against our strategy. By default, each data slice now includes a label and the series colors are set to sync with the status colors used in our account. Keeping the color story in place helps people quickly scan and reduces cognitive load.
Bar charts
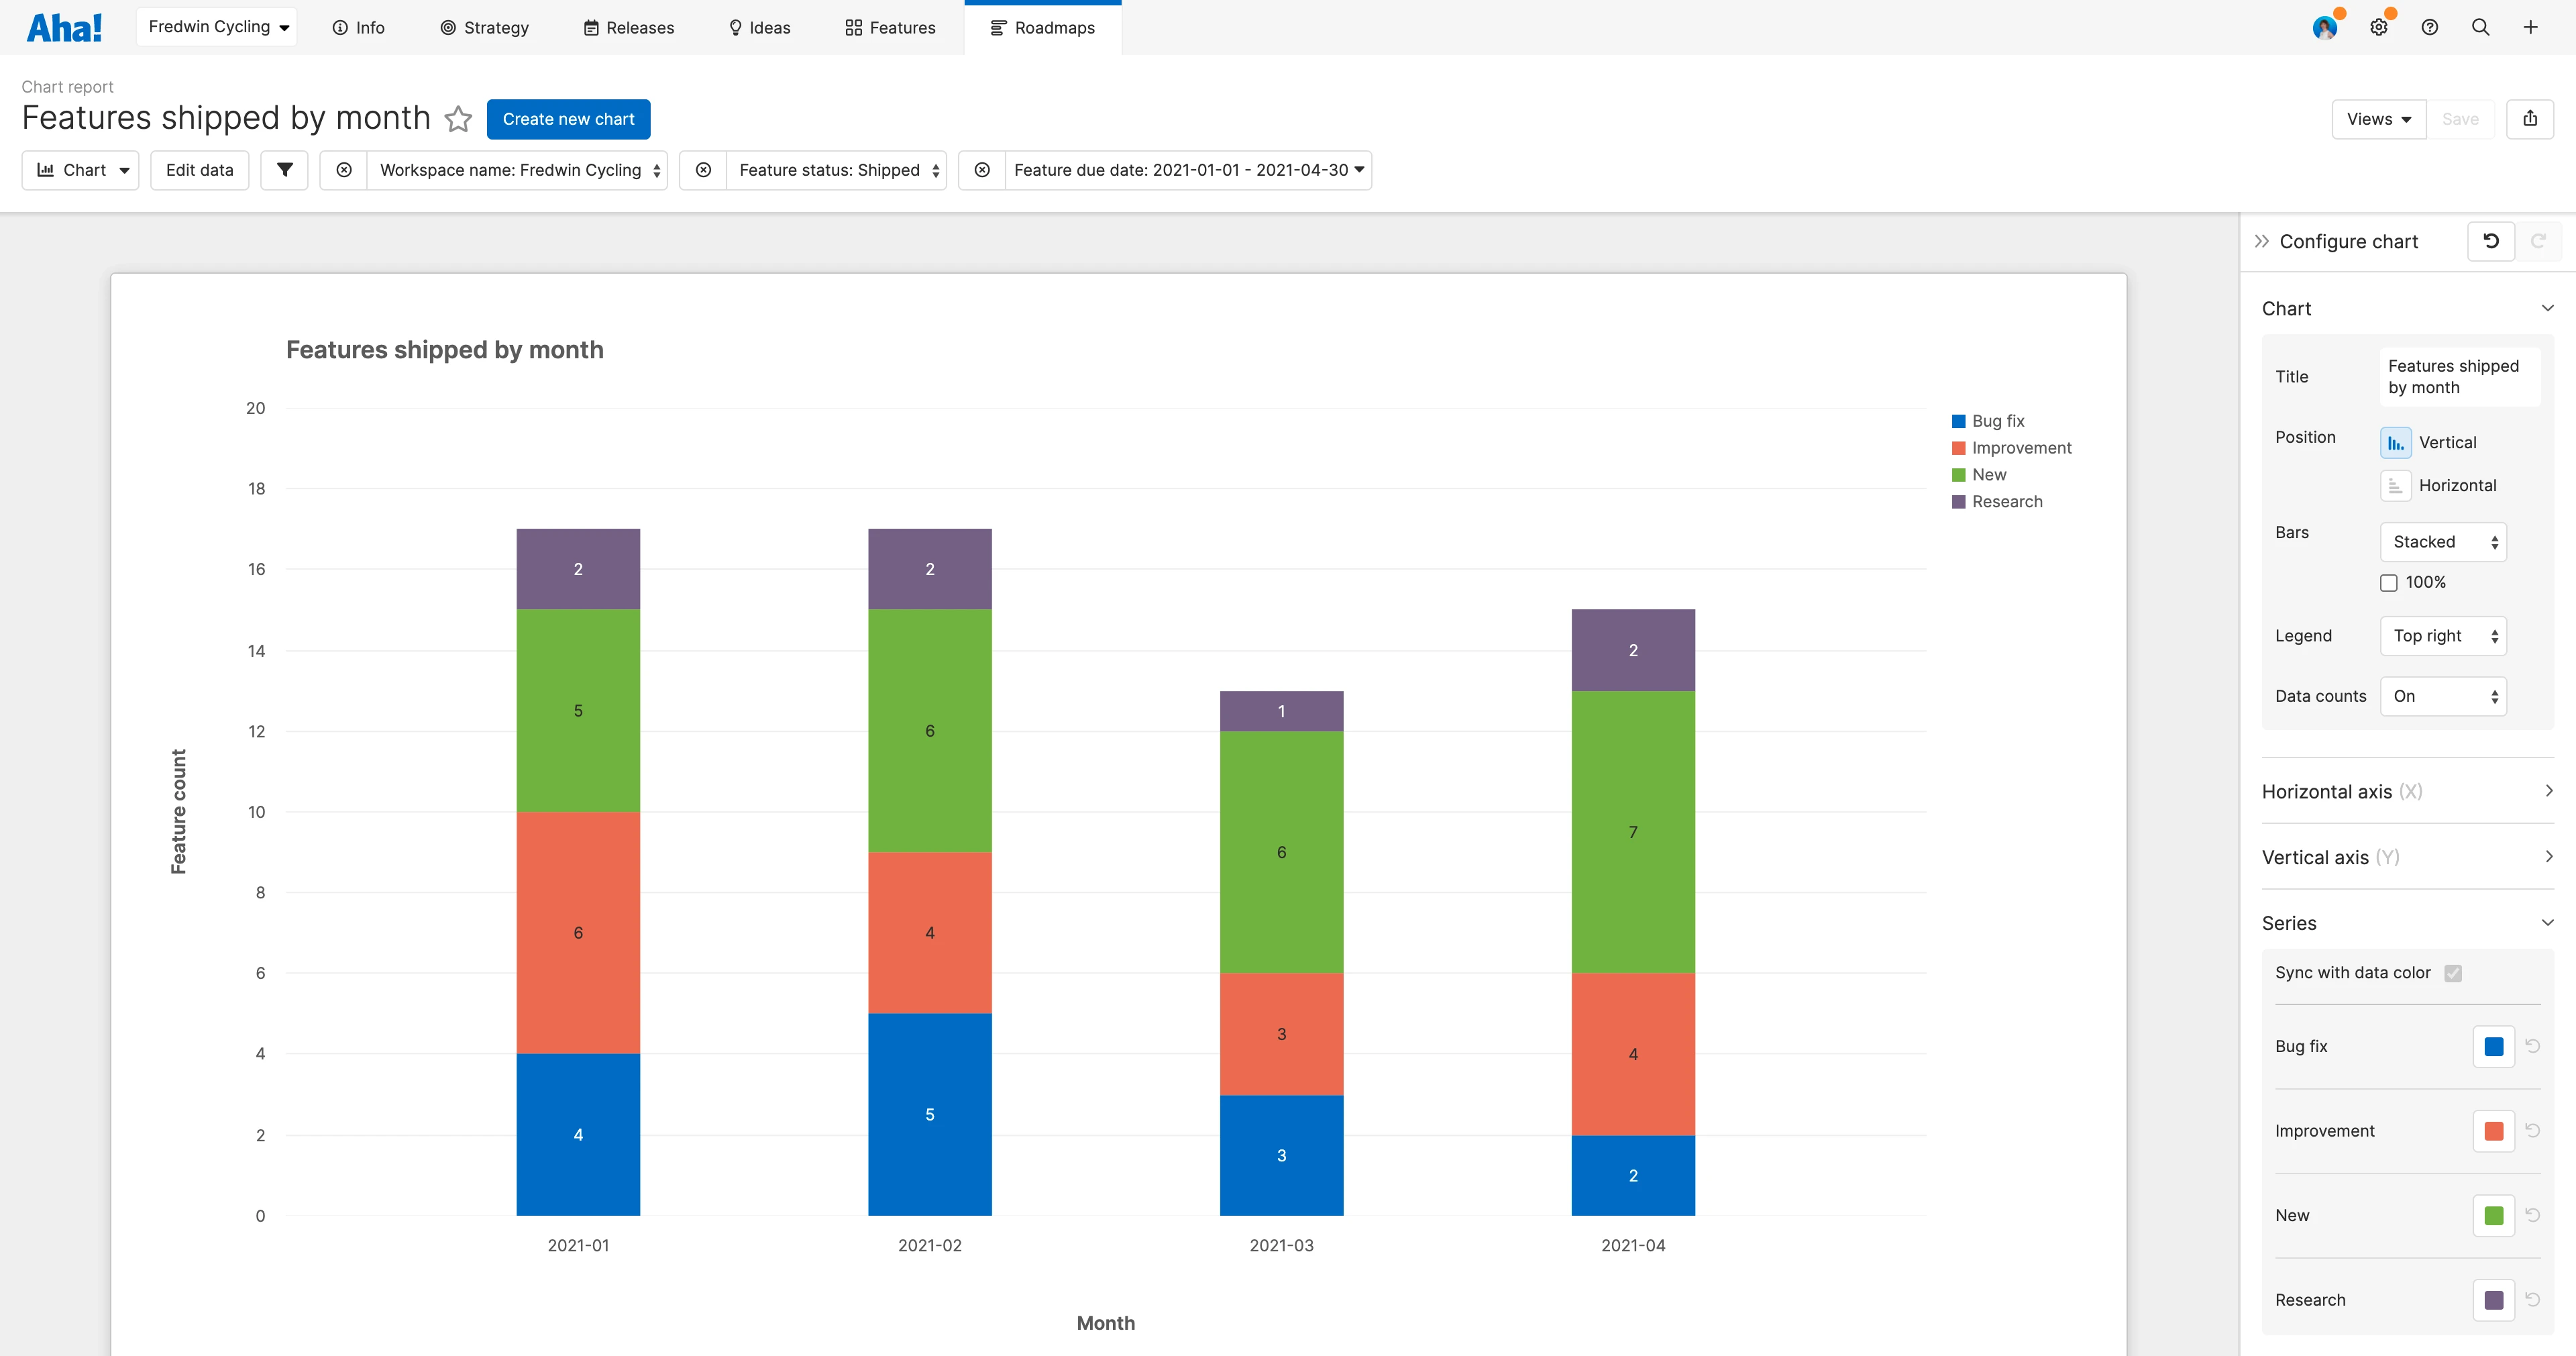
Vertical or horizontal bars? Grouped or stacked data? There are many options to consider when you create a bar chart. And sometimes it takes a few attempts to get the best configuration. Now you can quickly adjust your chart settings and see the results — in one view. Here, we created a bar chart to show features shipped each month. We updated the chart to vertical bars and grouped the data by feature type.
Line charts
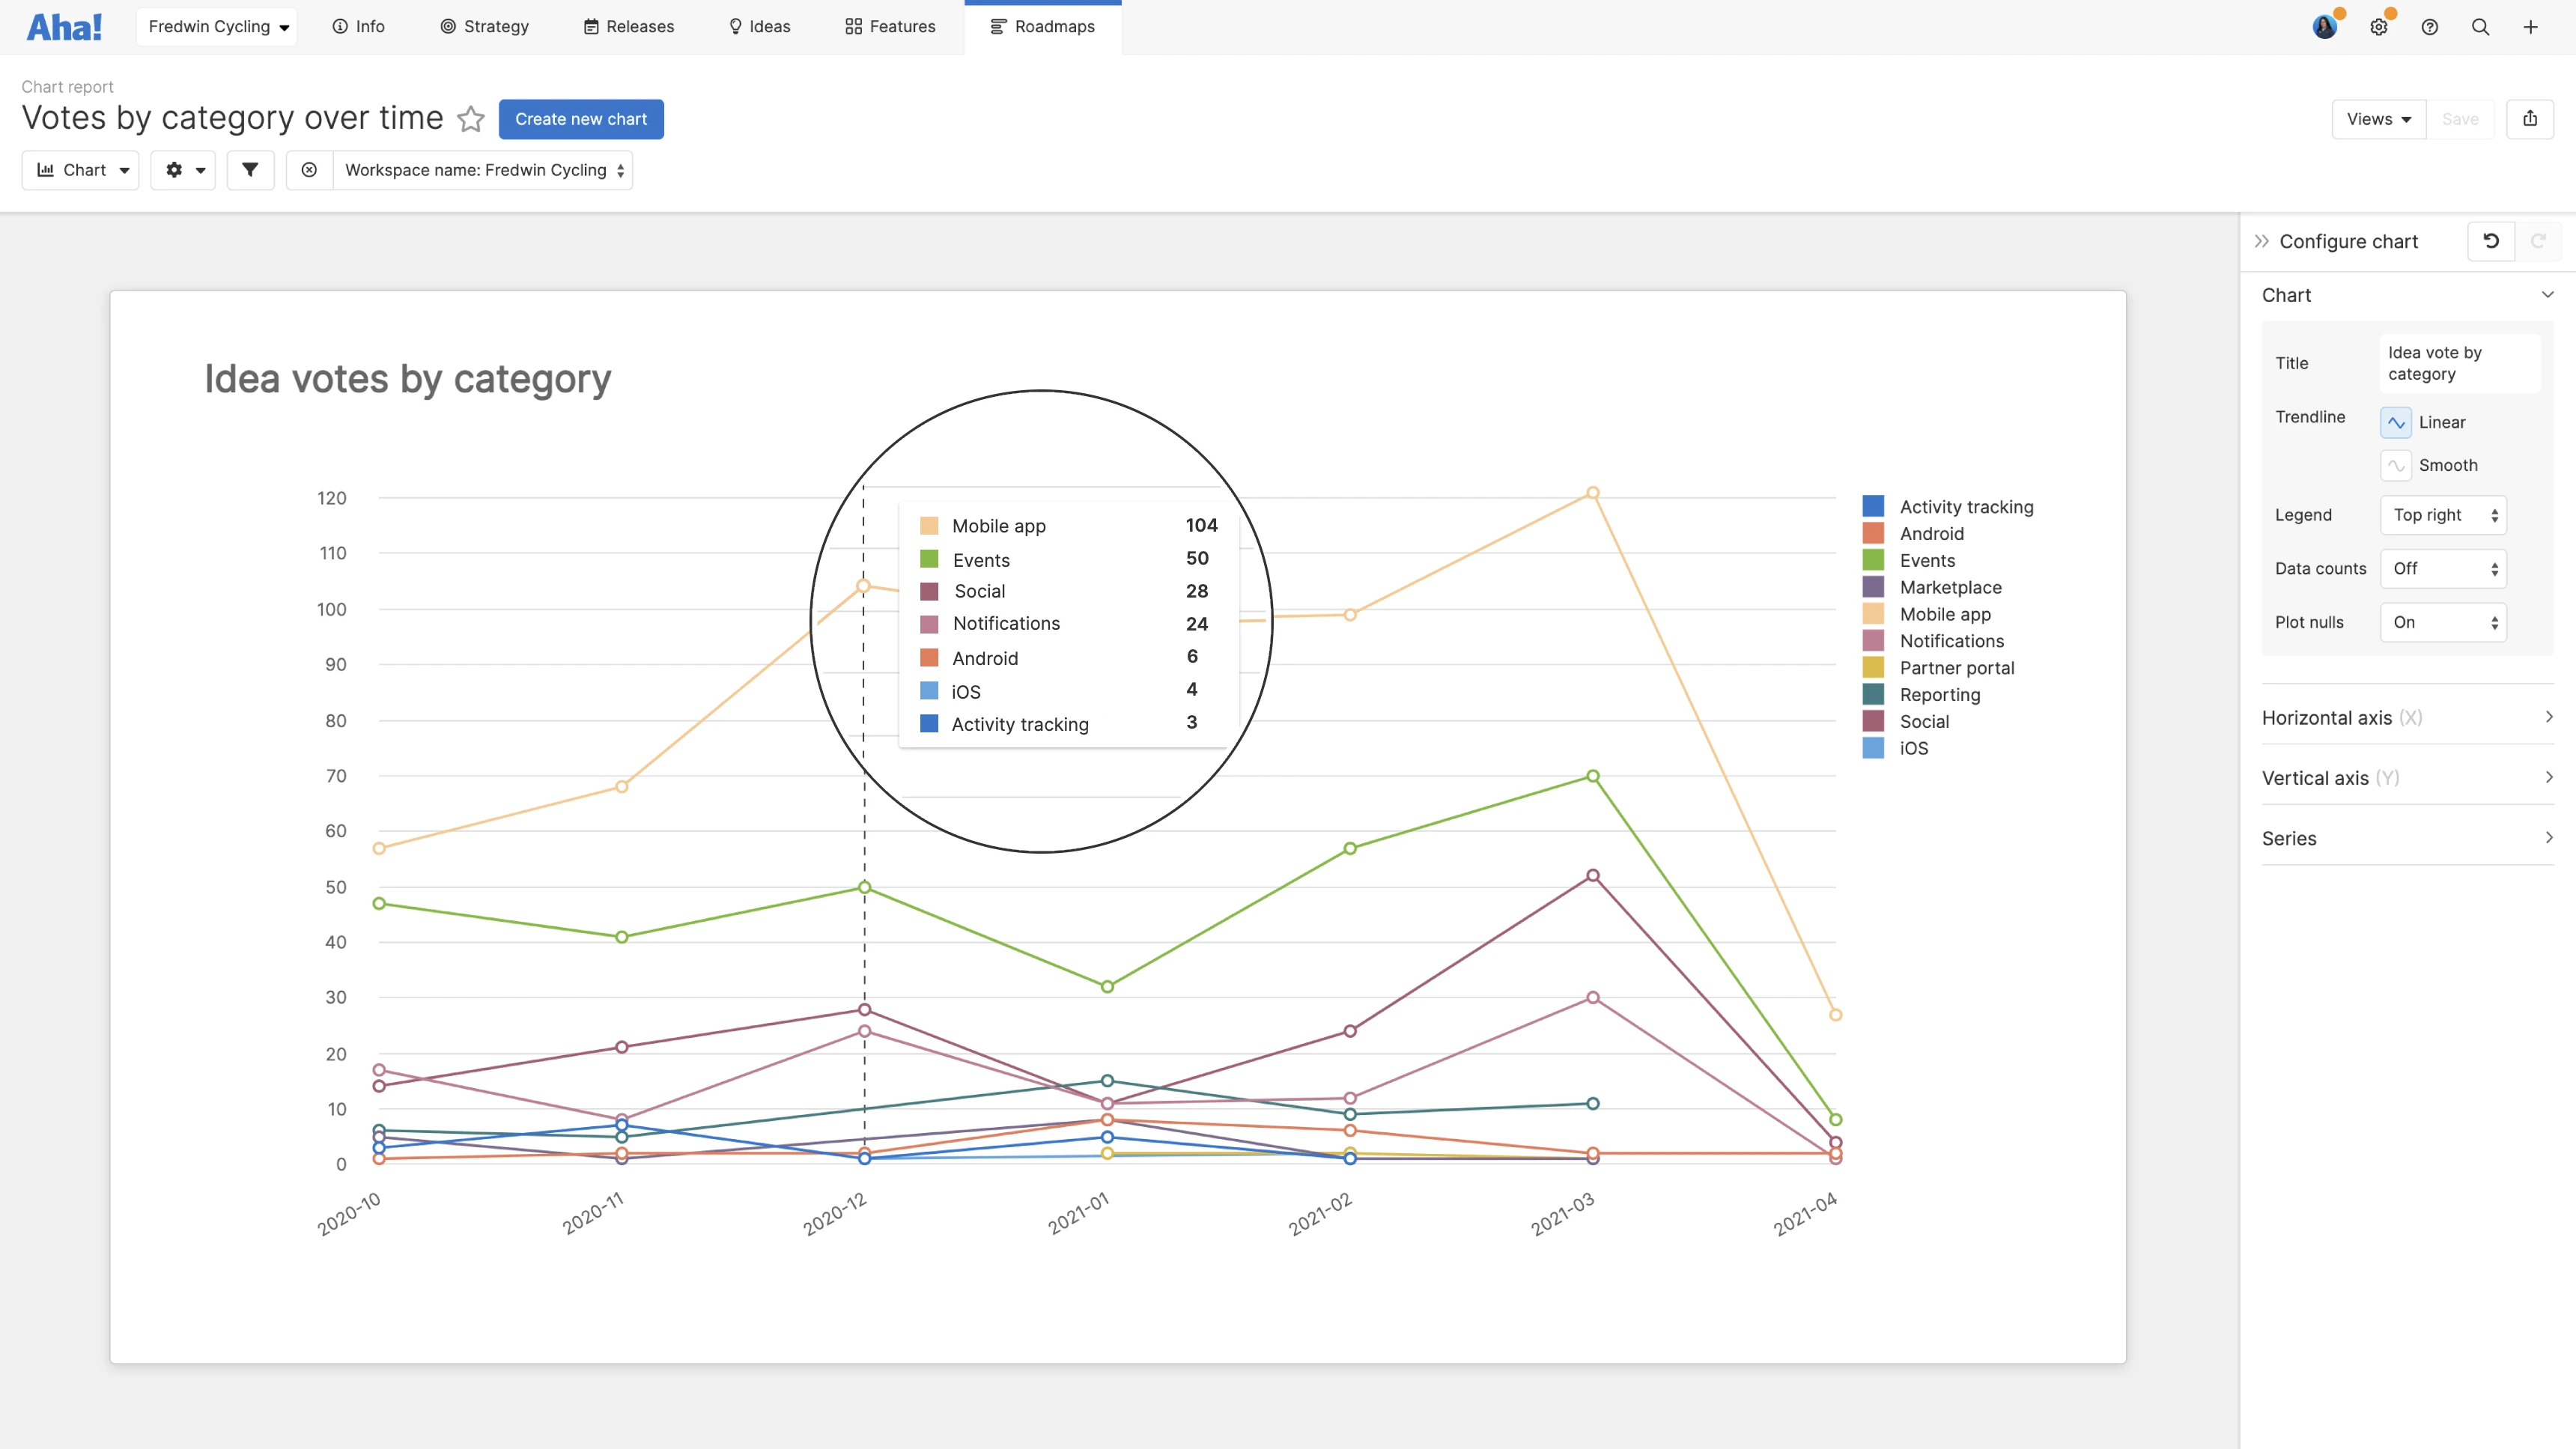
Line charts are great for tracking trends. In the chart below we are analyzing idea votes by category over time. As you can see, the improved design makes it easier to hone in on specific data points. And a dotted vertical line now appears when you hover a data point so you can compare values across multiple data sets.
Now you can quickly build charts like a pro and dazzle your audience with beautiful visualizations.
Many of you share charts in a variety of places — including dashboards, presentations, shared webpages, and notes. So we wanted to give you plenty of time to update your charts before we permanently apply the new look on August 2, 2021. We look forward to hearing what you think.
Start a free trial today — be happy
The new charting experience is available to all Aha! Roadmaps and Aha! Ideas Advanced customers. If you are not already an Aha! customer, you may want to sign up for a free 30-day trial or join a live demo to see why more than 400,000 users trust our software to build lovable products.