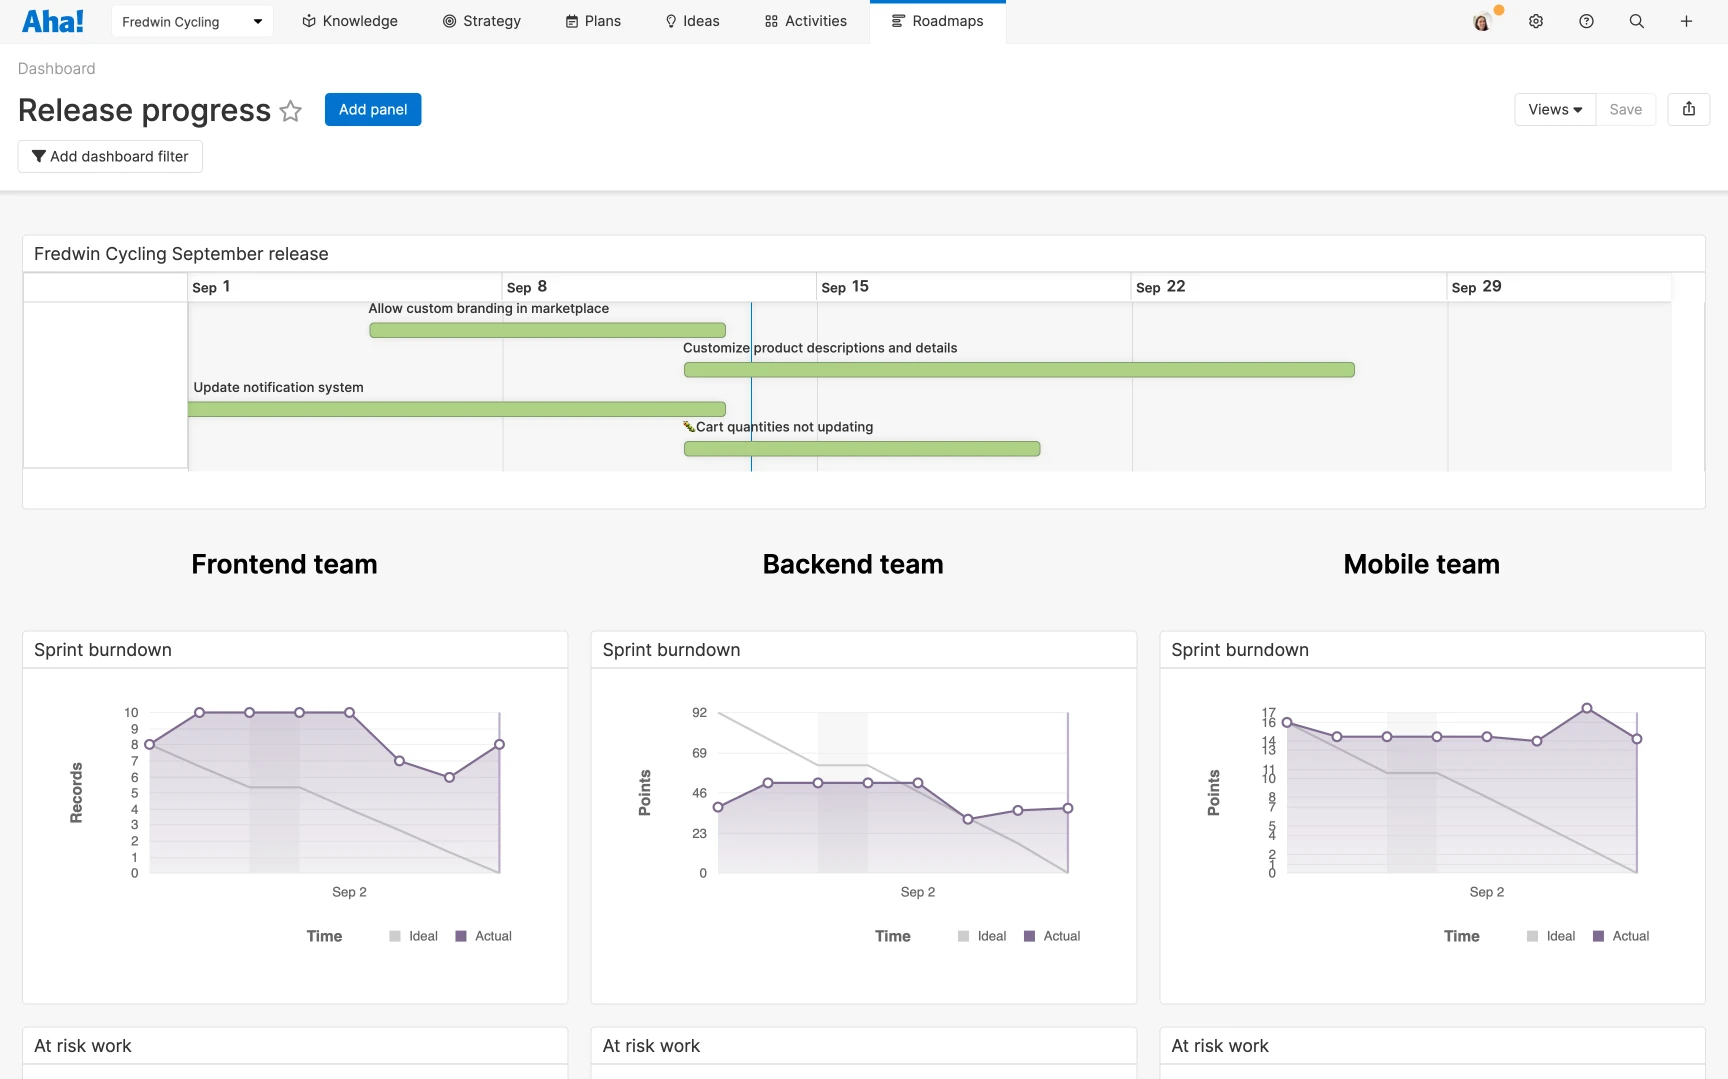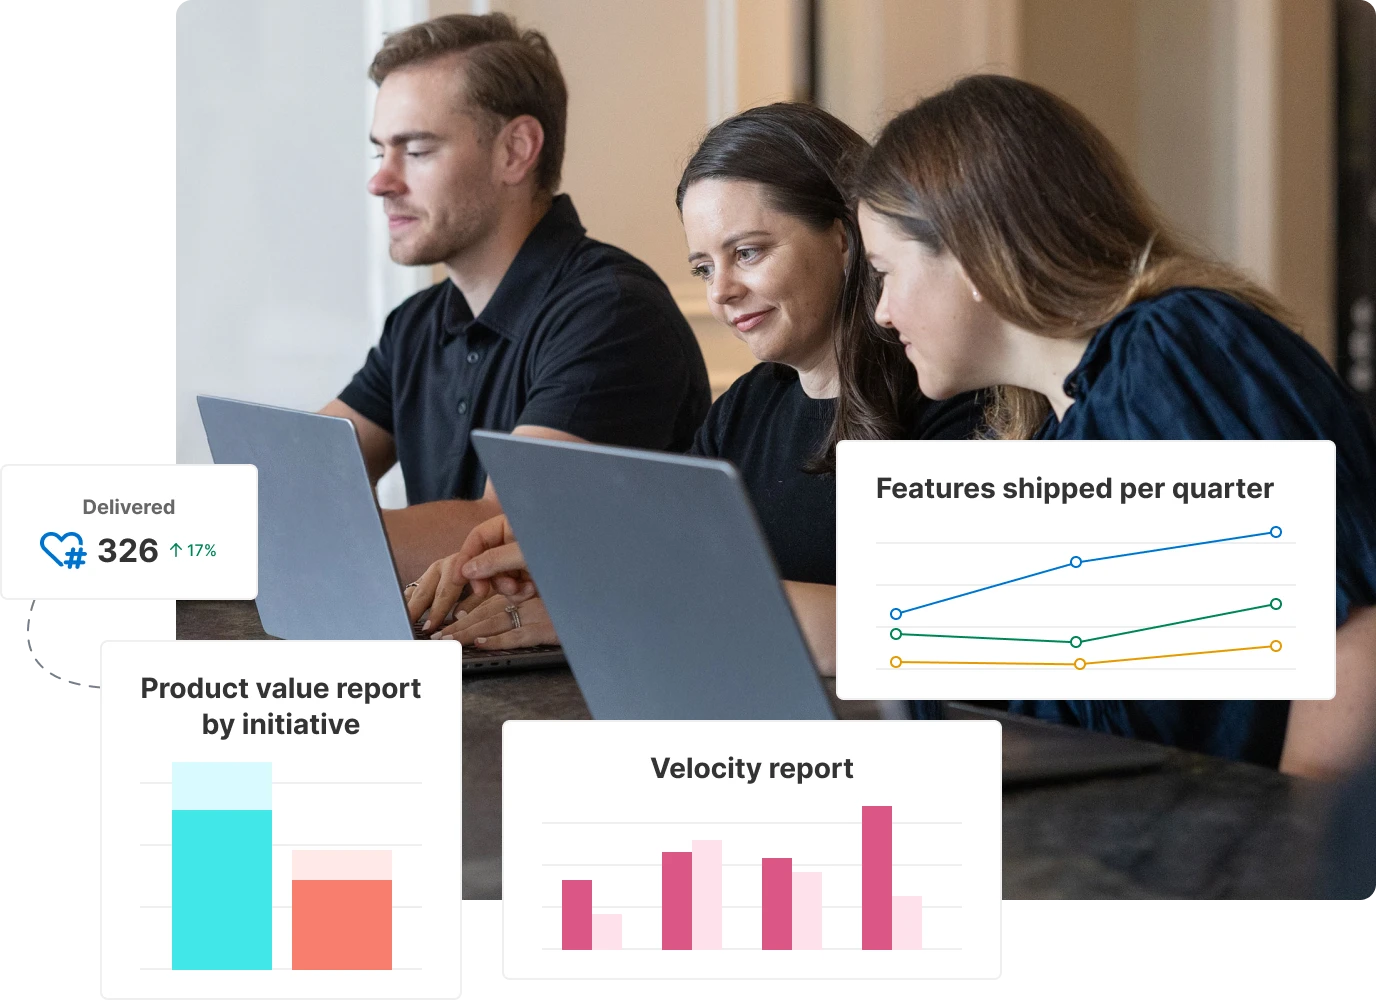
Measure what matters
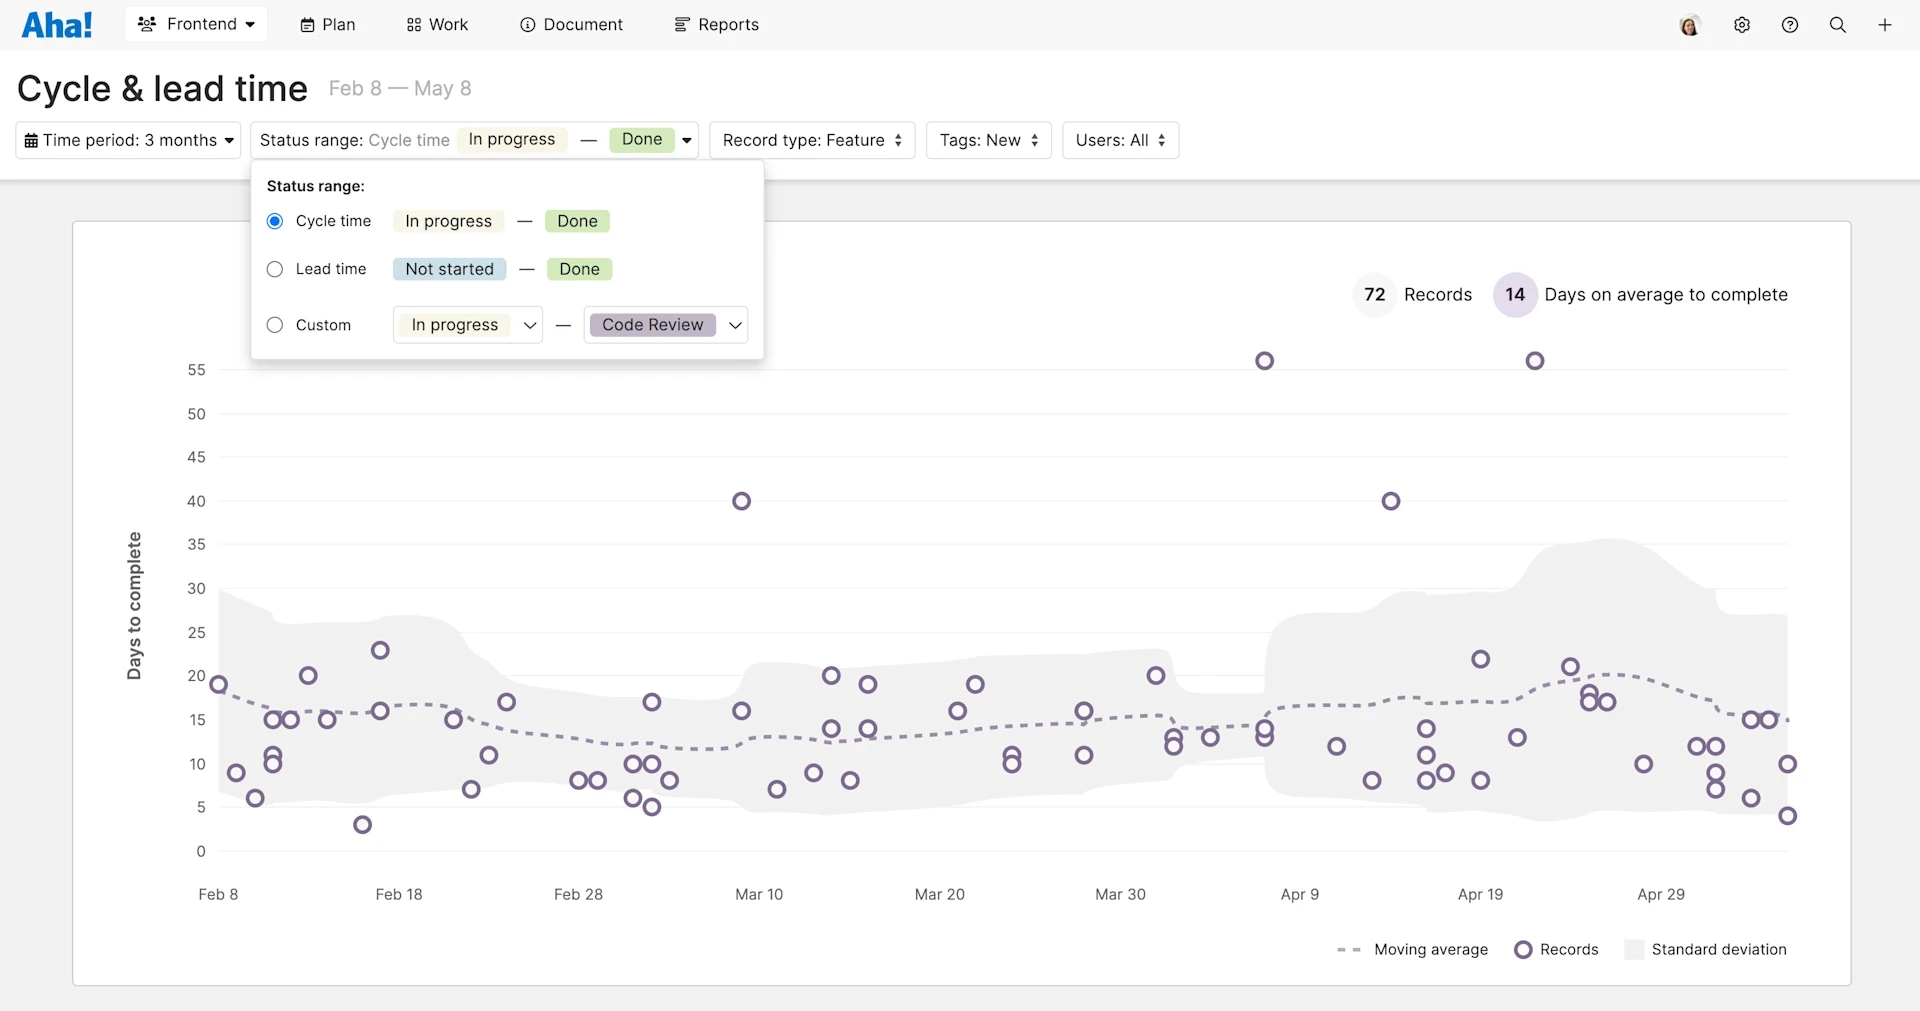
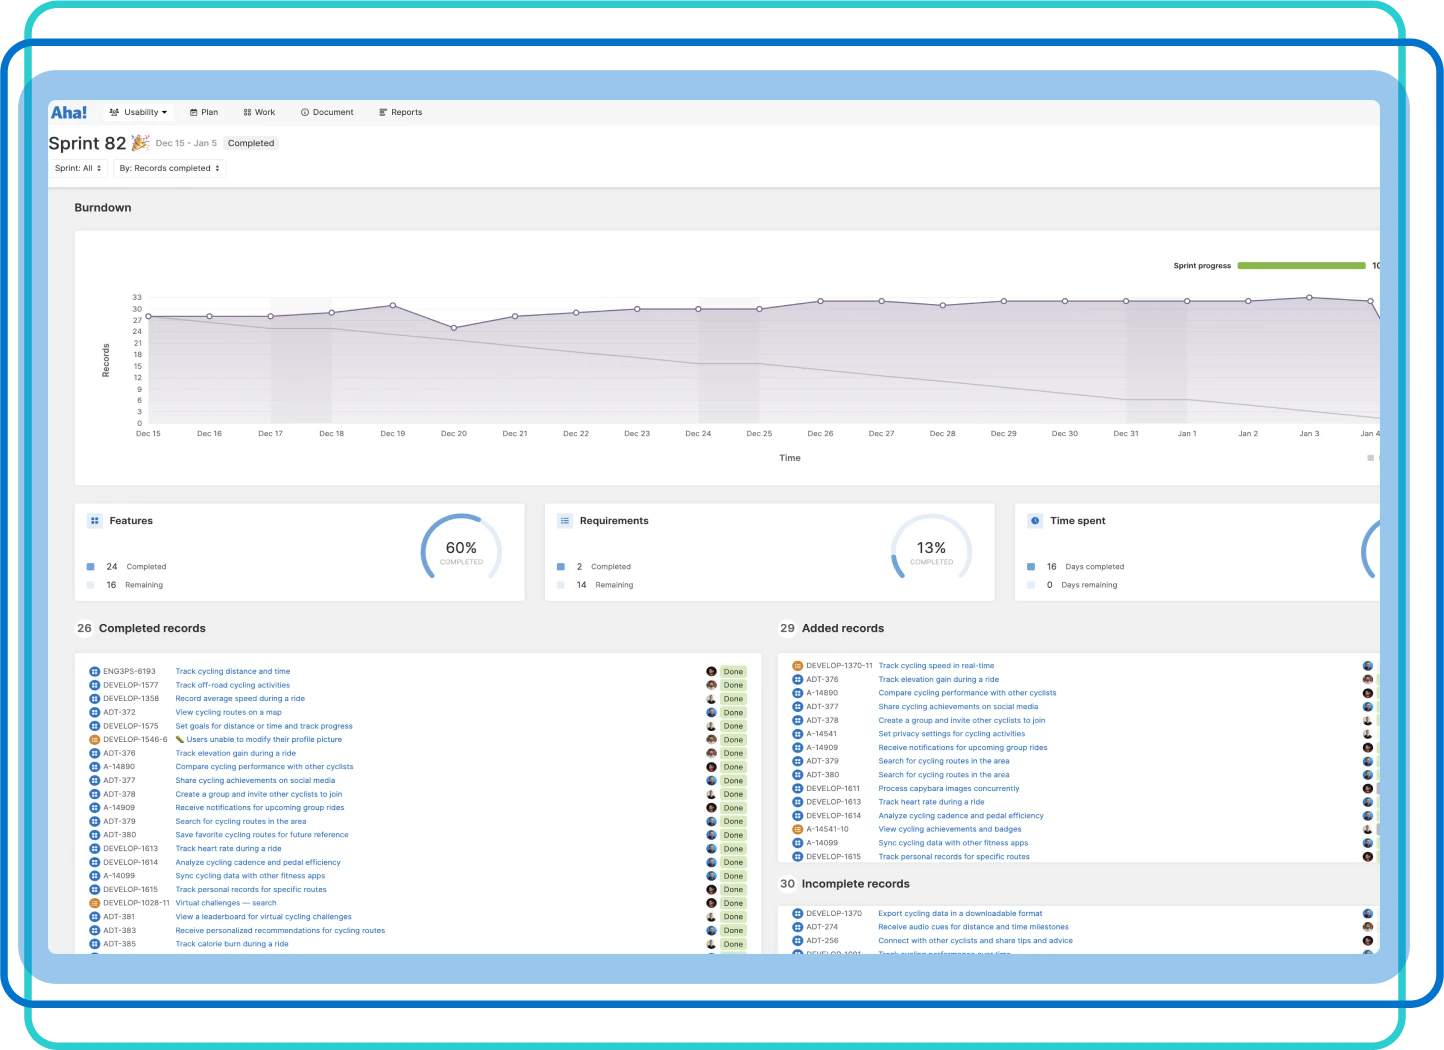
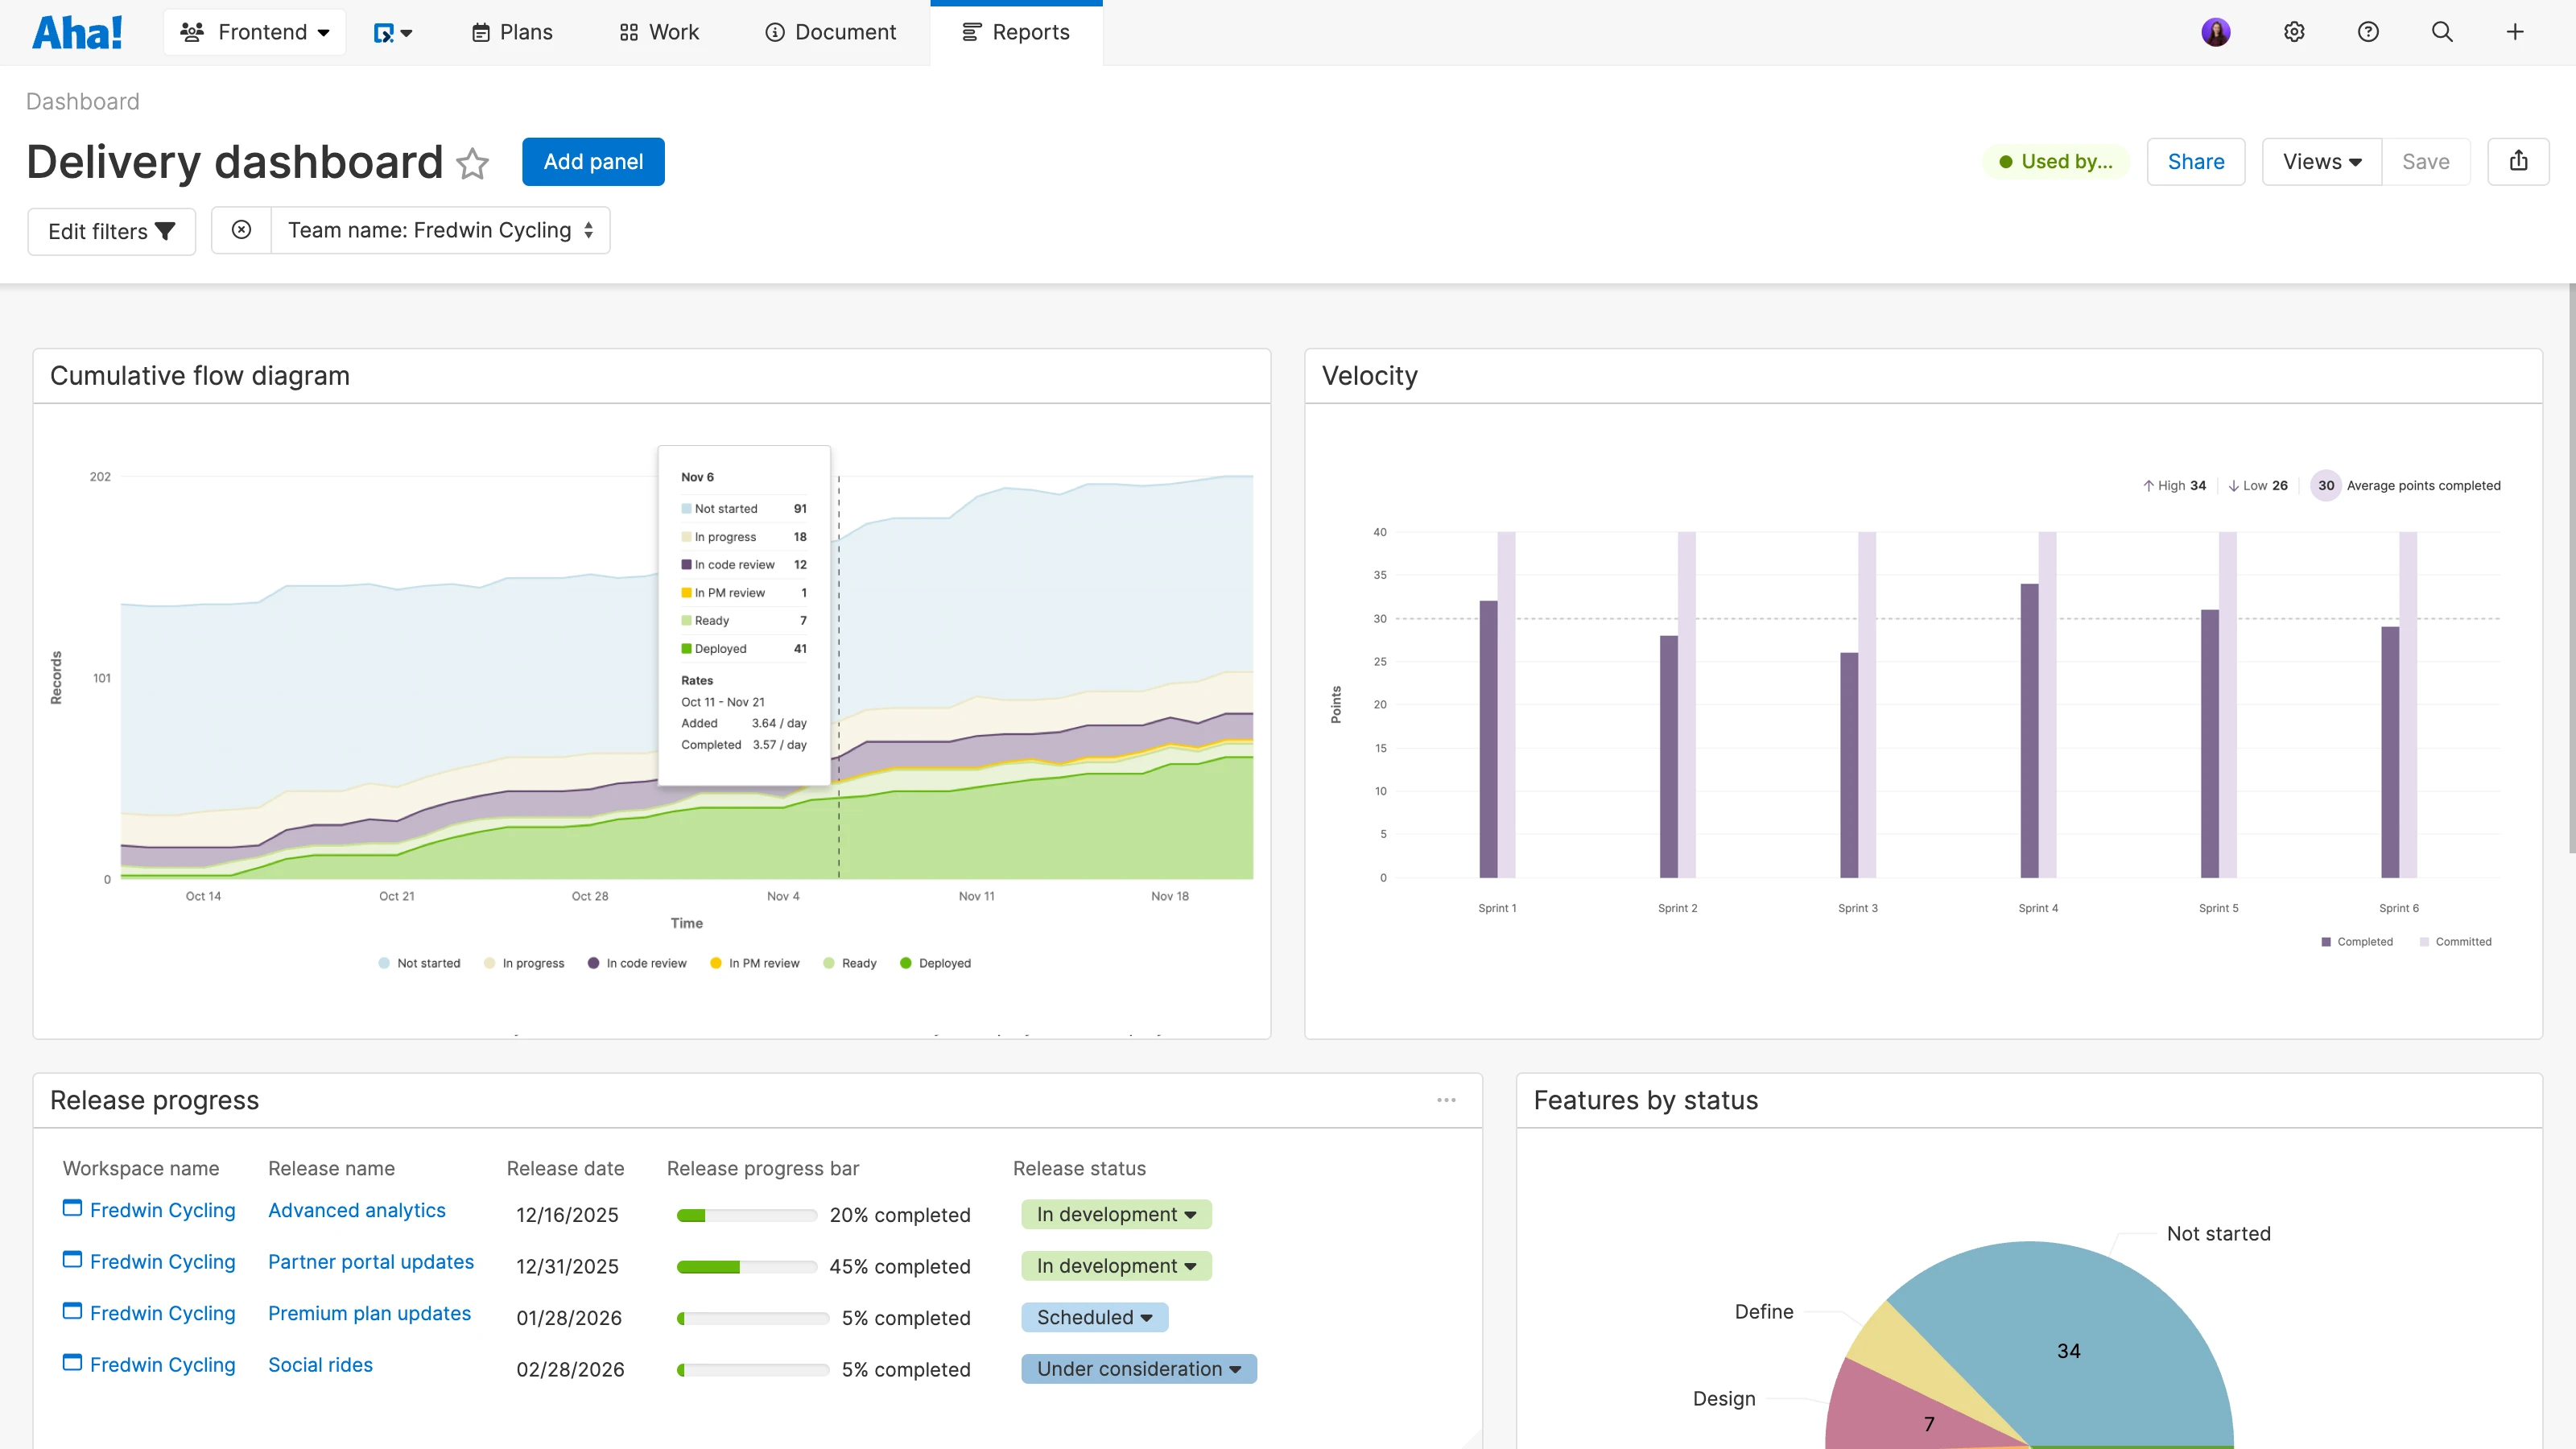
Track agile metrics to understand how fast the team completes work
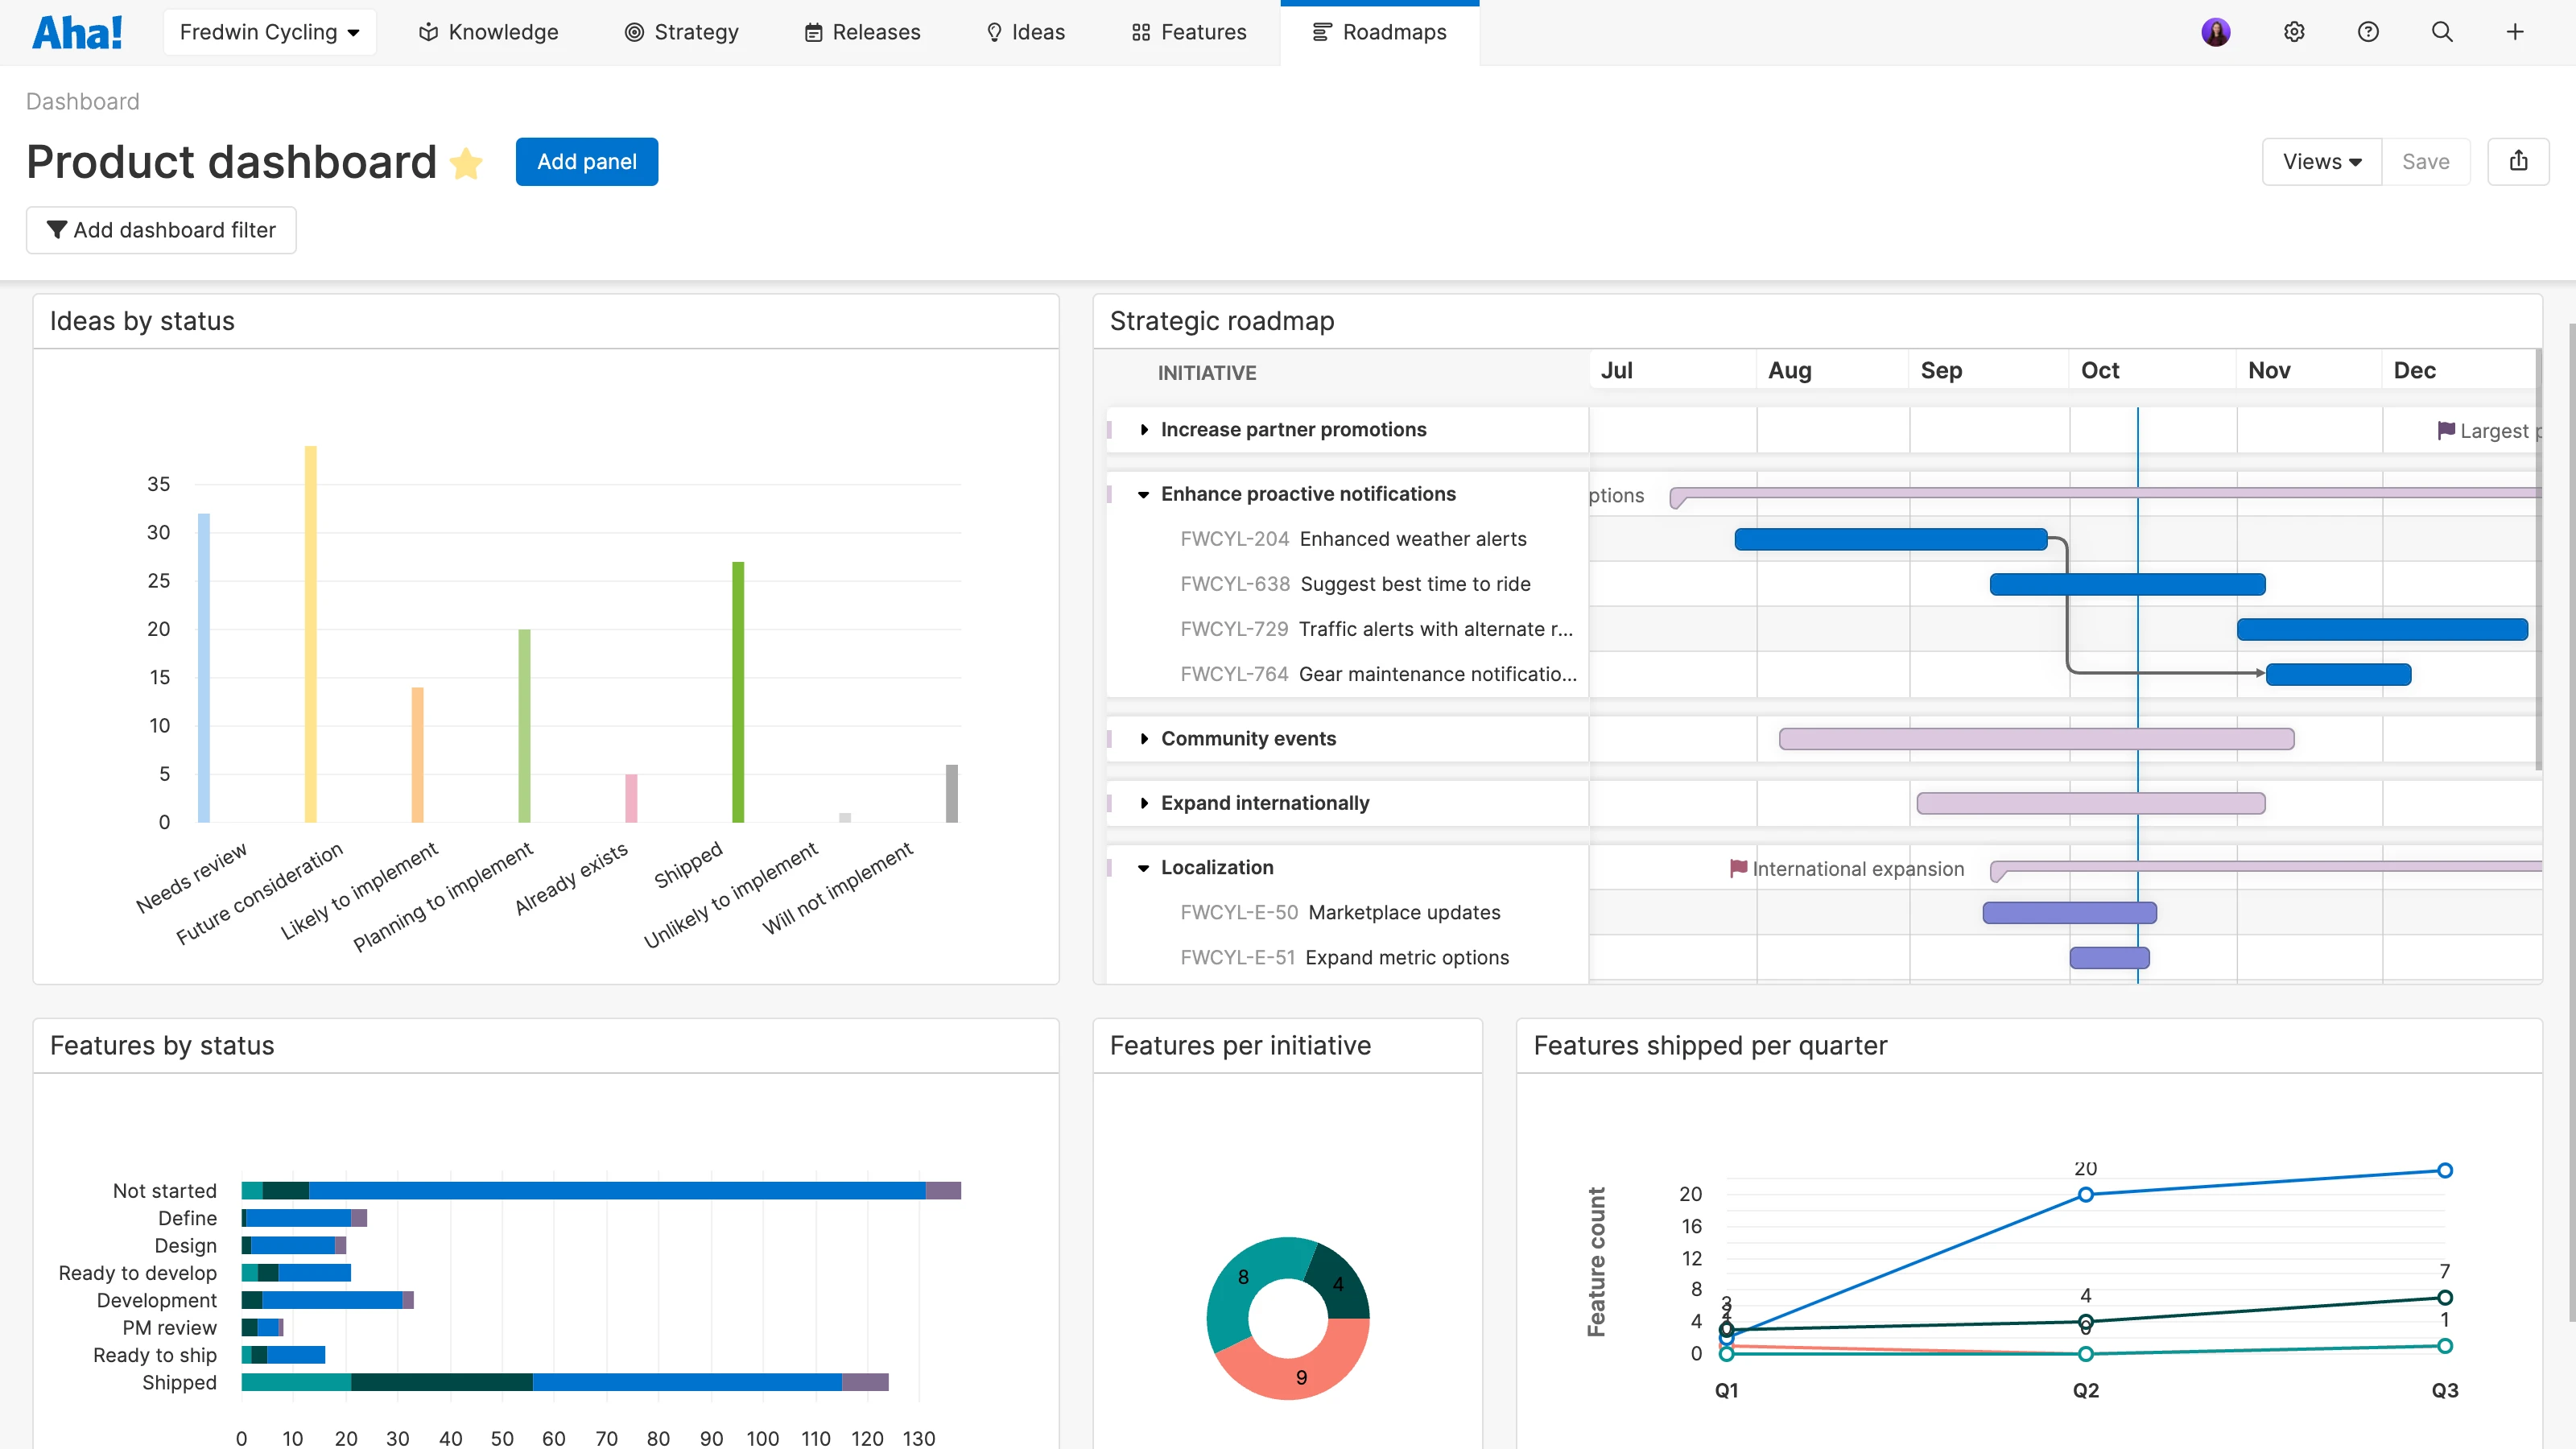
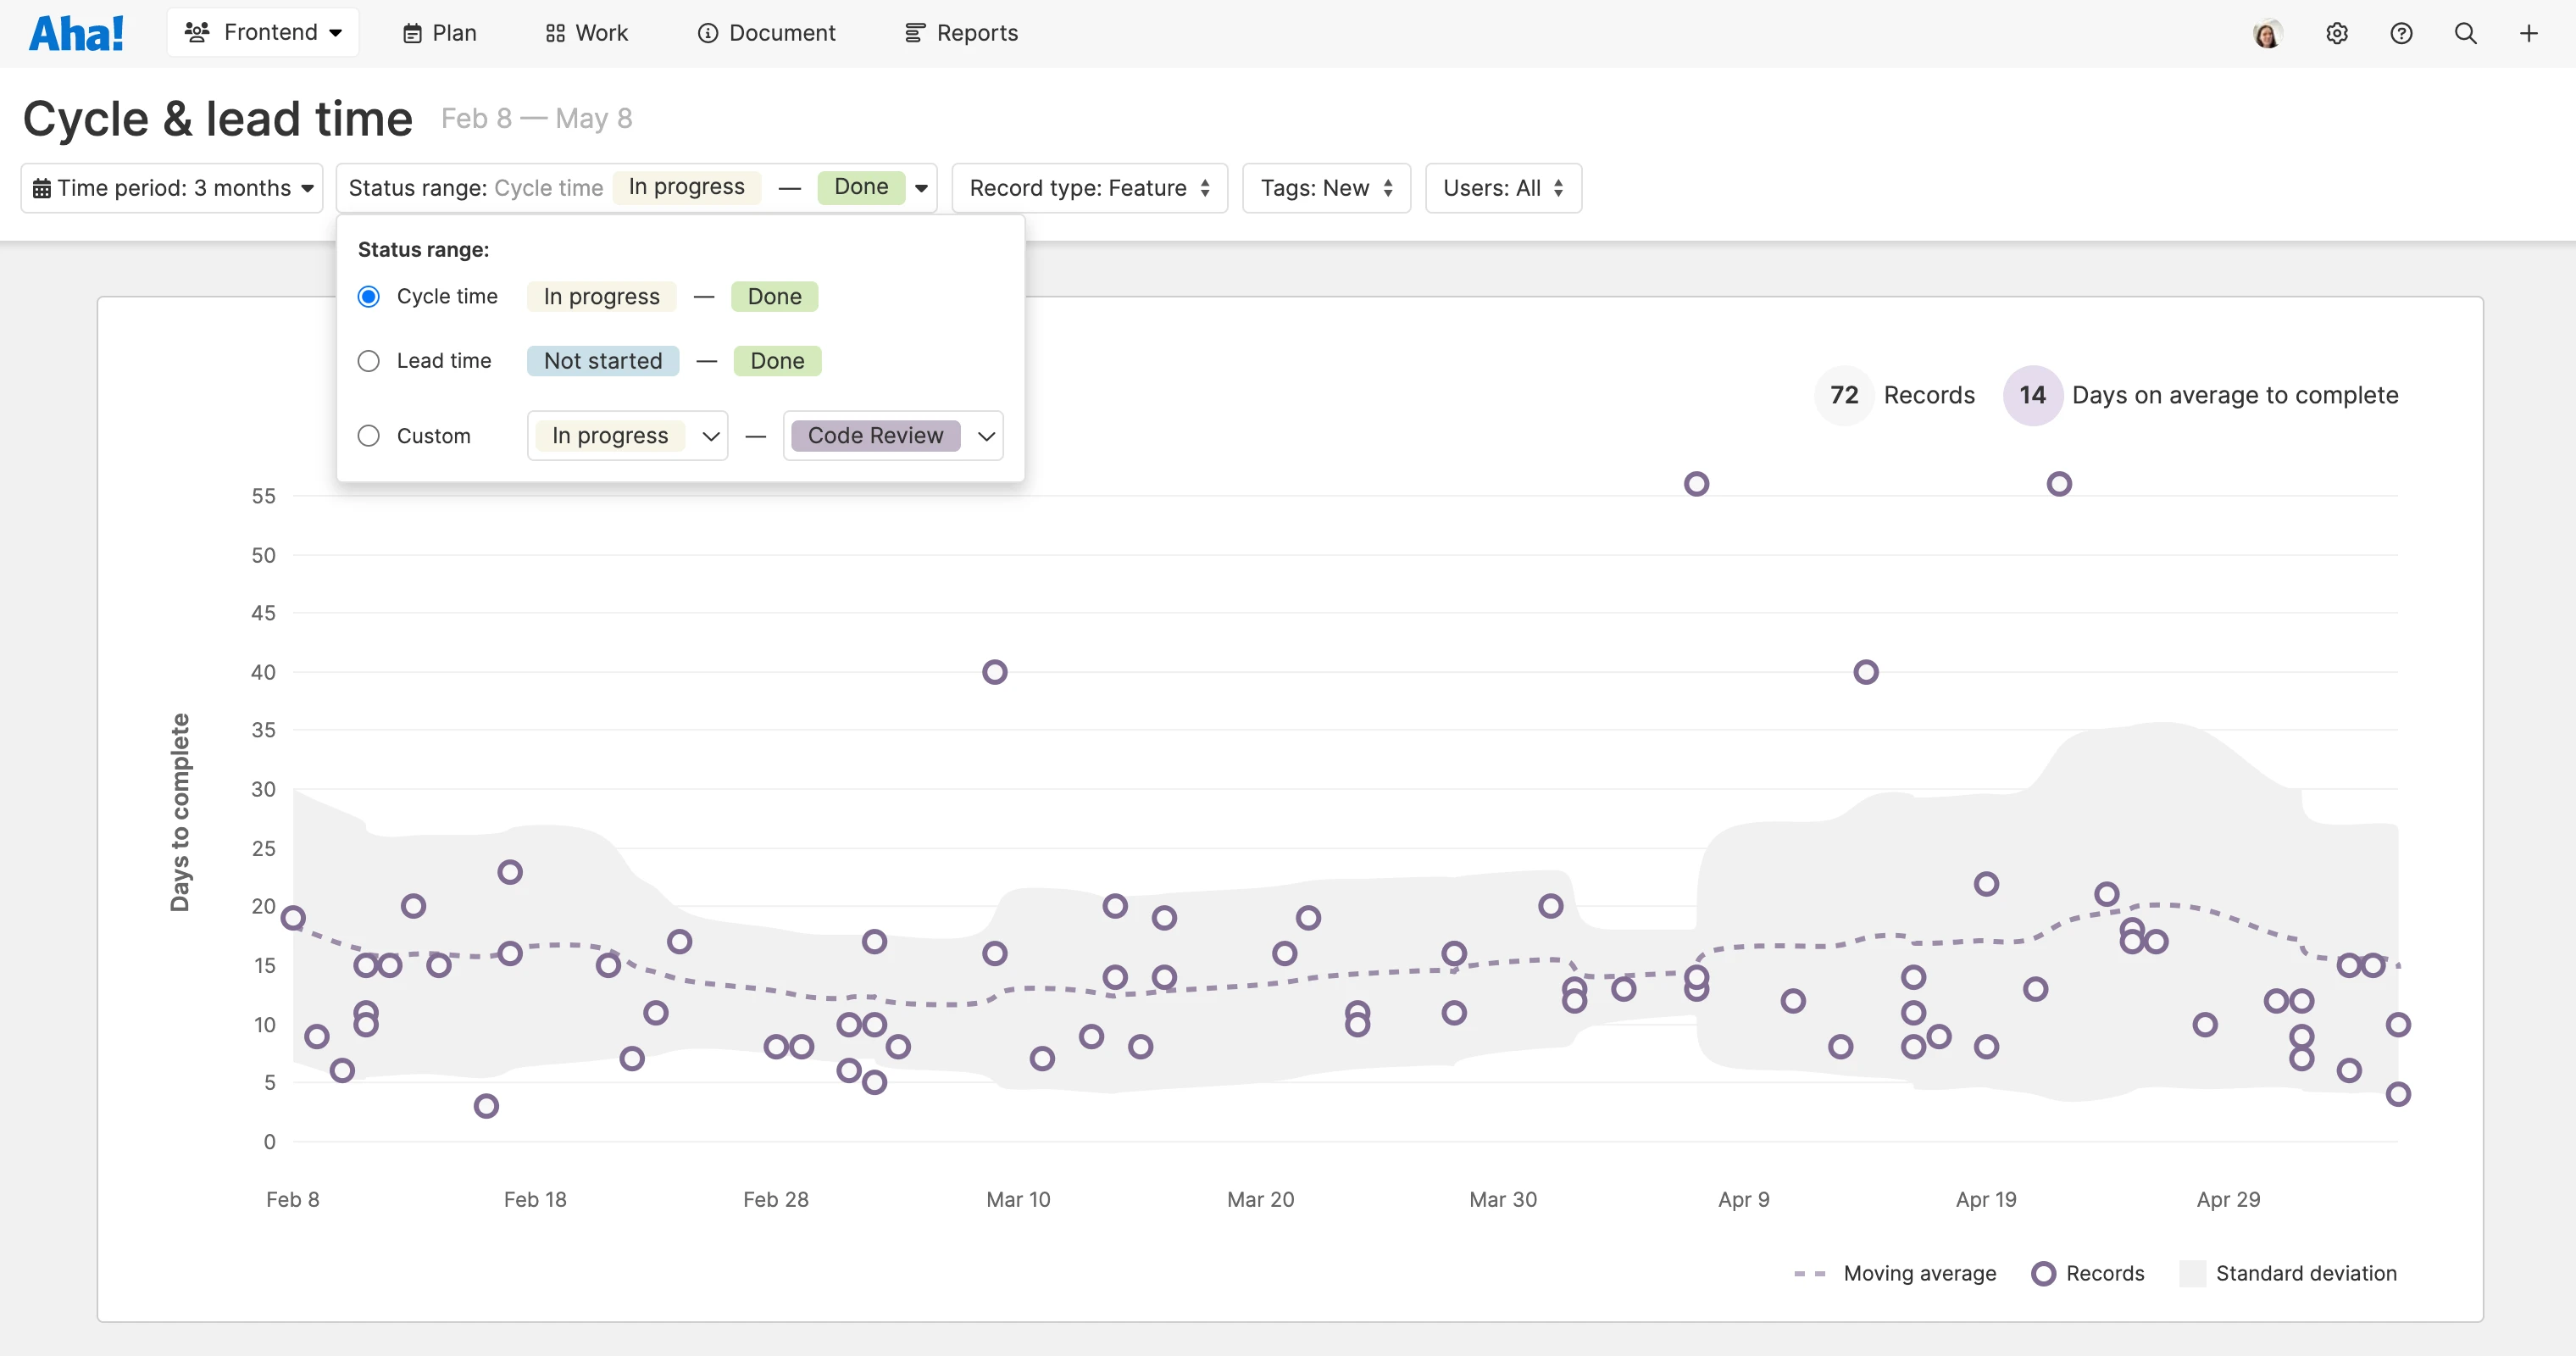
Improve planning
Use actual performance data to forecast what will be completed and when
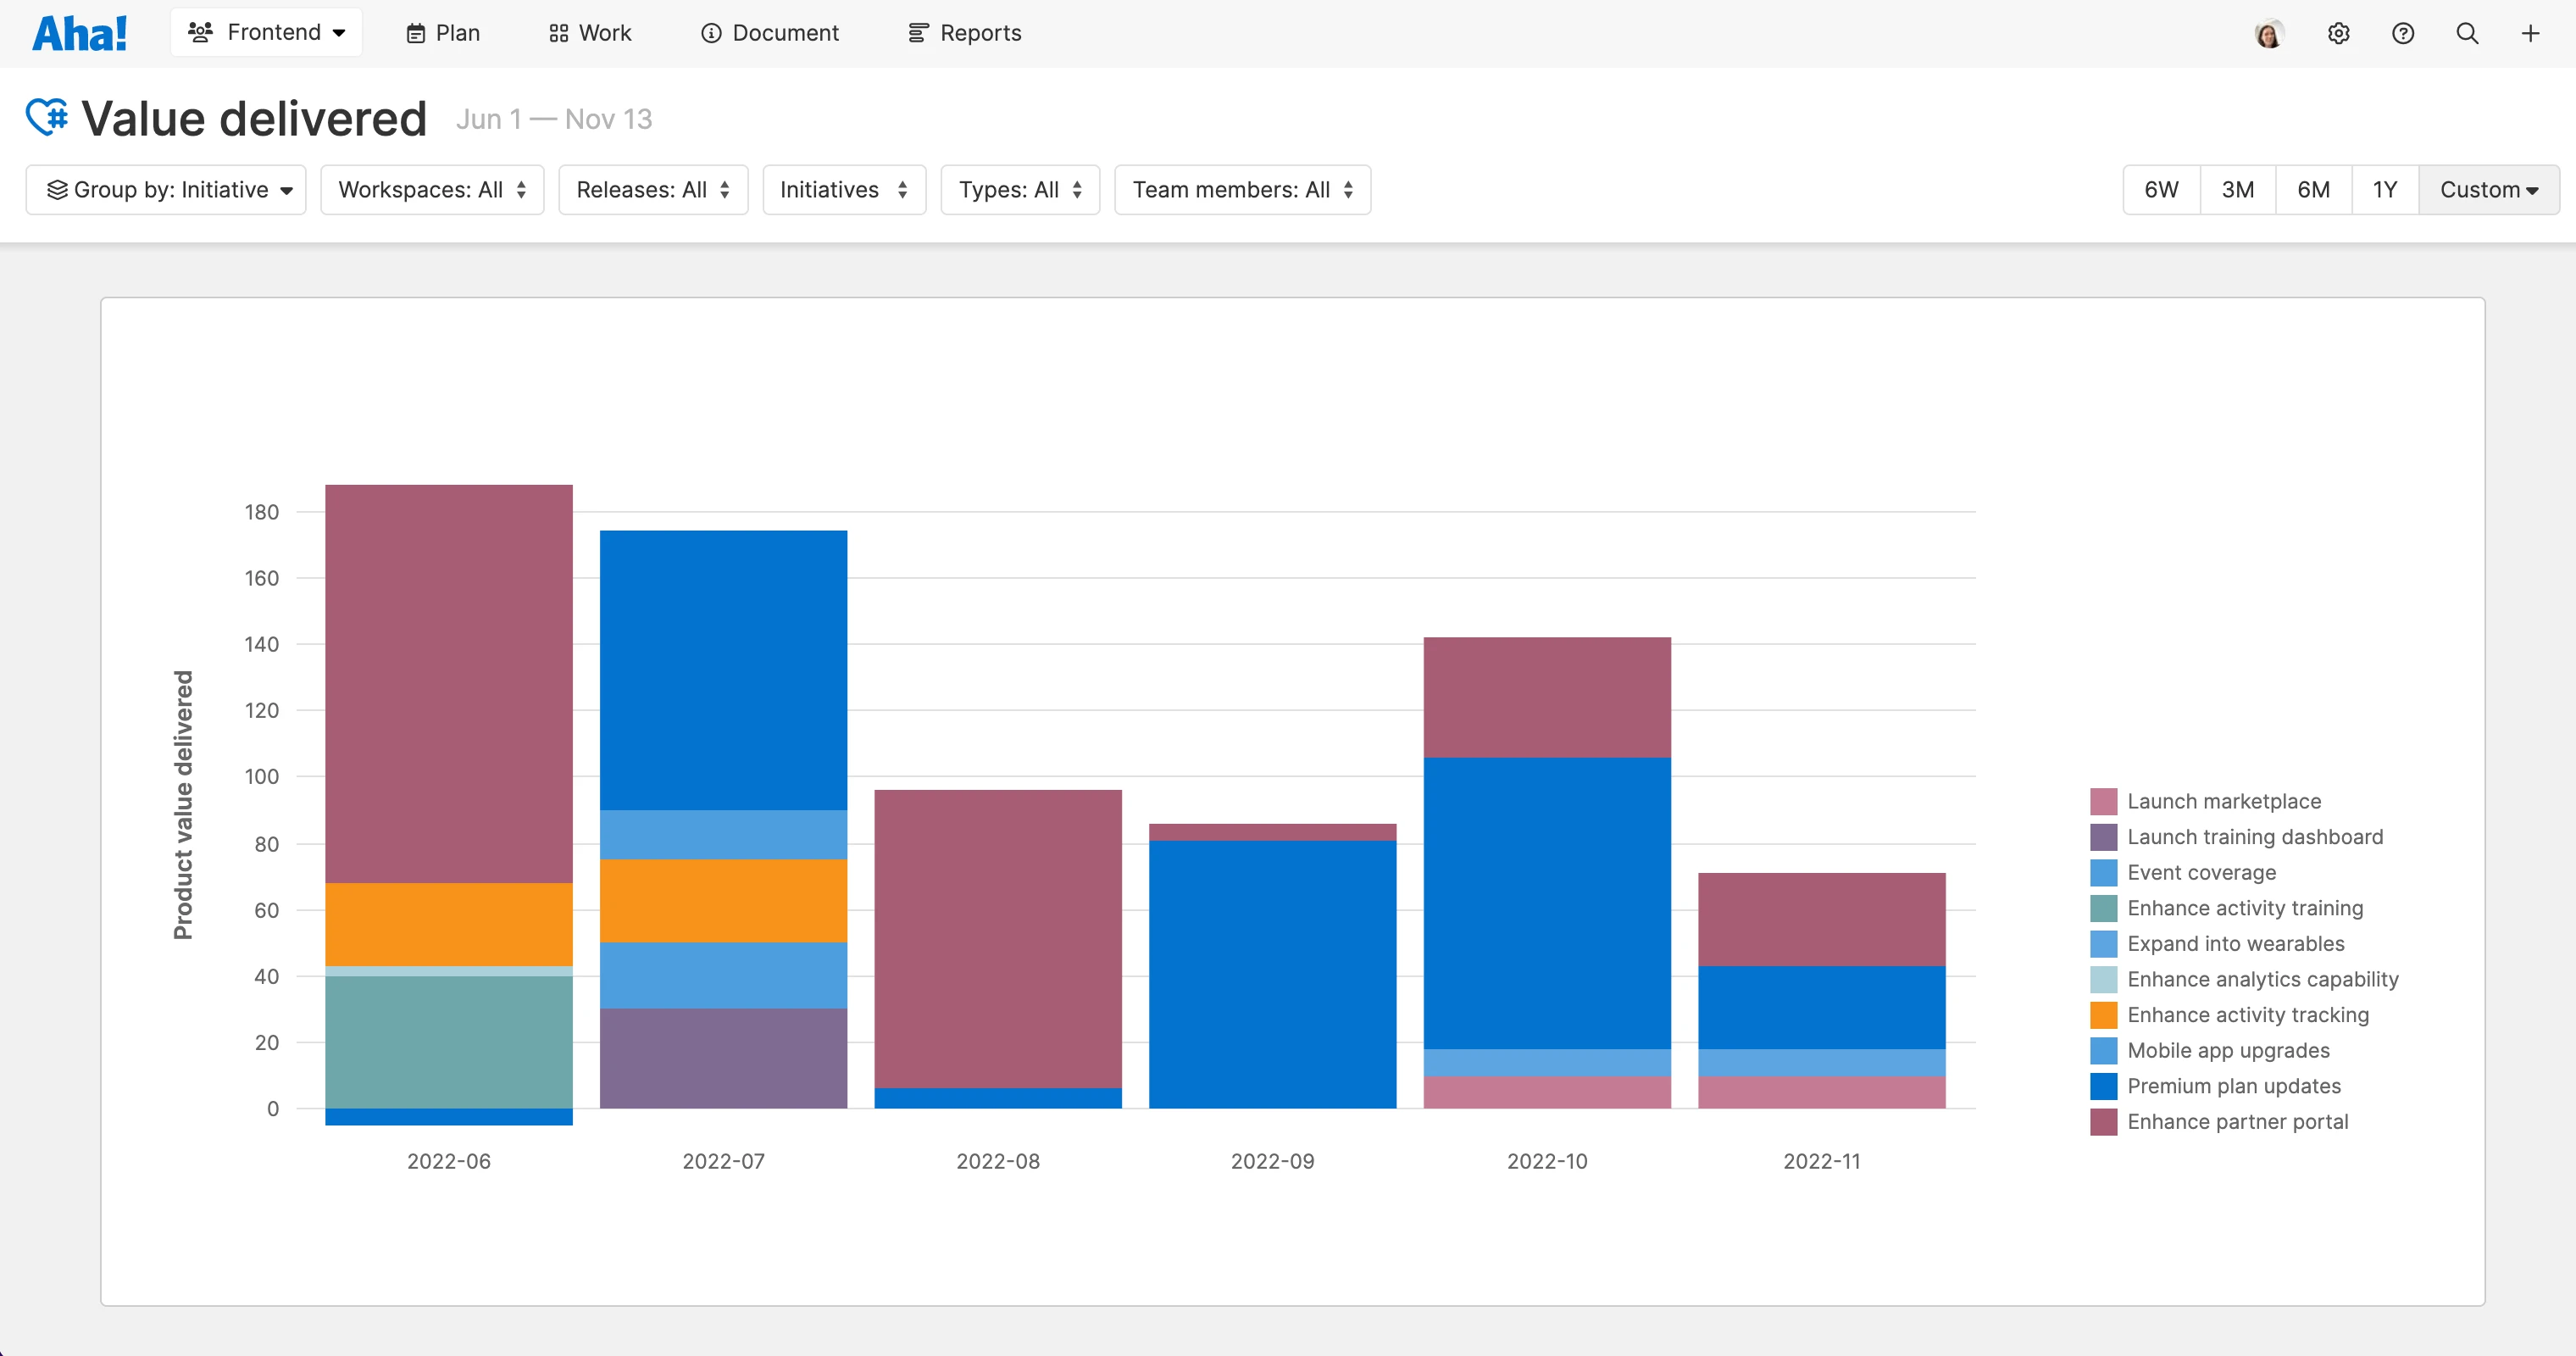
Achieve your best
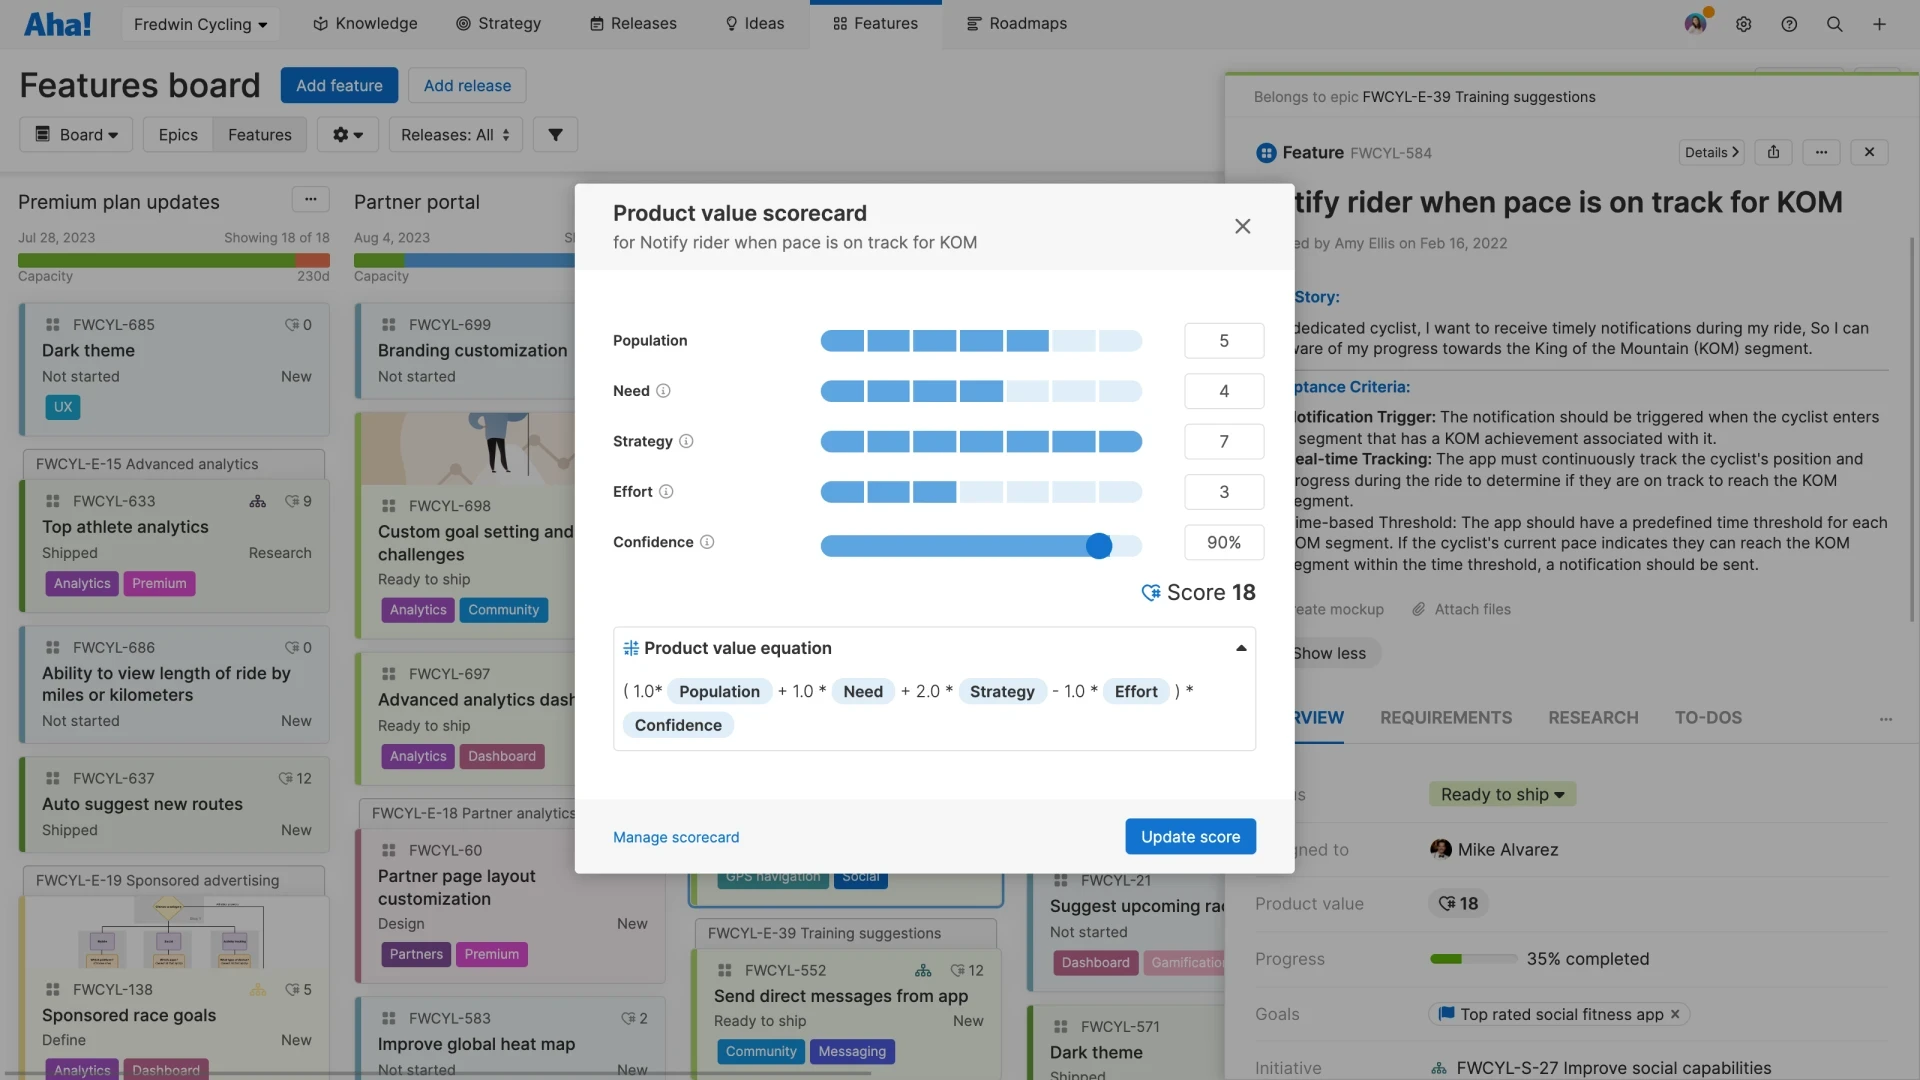
Identify opportunities to work more effectively and make a greater impact
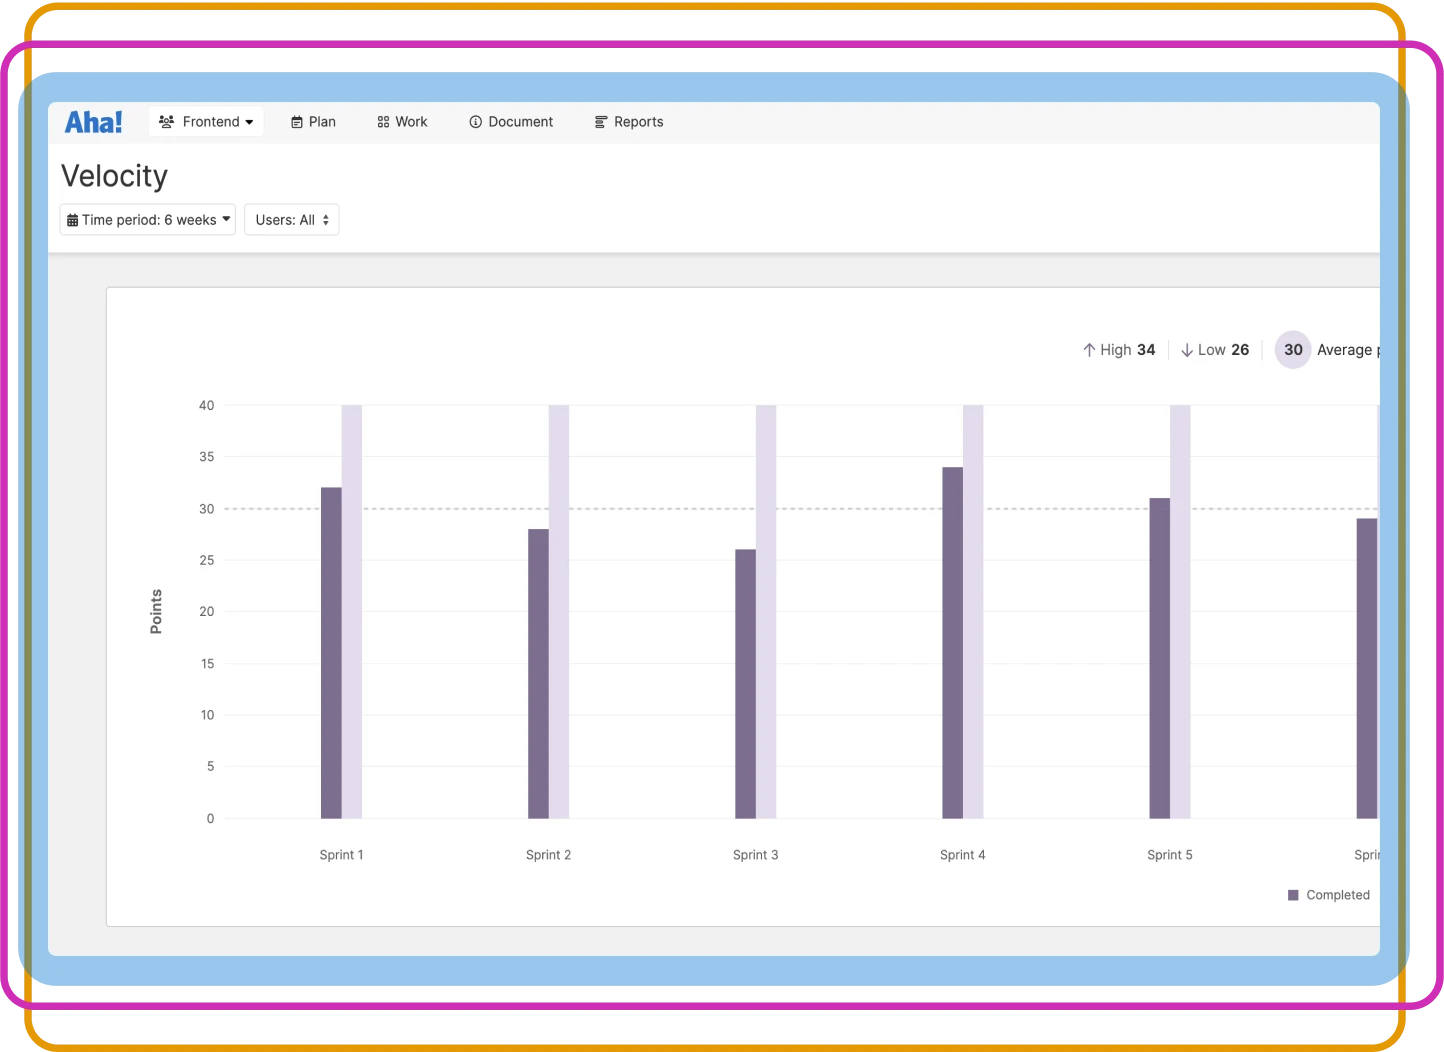
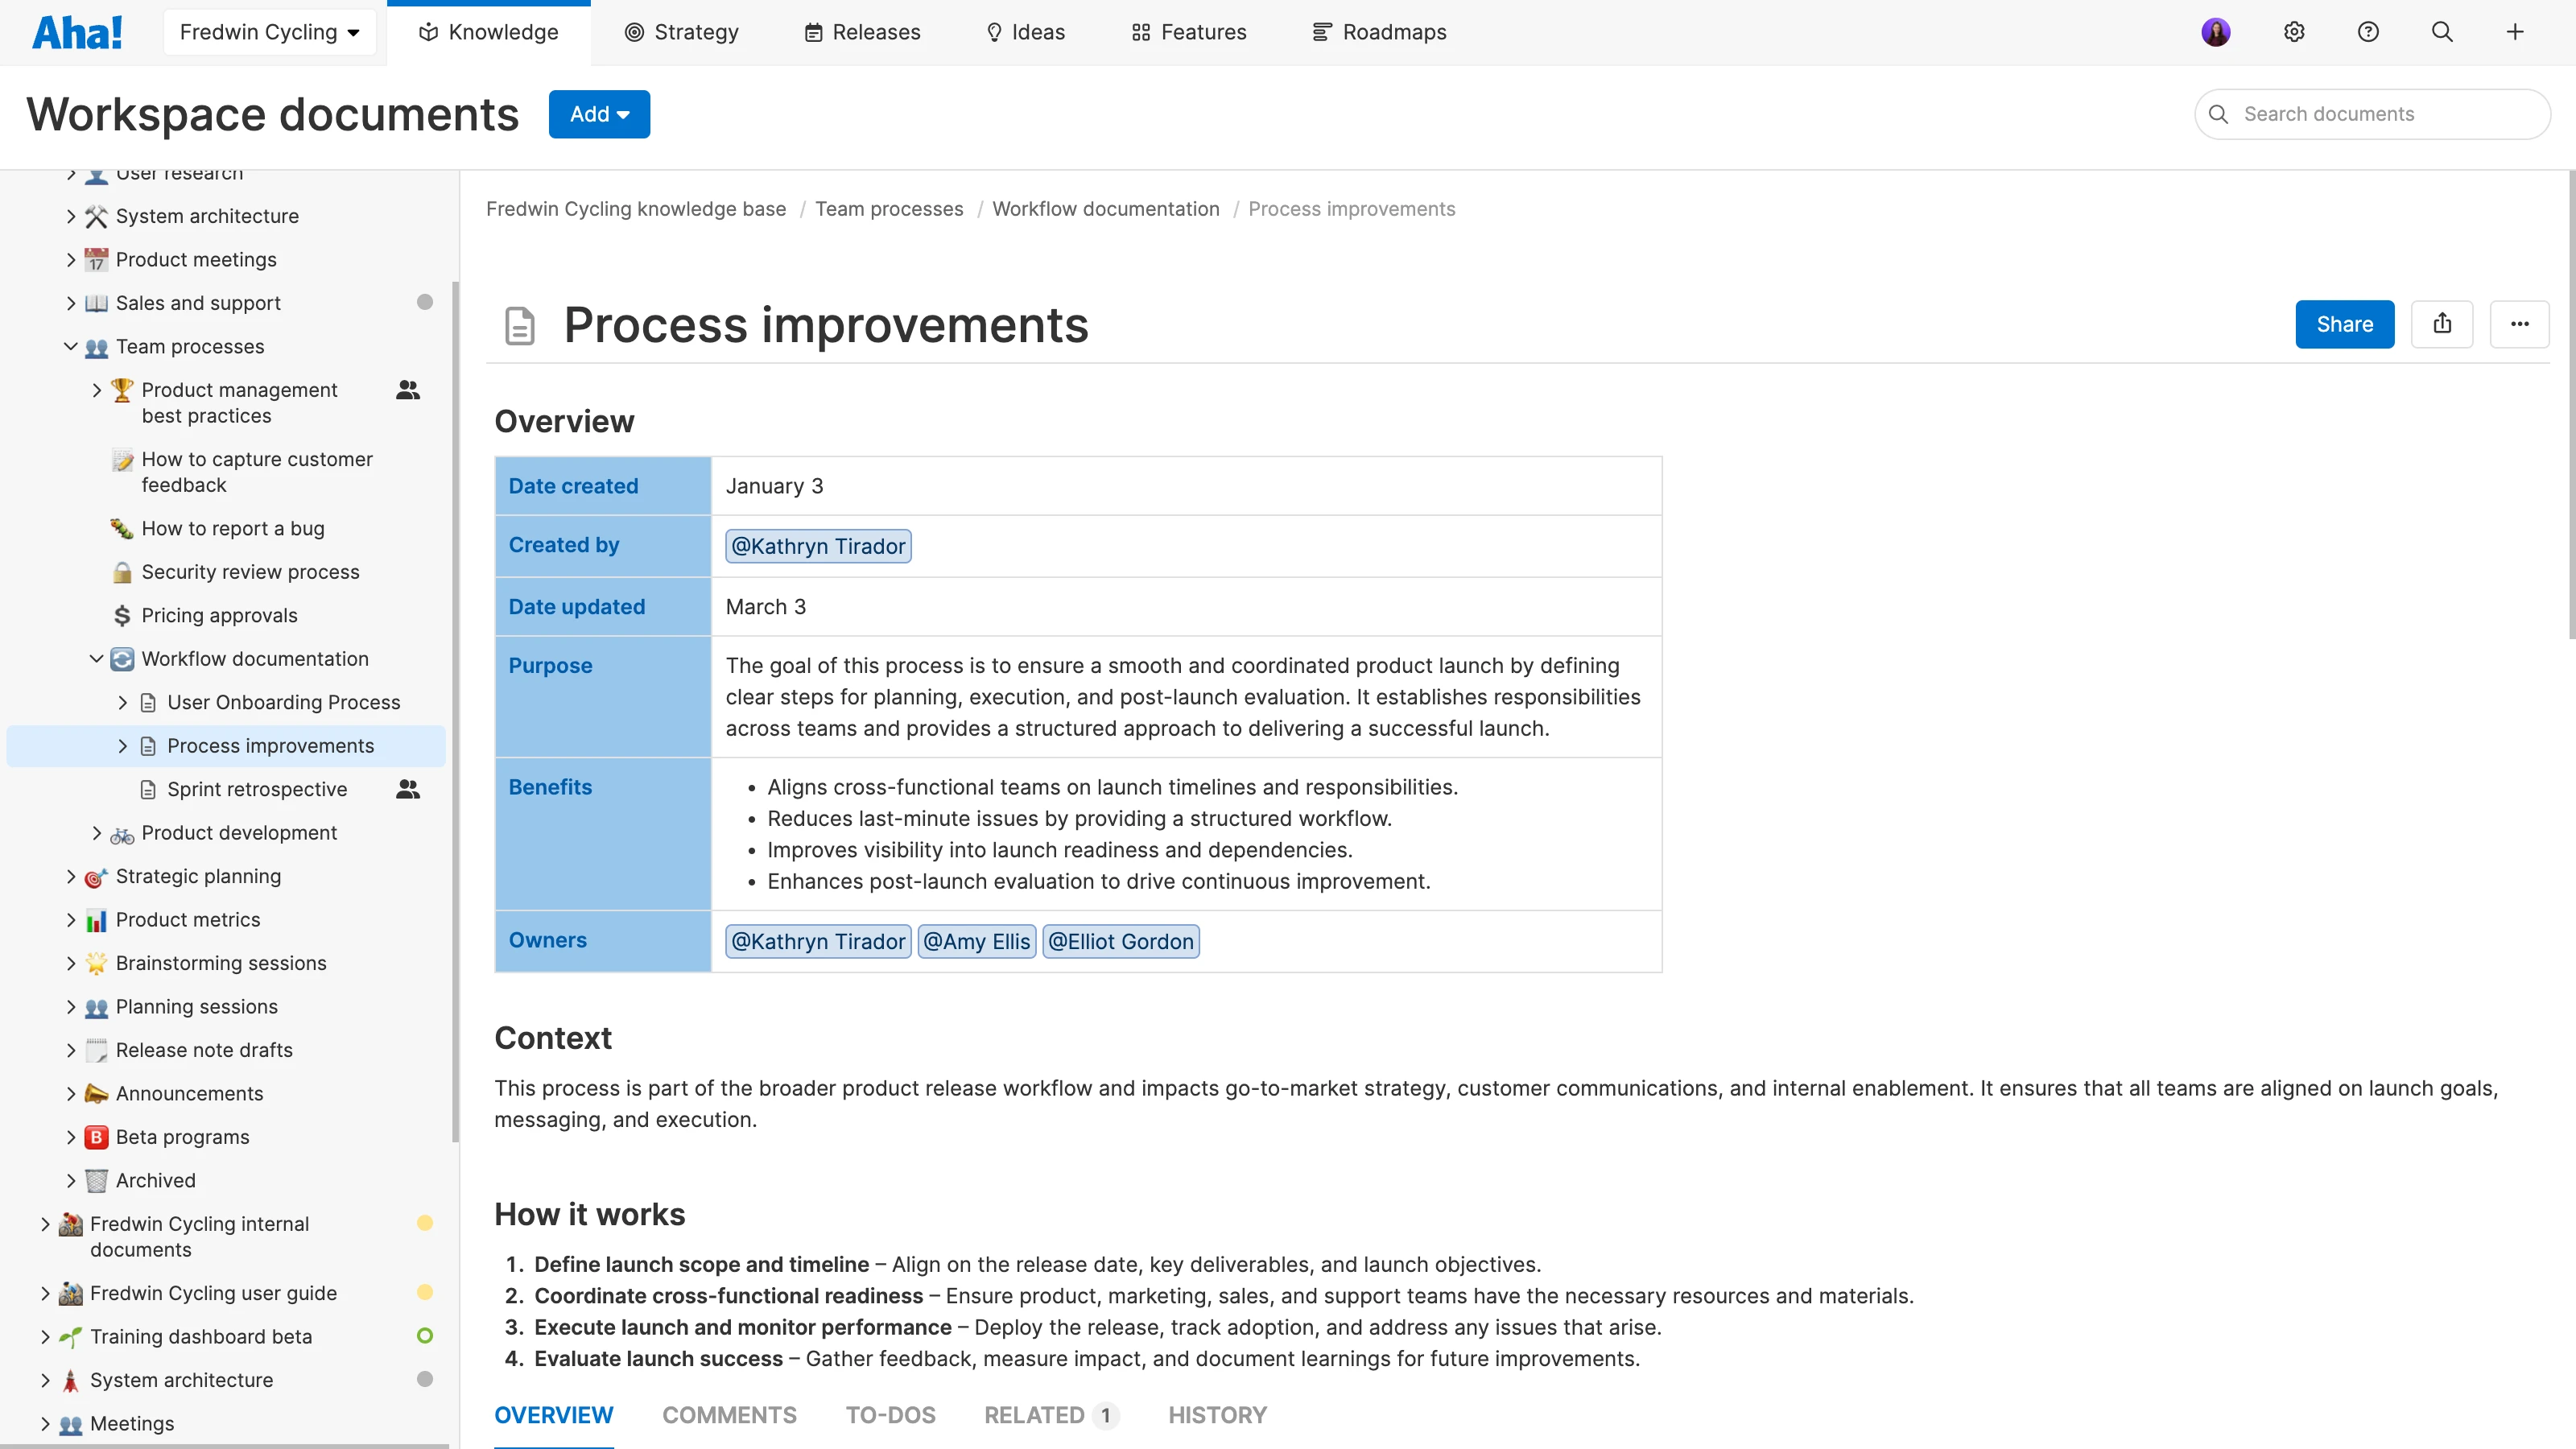
Understand delivery pace
Gain insights into how efficiently the team delivers value. Track agile metrics — like sprint velocity or weekly throughput — to see exactly how much work the team gets done. Look at performance trends over time to set a baseline and identify opportunities for improvement. The goal is to establish a sustainable pace that empowers teams to make a tangible impact.