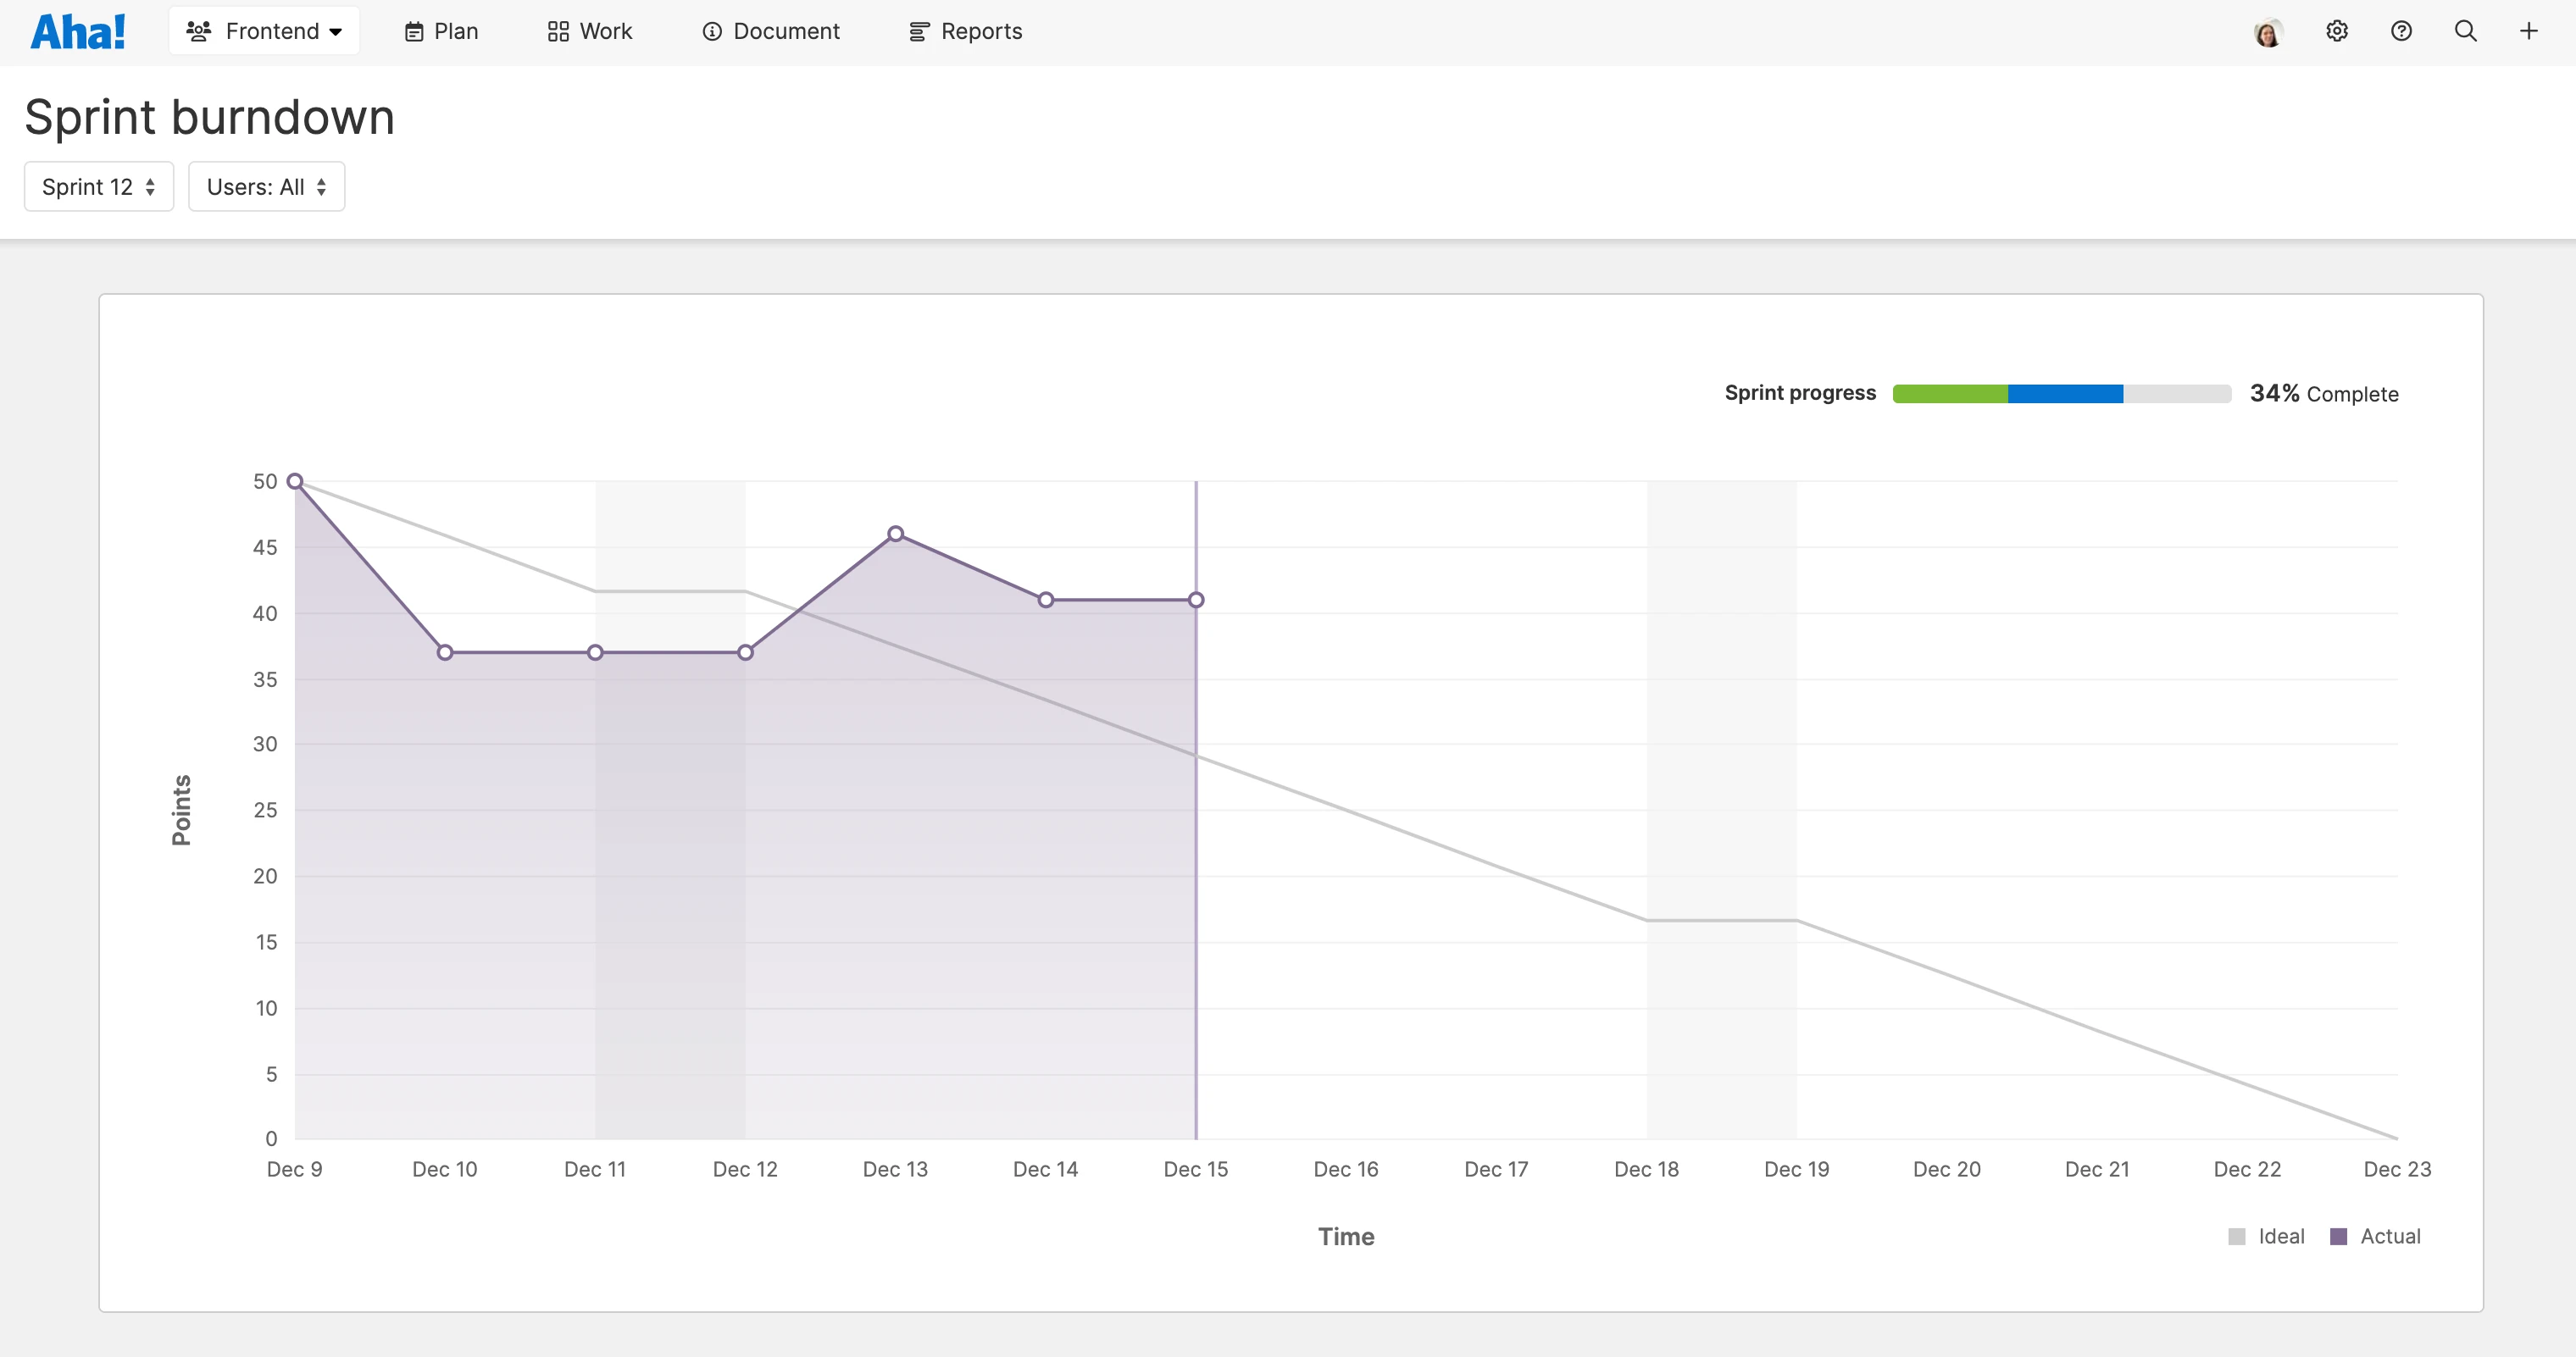
View the team's current progress vs. the ideal pace to complete all the work.
Visualize Sprint Progress With the New Burndown Chart


Do development sprints feel like a race against the clock? You aim to finish all the work you have planned — the team is expectant and committed. Of course you also have to honor reality. Estimations can end up being shorter or longer than actual work. As the sprint gets underway, you need to reconcile what has been completed versus what remains — so you can understand the team's pace and predict the likelihood of achieving your sprint goal.
The new burndown chart in Aha! Develop helps you track completed and remaining work for your sprint — so you can compare progress against the ideal pace to getting everything done on time.
Our new sprint burndown has all the elements you would expect from burndown charts — percentage of work complete, progress over time, and ideal pace. You can see work completed by day or filter to view work by individuals. These interactive elements make it possible to dig into the details of what is happening and review team and individual progress.
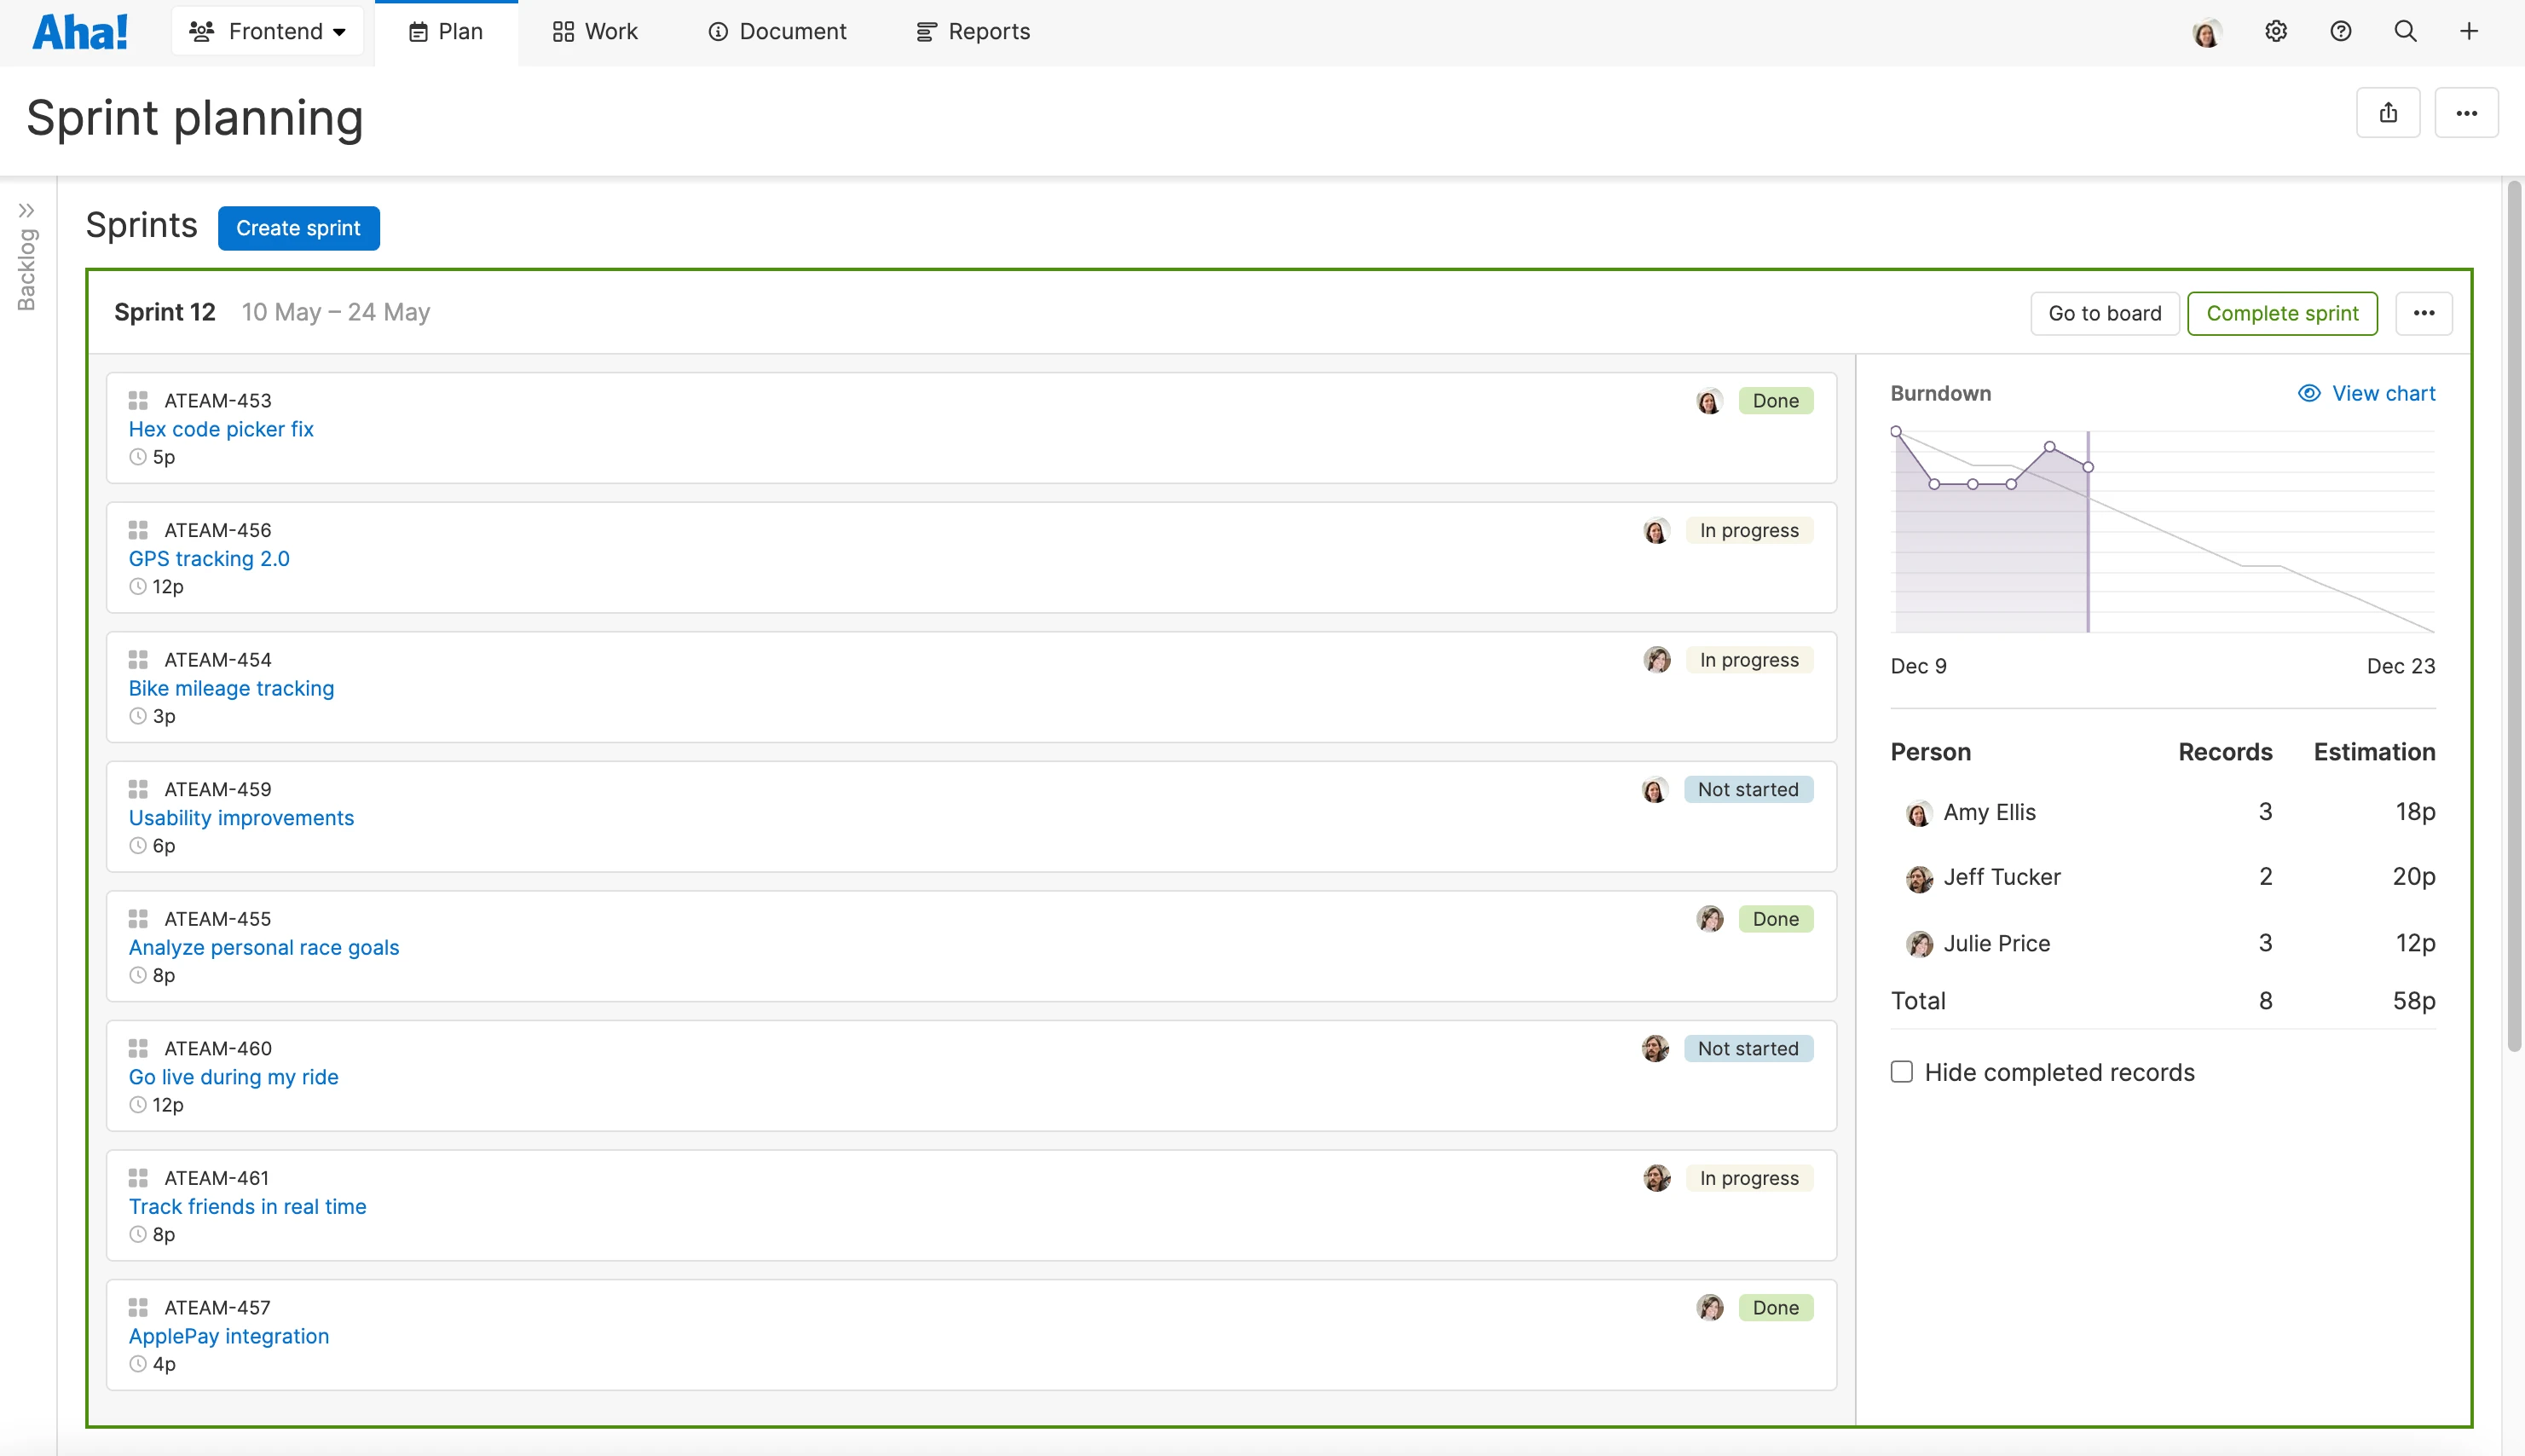
Teams on the Aha! Develop Advanced plan can view the new burndown chart in two places. Find a snapshot on the "Sprint planning" page or a full report with daily stats in the new "Reports" section of your account.
Let's take a closer look at how you can use the new burndown chart:
Plan your sprint
Start by scheduling your sprint and setting capacity in the unit of your choice — story points or time. Then estimate the effort required to complete relevant user stories and tasks. As you drag and drop work into the sprint, the available and planned capacity updates in real time — so it is easy to understand the team's commitment.
Track sprint progress
Monitor the burndown of the current sprint right from your sprint planning page. Use the visual snapshot to track how the team is progressing against the total amount of estimated work. In the example below, you can see that the team's progress is currently behind the ideal pace line. This gives us an early indicator that this sprint might be at risk.
Analyze burndown details
Let's click into the full burndown chart to better understand what is going on. Here you can hover over any day of the sprint to see what changed. In the example below, we can see that yesterday one user story was completed, but two record estimates changed — adding more points to the sprint. This helps the team assess whether they can still complete everything on time or if they need to adjust the plan.
Rally the team around your sprint goal and celebrate each success with the new burndown chart.
Explore your sprint burndown today and use it to keep the team informed of progress. And if you would like to trial this advanced functionality in your Aha! Develop account, just email us at support@aha.io and we will get you started right away.
Sign up for a free trial of Aha! Develop — work the way you want
Aha! Develop is a fully extendable agile development tool — completely customize how you work through extensions. Sign up for a free 30-day trial or join a live demo to see why more than 500,000 users trust our cloud-based software to build lovable products.