New Workspace Filters in Dashboards


Seeing the results of your work is satisfying. Reporting dashboards help you track all of your key performance indicators on a single page. And we just made a great improvement for those of you that need to monitor multiple products or projects at once.
You can now filter dashboards to monitor key metrics across workspaces in Aha! Roadmaps.
Dashboards are ideal for bringing KPIs together in a single view. You can include nearly any report as a panel, arrange the layout, and share your dashboard. This makes it easy to monitor the momentum of products and projects and keep others informed.
Many of you love using the same dashboard format across teams. Previously, you would bring together a standard set of reports, apply a workspace filter in each panel, and then save several versions. But this approach quickly became unwieldy with a large portfolio.
So we added a workspace filter to dashboards. This makes it possible to use the same dashboard across multiple teams, while giving each team the ability to view only the data that is relevant to them.
Let's take a look at how to build, filter, and share a dashboard across teams:
Establish consistent KPIs
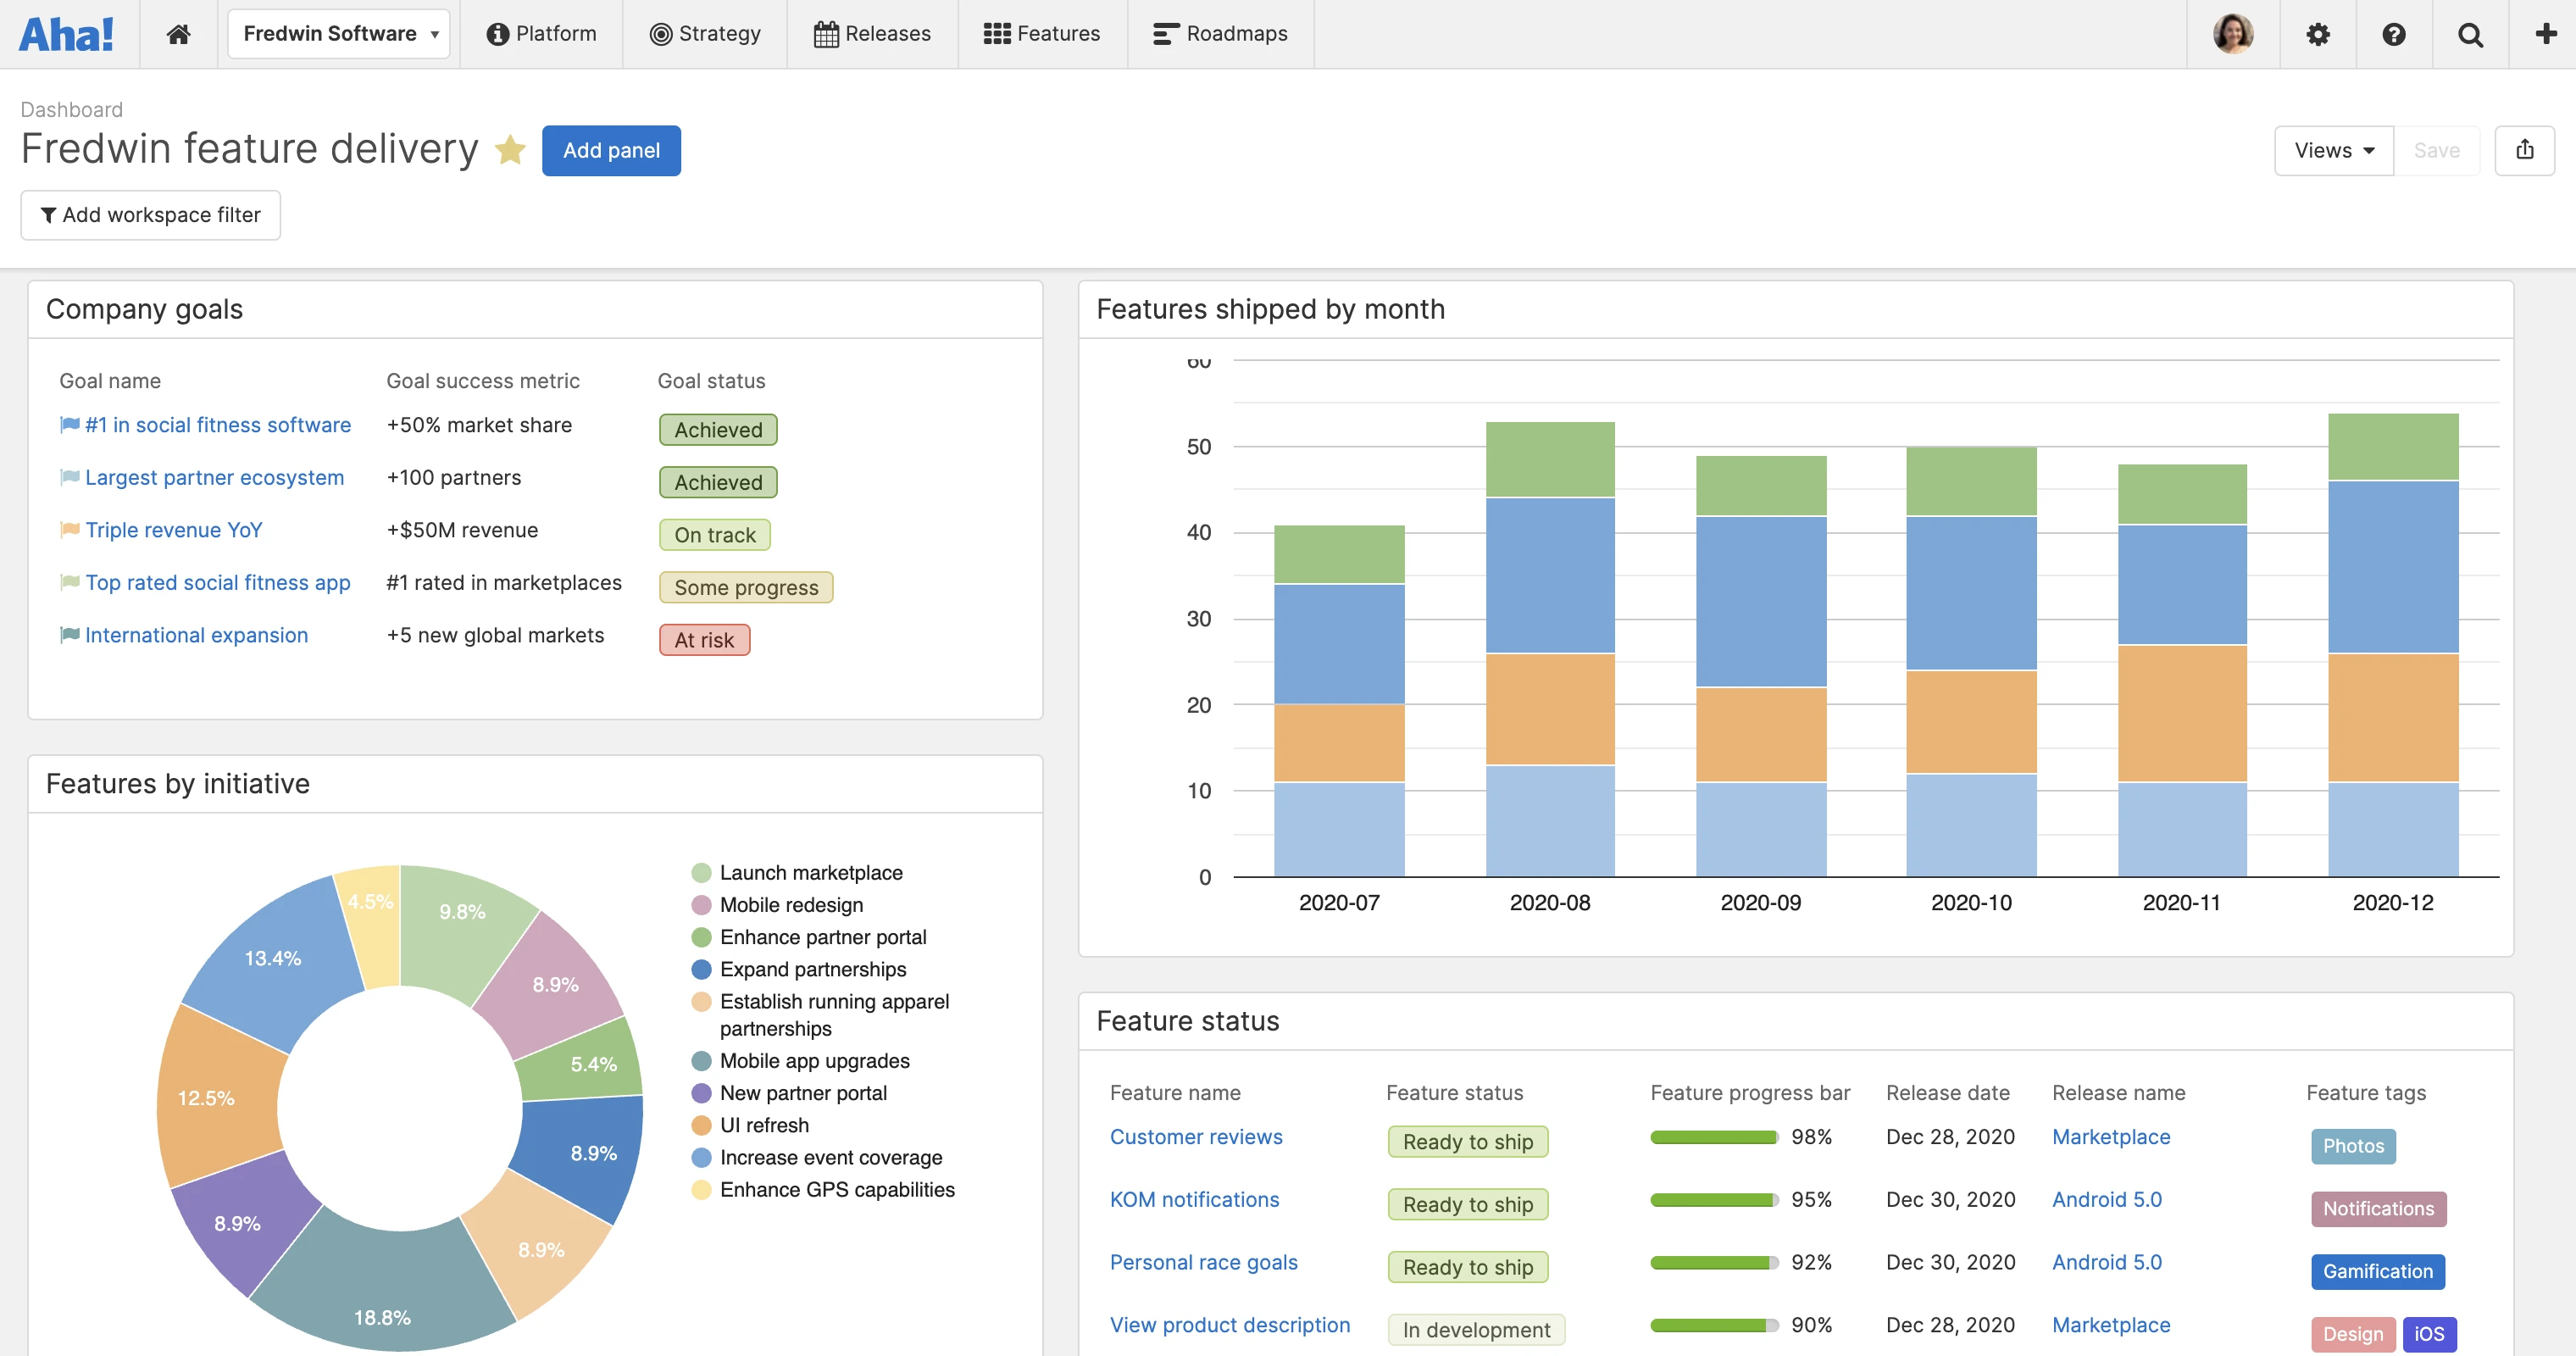
Create a dashboard for monitoring progress. In the example below, we added panels to show features planned by initiative, the status of features, and the number of features shipped each month. You will want to make sure that any custom fields and filters you include in each panel apply to all the workspaces you want to report on — so you can track in a consistent way.
Add workspace filters
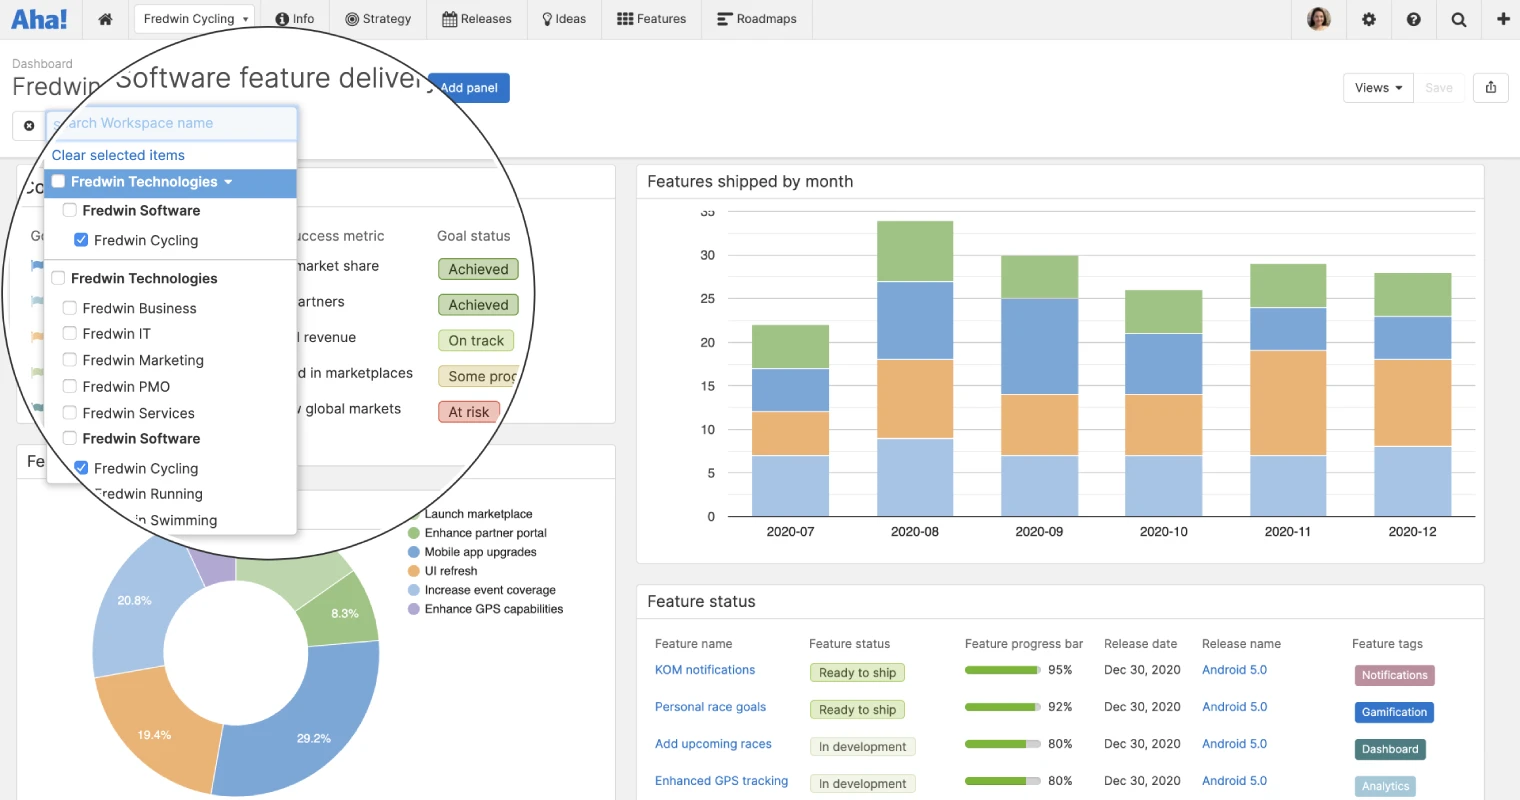
Now that you have a standard set of panels, you are ready to filter by workspace. When you do, the panels automatically update to only show data from that workspace. Want to ensure a certain panel always shows the same information? You have the option to override the dashboard filter in the panel configuration settings. This is useful if, for example, you want to always show the same set of portfolio-level goals on your dashboard.
Share your dashboard across teams
When you are ready to share your dashboard, select which parent lines or workspaces you want to make it available in. We recommend setting the editing permissions to "view only" so all teams use a standard format. Viewers can then update the workspace filter to focus on the relevant product(s). When they do, a working copy will be made of the filtered view — so everyone can see the data they need without impacting each other.
Telling a consistent story across your portfolio will help the team draw meaningful conclusions — together.
Establish a standard dashboard and share it across the team to elevate conversations about strategic plans and progress. And when you are certain that everyone is tracking those key metrics in a logical way you can make even more informed decisions.
Sign up for a free trial of Aha! Roadmaps — plan the future
Aha! Roadmaps is the best way to set strategy, prioritize features, and share visual plans. It includes Aha! Ideas Essentials for crowdsourcing feedback. If you are not already an Aha! customer, sign up for a free 30-day trial or join a live demo to see why more than 400,000 users trust our cloud-based software to build lovable products.