Just Launched! — Aha! Reports Help You Analyze Everything Product Management


We just gave you the power to report on everything product management. Yes, everything. We are very excited about this launch because you are finally able to rid yourself of spreadsheets for analyzing and reporting on what the product team is doing. We only wish that we had been able to use this functionality ourselves while managing products over the last ten years.
We just launched the new Aha! Reports
We serve over 20,000 users now and many of you have told us that you want to be able to create custom lists, tables, and charts. You want to do this to share your thinking and roadmaps internally and selectively with customers. You also want to be able to report on and analyze what is planned across the entire product portfolio.
We already give you the ability to create list tables that contain info about Ideas and one for Features. And the existing Pivot table was a good start, but it was not powerful enough to do everything that we or you wanted. So, we decided to build the new Aha! Reports. It includes an entirely new engine for creating list and pivot tables. And the key is that it is cross-product and cross-data.
Powerful New Analytics
It is now possible to report on any Aha! data object. You can build a List Table or Pivot Table from over 100 metrics in Aha! including: strategy, releases, ideas, features, to-dos and custom fields. Awesome.
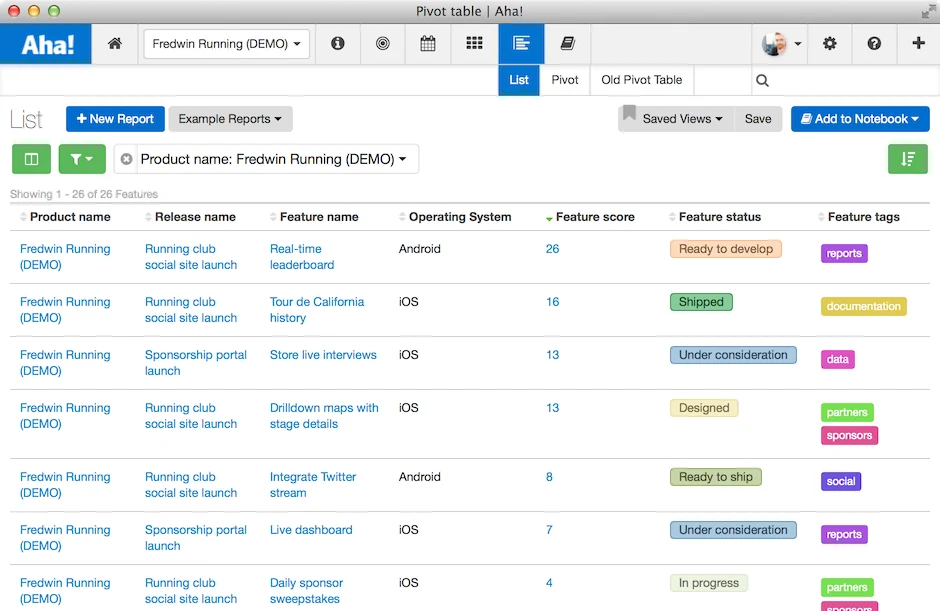
Generate list table views Create custom lists to share data about your roadmap and answer difficult questions, like, “show me the highest ranked mobile features across my product portfolio.” That’s now easy. If you use custom fields in Aha! you can add them as a column as well.
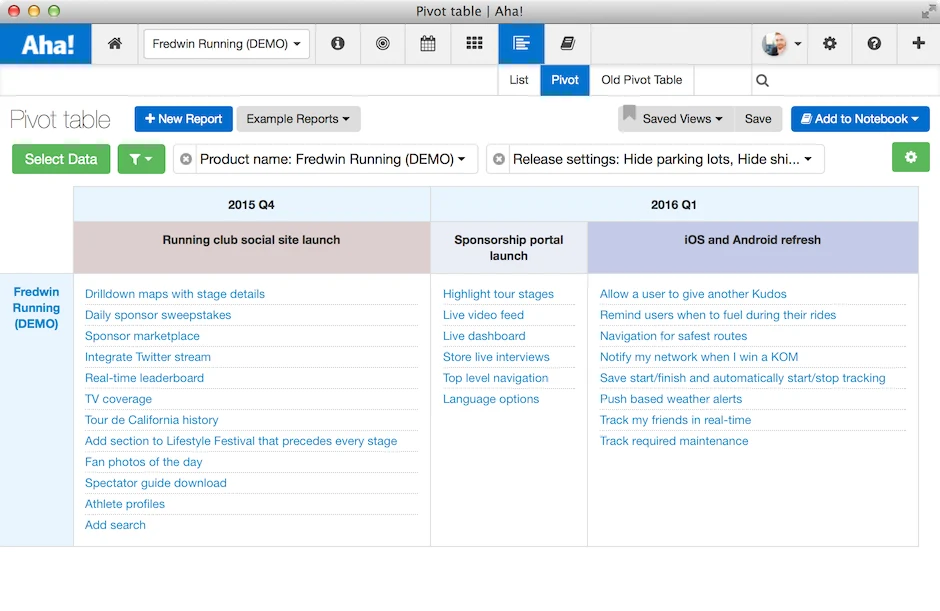
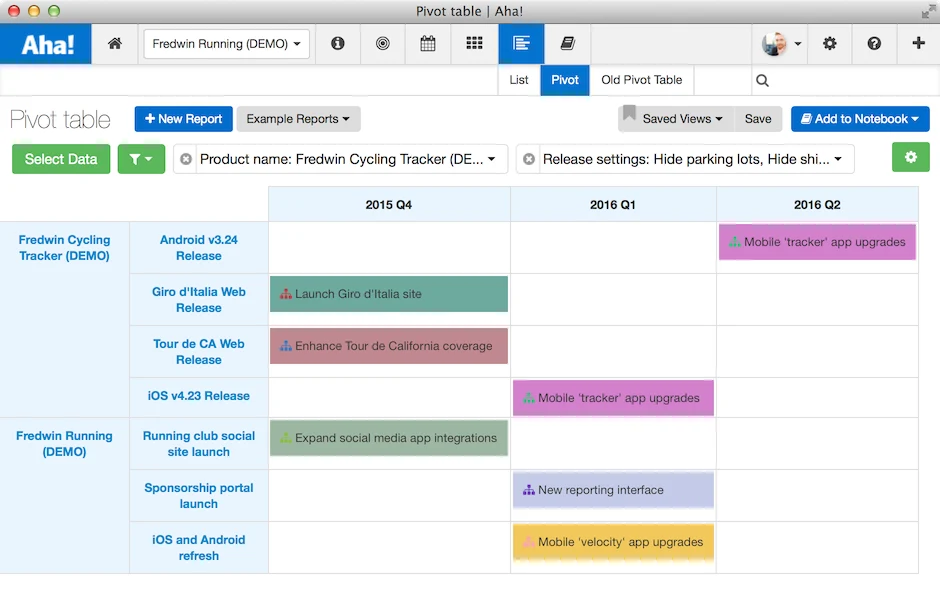
Generate pivot table views We have taken the existing Pivot table to an entirely new level because so many of you use it and have asked to be able to report on more of the data that you have in Aha! We have also included several example templates for reporting including Feature by Release, Release by Product, and Initiatives by Quarter. We hope that these help you get started and provide inspiration to create your own custom views.
Note: the existing Pivot table will be available in Aha! until August 30. Use the time to recreate any old Pivot table views in the new Pivot table. Saved views in the old Pivot table will not be available to use in the new Pivot table.
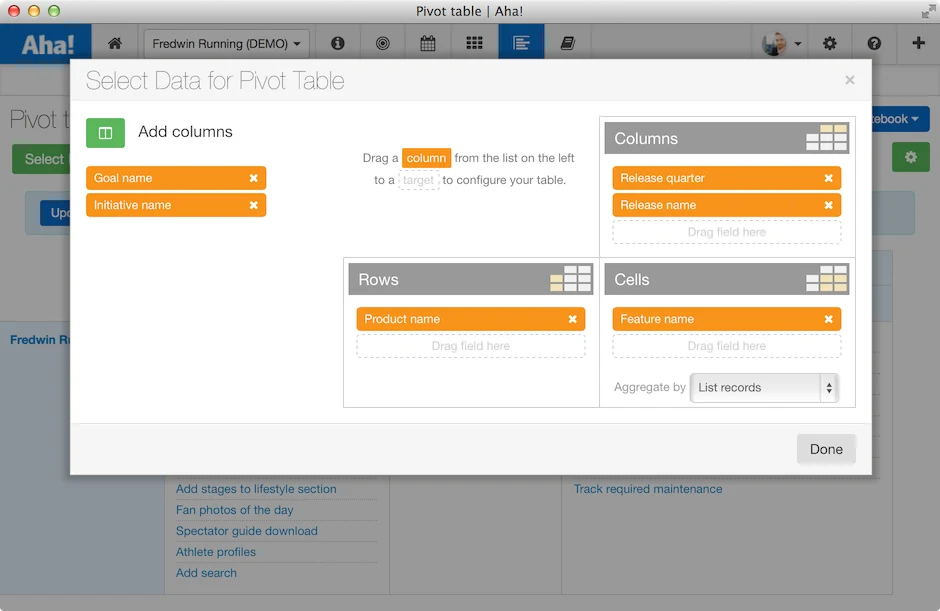
The powerful new Pivot table engine To get started building a pivot table navigate to the Aha! Reports tab. You can choose from several popular reporting options or build your own. To build your own just click the Select Data button on the Pivot table screen to select the data for your Pivot table.
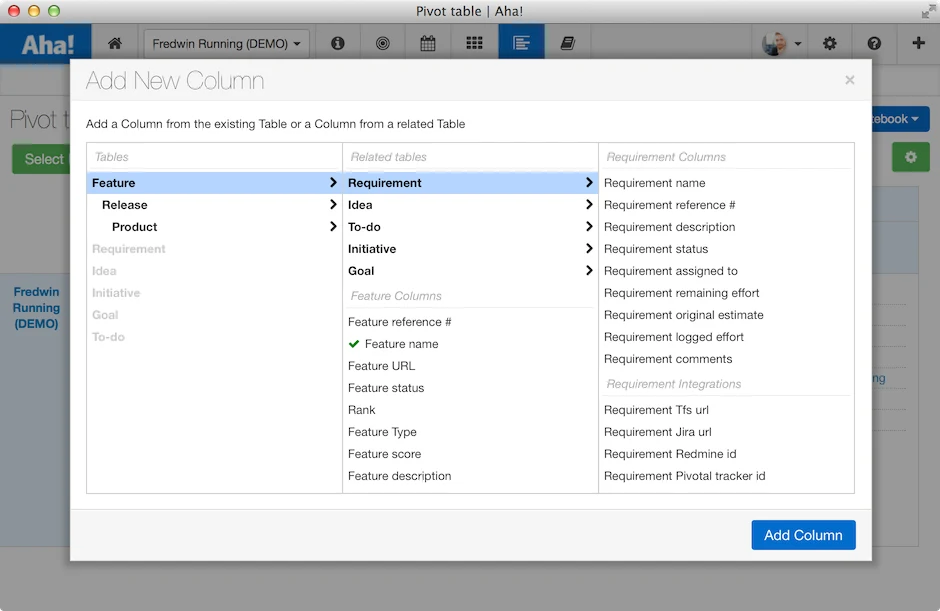
Select the Add Columns button to choose from more than 100 data objects in Aha! including any custom fields that you want to add as well.
The following is important to note when selecting your data. Start by thinking about what you want to report on and choose the object that is primary to your report. For example, if you want to create a table about Features, start by selecting Features. You will then be able to select columns that relate to the object that you already selected (in this case Features).
Customize the Table to Match Your Style
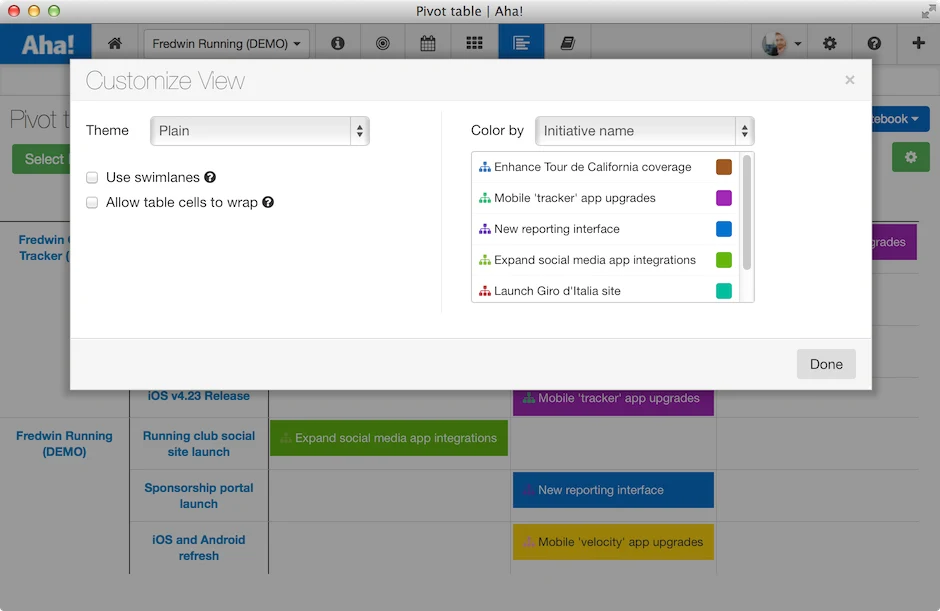
The new Aha! Reports are more beautiful, easier to use, and allow you to better customize the view so it is perfect for your audience. You can choose from multiple styles and themes for your Pivot tables based on your preference and company brand.
Style options Select different pre-set themes and/or adjust individual colors on your Pivot tables. You can adjust colors to match names, status, custom fields, and more. Just click the green Settings button on the upper-right of the Pivot table to view style options. You can also choose to color your table by any of the objects that you have selected.
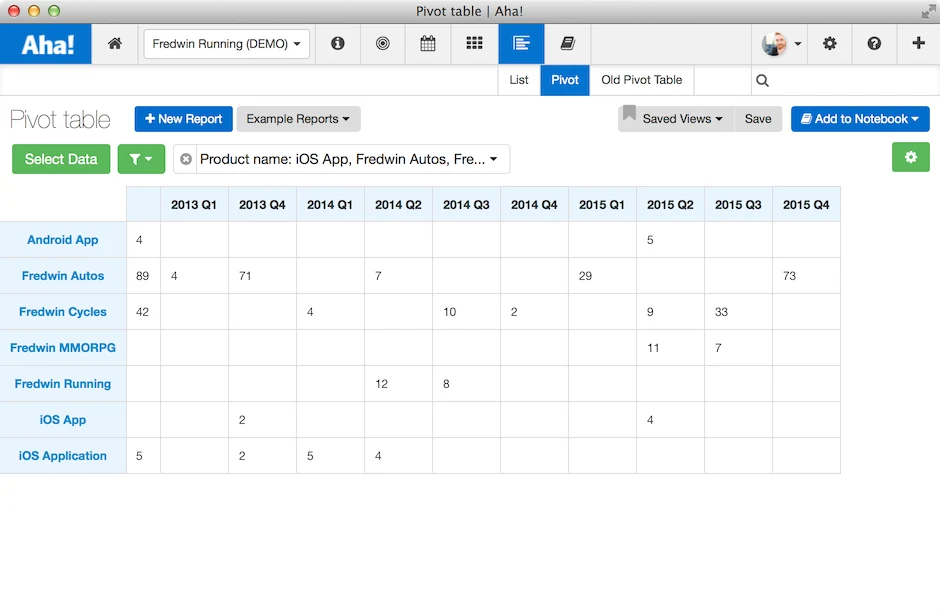
Do math too When you need to perform a quick one-off data analysis, Aha! Reports are your best friend. You can create reports to answer any question, such as “How many features are planned by quarter in the next year?” In this example we used the Aggregate by capability in the cells section of the Select Data for Pivot Table screen. We selected Sum values to add up the releases by product and quarter.
We Moved Some Screens Around to Make This Possible
As you can probably tell by now, Aha! Reports is like nothing that has ever been built for product management. In fact, it gives you the power to report on just about anything that is related to your product development efforts.
If you get it in Aha!, you can analyze and report on it.
We see Aha! Reports as so critical to product management and our service, that we have given it a top level navigation position. This means that we needed to do a little housekeeping and reorganize where a few of the Roadmap related screens are located. The following are changes that we made to make room for Aha! Reports.
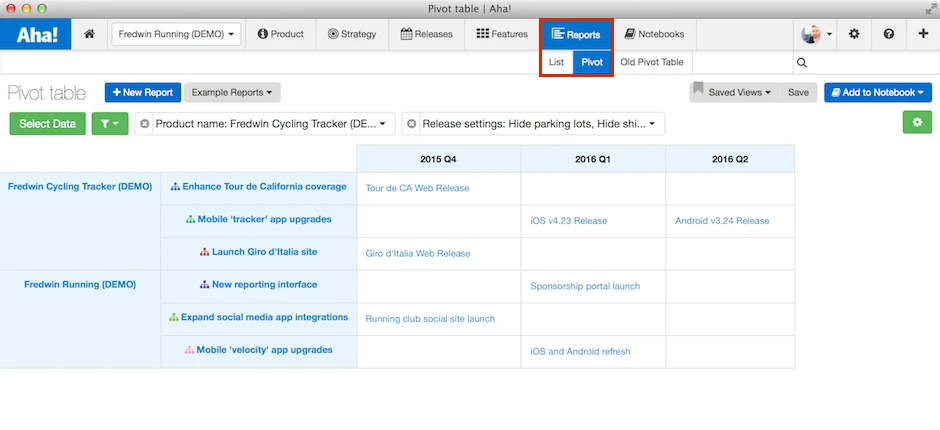
The previous Roadmap top level tab is now Reports
The new Reports screen has sub navigational links: List and Pivot
The old Pivot table will be available until August 30 via a third link
Because the Reports tab will house your key cross-product and cross-data analytics functionality moving forward, we also made a few other changes. The previous Roadmap Timeline screen has been moved under the Features tab. It is now named Feature Roadmap and will continue to be a great way to capture and share the releases and features that are coming. The functionality on that screen has not changed.
The existing Releases Portfolio under the Releases tab is now named Releases Roadmap. It is not changing locations and will continue to be a great way to capture and share detailed release plans with phases and milestones.
Aha! Reports gives you the analytics platform you need to manage product with conviction. We provide the reporting features that you cannot get elsewhere, so you can analyze what’s happening without spending hours of time duplicating data and manipulating spreadsheets.
Hallelujah. We think you are really, really going to like this.
If you have any questions about the new Aha! Reports (or would like to learn more) contact us at support@aha.io. A smart, former product manager, who works on our Customer Success team will respond within an hour or two.