Capacity report for individuals in Aha! Roadmaps.
Visualize Estimates in Story Points on the Capacity Report


How do you ensure that the right people are available to support your product plans at the right time? The short answer is effective planning. This starts with clearly defining and estimating features. From there, it is all about assigning and scheduling work in a way that balances the needs of the business with team and individual workloads. This is where the capacity report in Aha! Roadmaps can help — and it just got better.
You can now visualize the workload of each person in story points or time on the capacity report for individuals in Aha! Roadmaps.
If you have already enabled capacity planning for individuals in your workspace, then you know you can select either story points or time as your estimation unit. You can then set the capacity for a release, estimate the effort required to deliver each feature, and log progress as work gets underway.
Visualizing each person's workload on the capacity report lets you see who is over- or under-utilized each month — so you can efficiently assign work and resolve any resourcing issues. Previously though, you could only view time-based estimates on the report. With today's update, you can now analyze capacity in story points too.
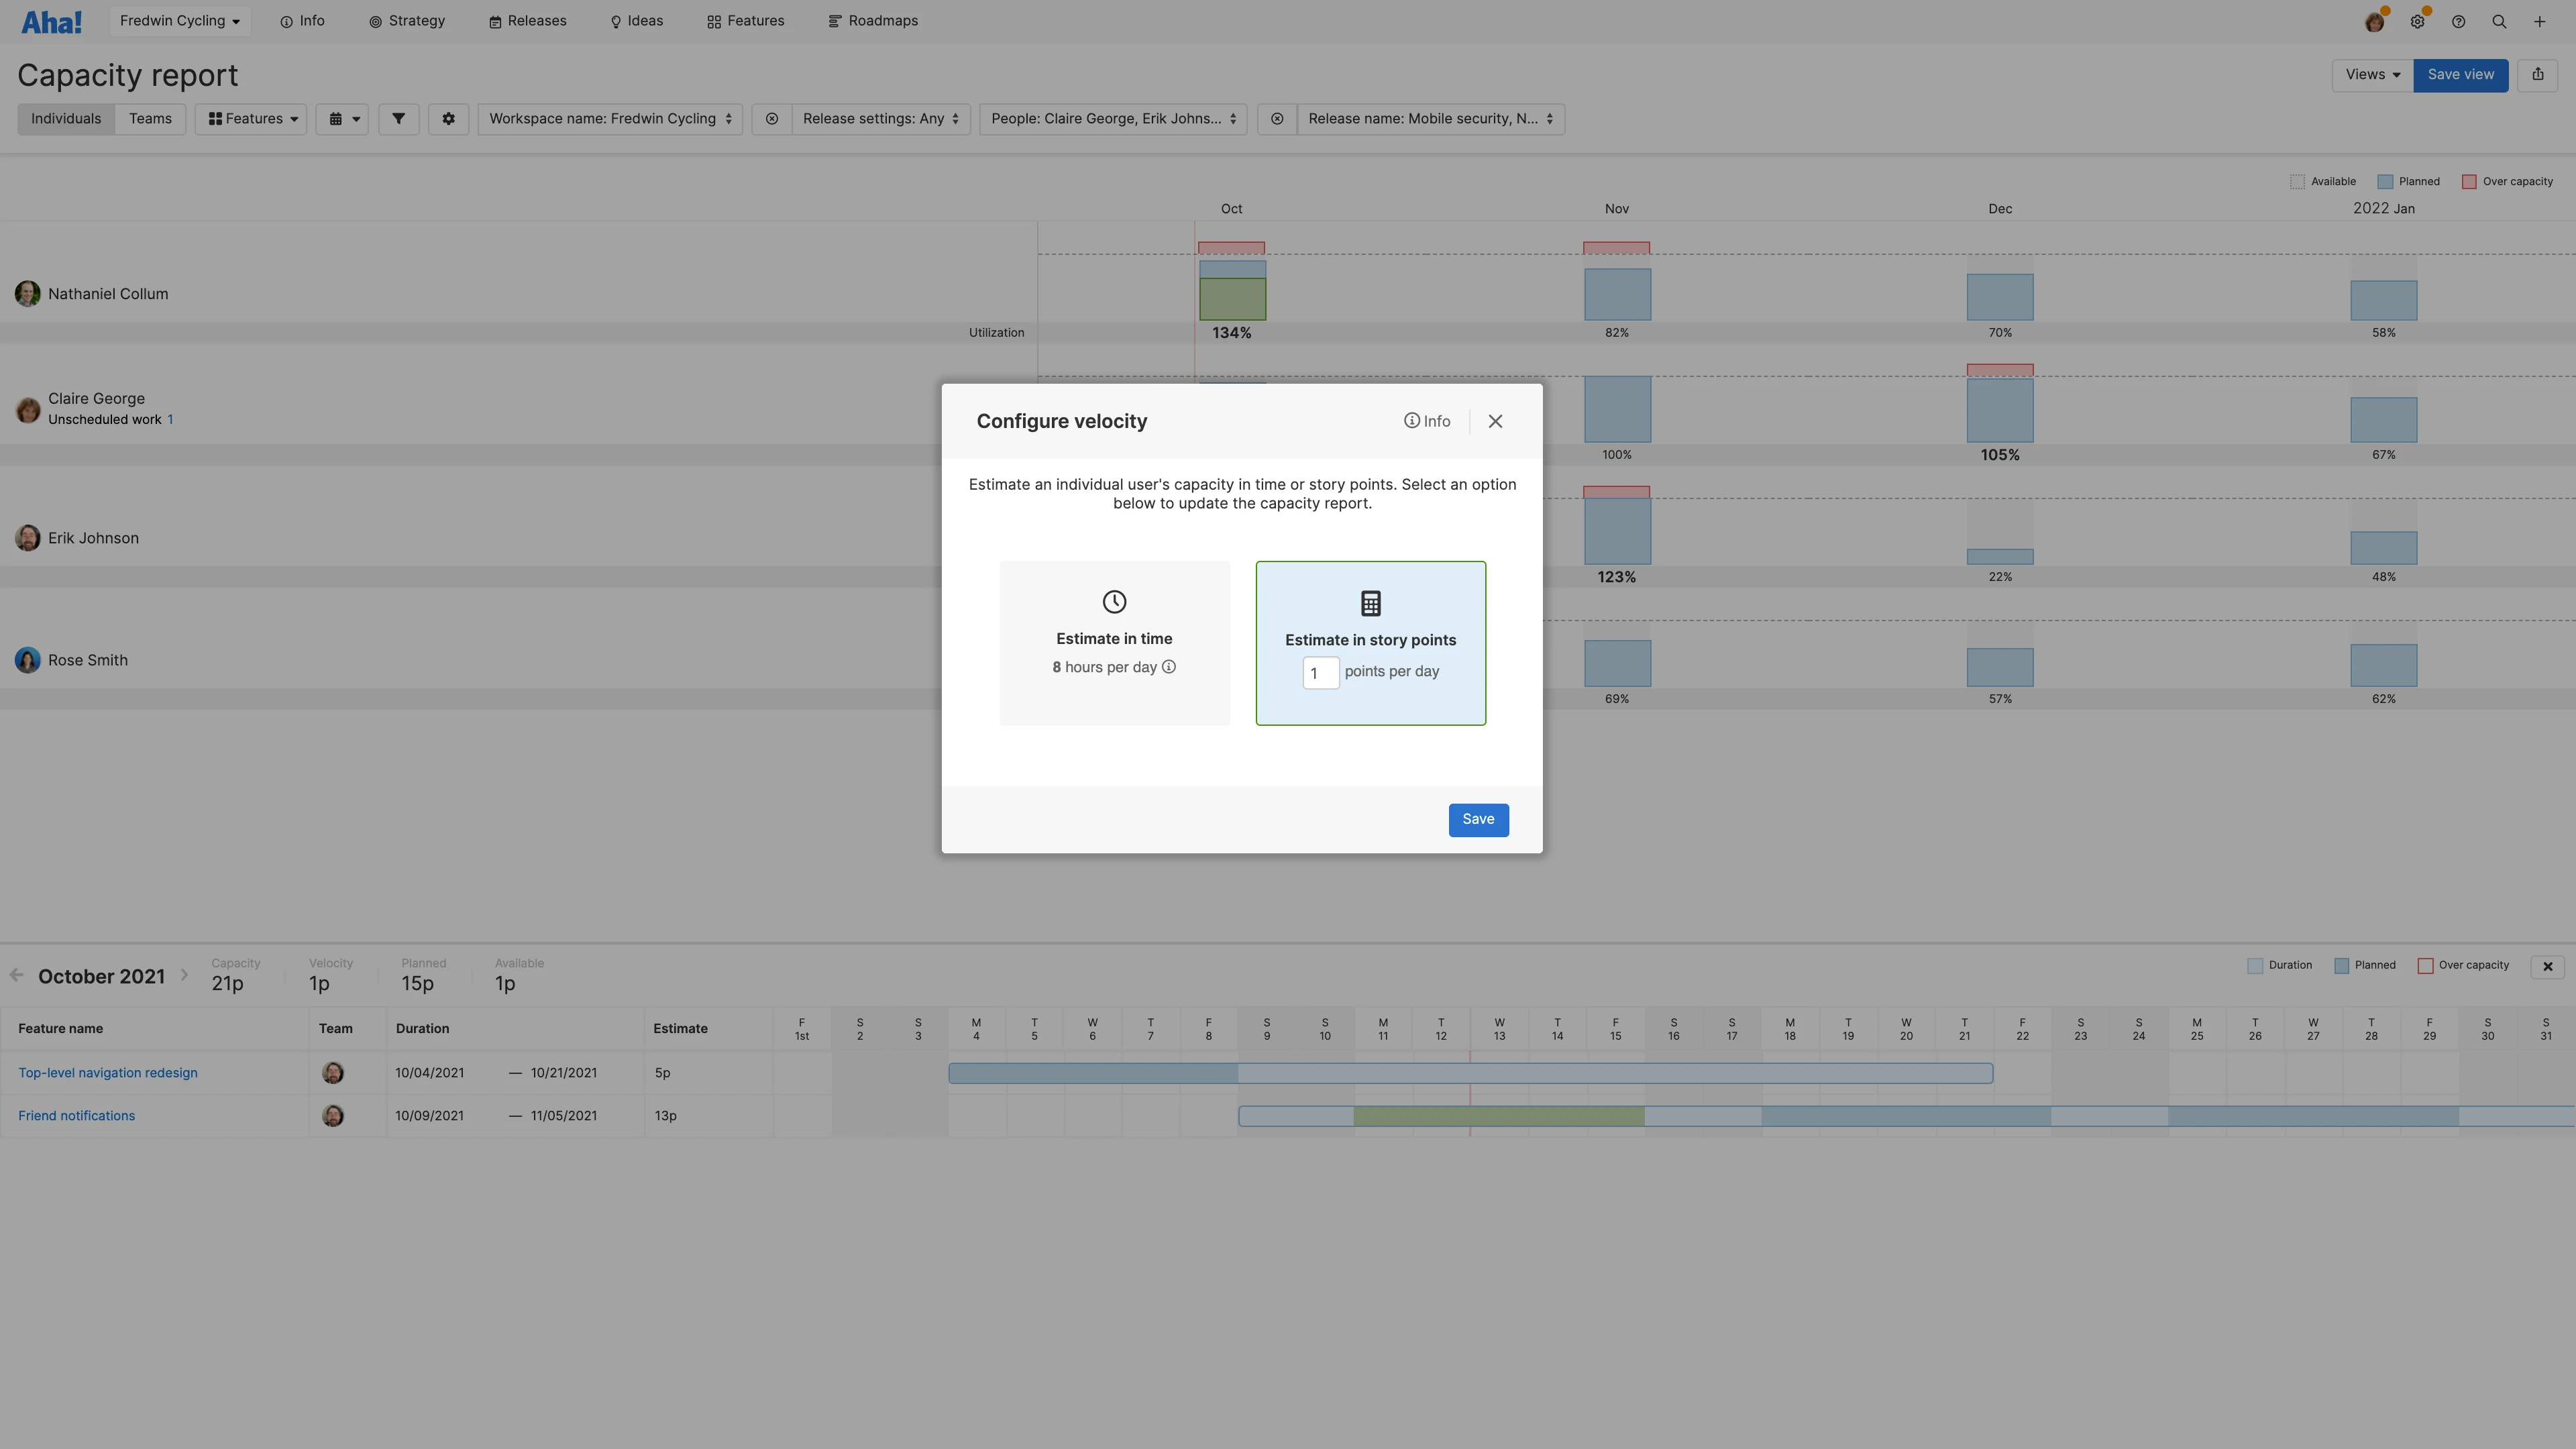
Your capacity report will automatically display estimates in the unit you select in your workspace settings. To change from time to story points or vice versa, use the "Configure velocity" modal in the capacity report. This is useful if you are viewing reports by workspace and want to toggle between the units used in each one. Keep in mind that if you want to view work assigned to teammates across multiple workspaces, the estimates must all use the same unit.
Let's take a look at what you can do:
Visualize capacity in story points
Set the velocity of roadmap-driven work a person can complete in a day. In the example below, we are using the default value of one point. Once saved, the report displays the percent of planned capacity for each person by month. This is calculated based on the estimate and date range of any features that have been assigned to them.
Resolve resourcing issues
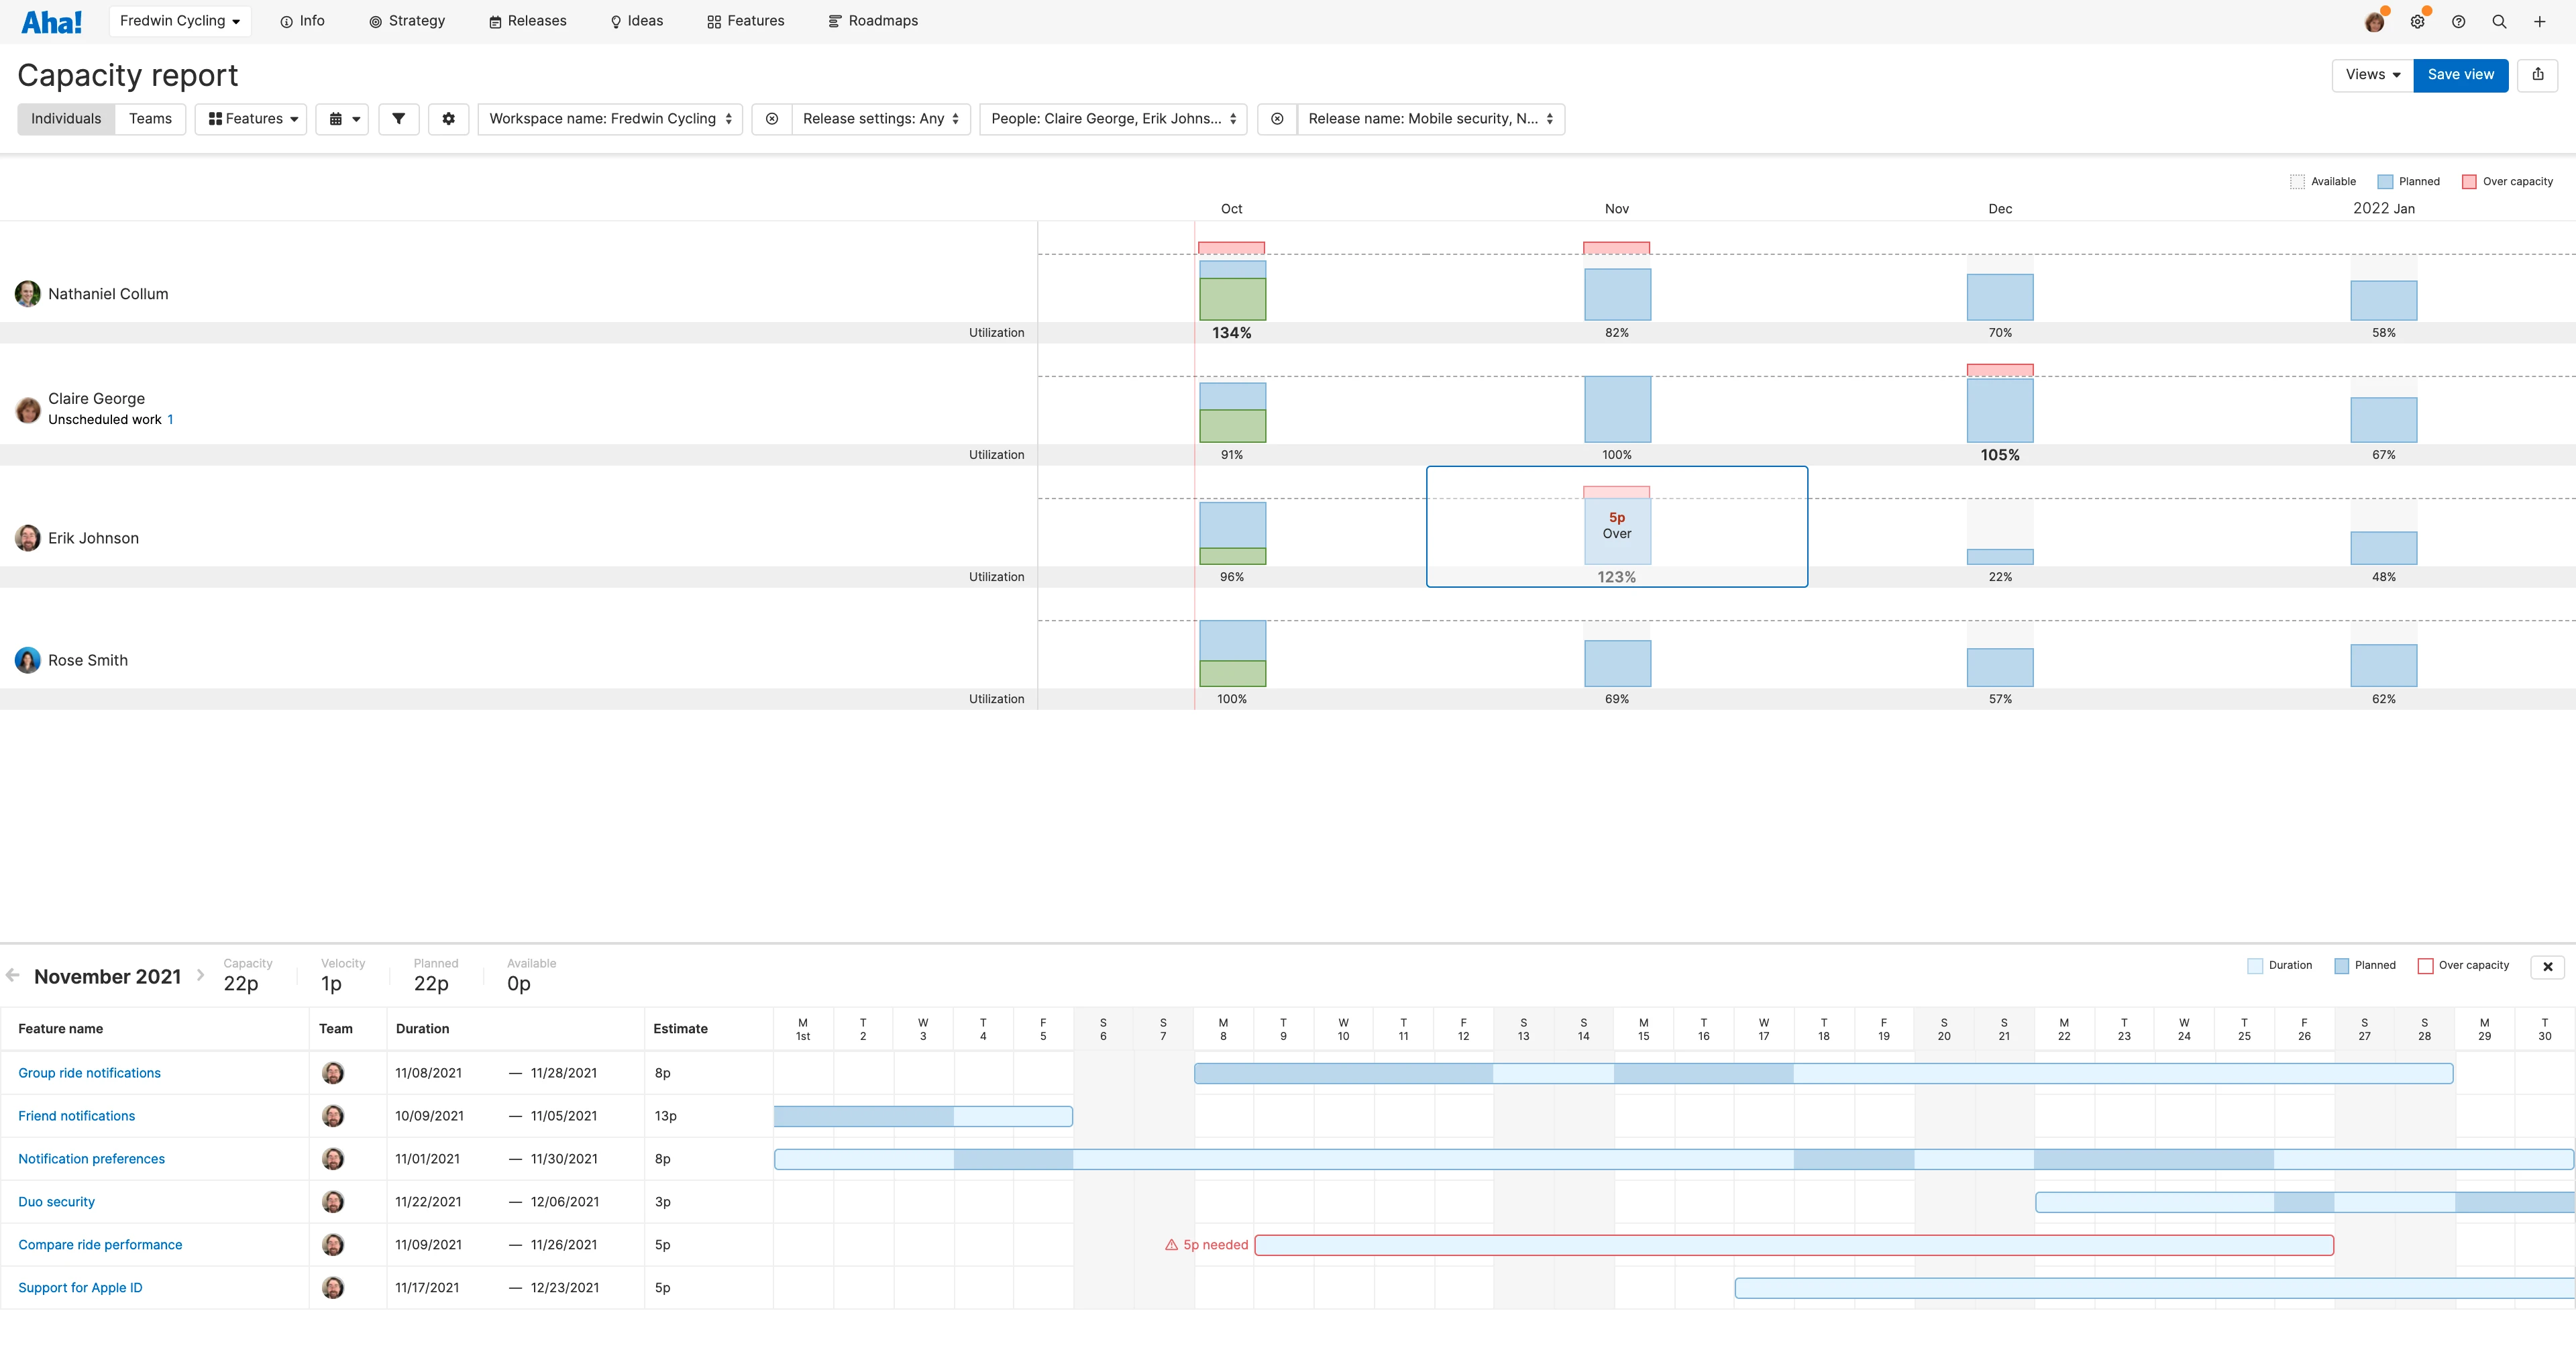
Optimize your plans. Below, we can see that Erik is overcapacity in October, but Rose can take on seven more points of work. We reallocate one of Erik's features to Rose and adjust the due date based on Rose's other assigned work. This resolves our resourcing challenge — so we can move ahead with confidence.
Balancing your plans with the team's workload creates a productive and happy environment for everyone.
No matter whether you estimate in story points or time, the capacity report helps you proactively spot resourcing conflicts. Capacity planning for individuals is included in all Aha! Roadmaps plans. If you want to set team-based estimates in people, hours, or cost and create alternate scenarios, contact us to learn about capacity planning for teams which is available in the Enterprise+ plan.
Sign up for a free trial of Aha! Roadmaps — plan the future
Aha! Roadmaps is the best way to set strategy, prioritize features, and share visual plans. It includes Aha! Ideas Essentials for crowdsourcing feedback. If you are not already an Aha! customer, sign up for a free 30-day trial or join a live demo to see why more than 500,000 users trust our cloud-based software to build lovable products.