Just Launched! — New Gantt Chart to Visualize Cross-Functional Work


What do dates, dependencies, and blockers have in common? Big projects. I am talking about product releases, software rollouts, and marketing launches — major cross-functional efforts. Many of you rely on the Gantt chart in Aha! to coordinate all the details. And over the last few months, we have been working on our own big project.
We are introducing a new Gantt chart. It provides a smoother experience, inline editing, a new master features view, and much more.
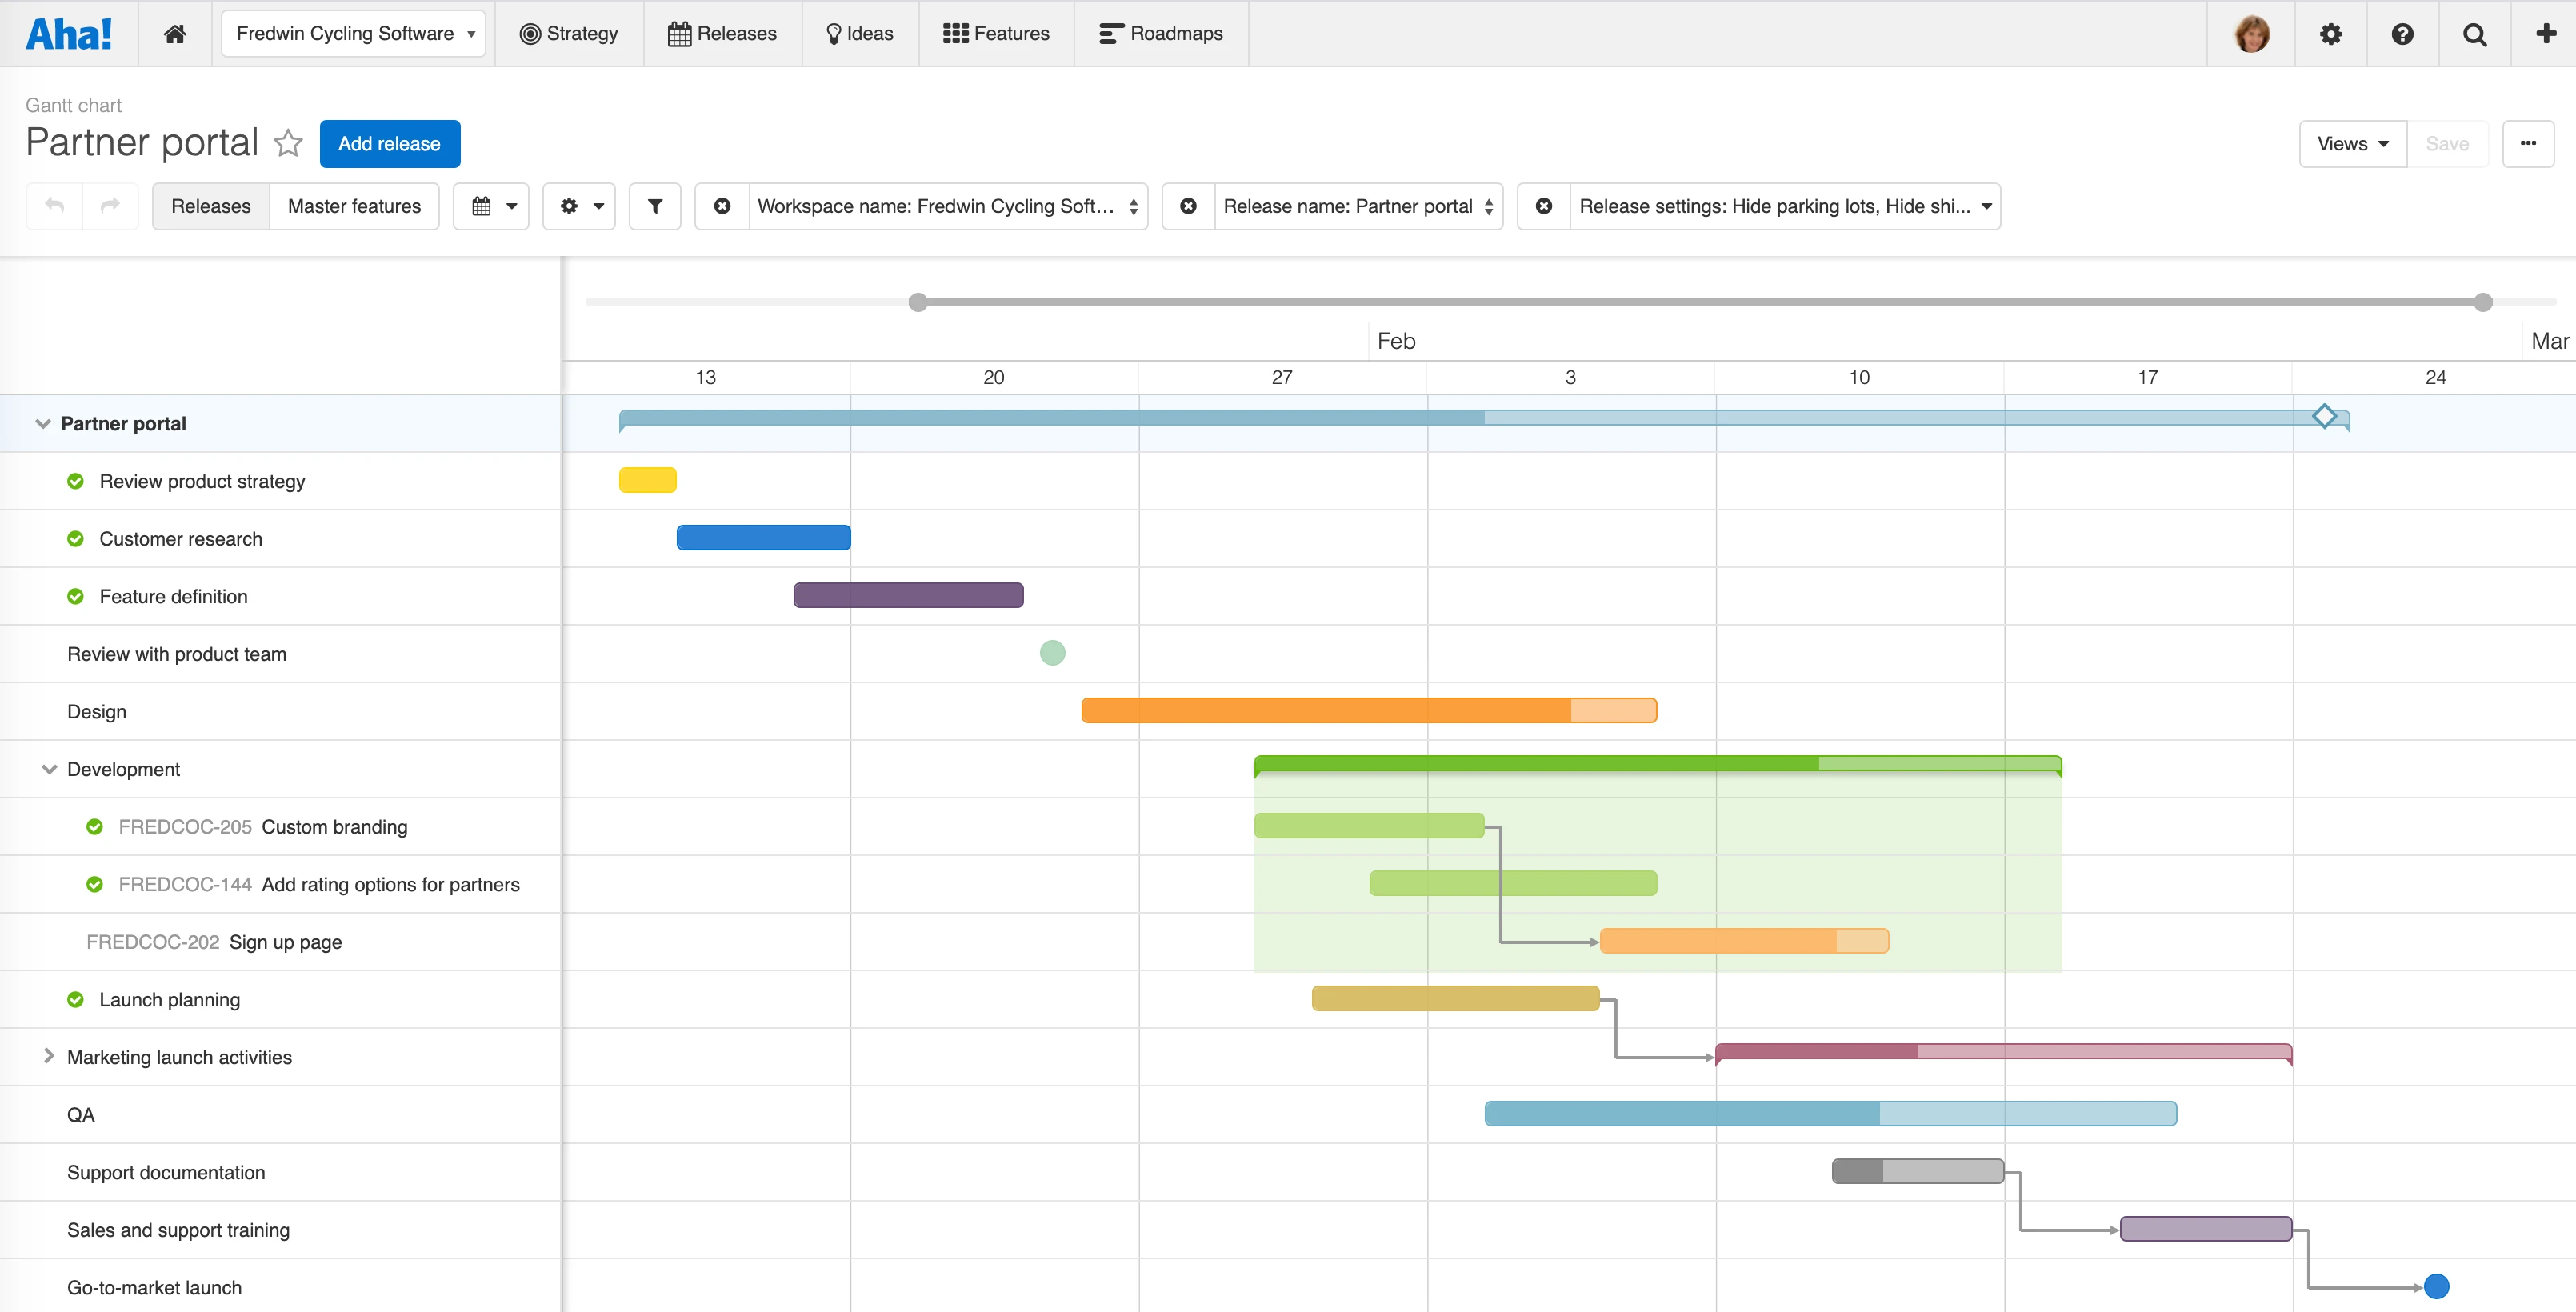
The first thing you will notice is a fresh new look. Yes, we updated the style and colors, but the improvements are more than aesthetic. From setting dependencies to moving and resizing bars, we optimized every interaction to make the entire experience faster and smoother.
We also developed some new functionality. You now have a master features view to visualize work by theme. And you have better control over the way you add, edit, and arrange data. All features will now be visible on the Gantt chart by default — even if they do not have a start and end date. This way, you can be confident that all activities are scheduled for delivery.
If you are already an Aha! customer, any saved Gantt charts will automatically update to the new look as soon as you open them. We hope you find the new experience more lovable than ever.
Here is a deeper look at the new Gantt chart capabilities:
Build beautiful plans — uninterrupted You can now create and edit features, phases, and milestones in place. And you can drag and drop features in order within each phase. Or maybe you prefer to sort by rank, start date, end date, or alphabetically — the choice is yours.
Enjoy more control over start and end dates We changed the way dates are set on parent records. Previously, the duration of releases, release phases, and master features was automatically determined by the start date of the first feature and the end date of the last feature within each group. Now, you can set dates for each record type independently. This helps you quickly align your schedule and identify any timing issues.
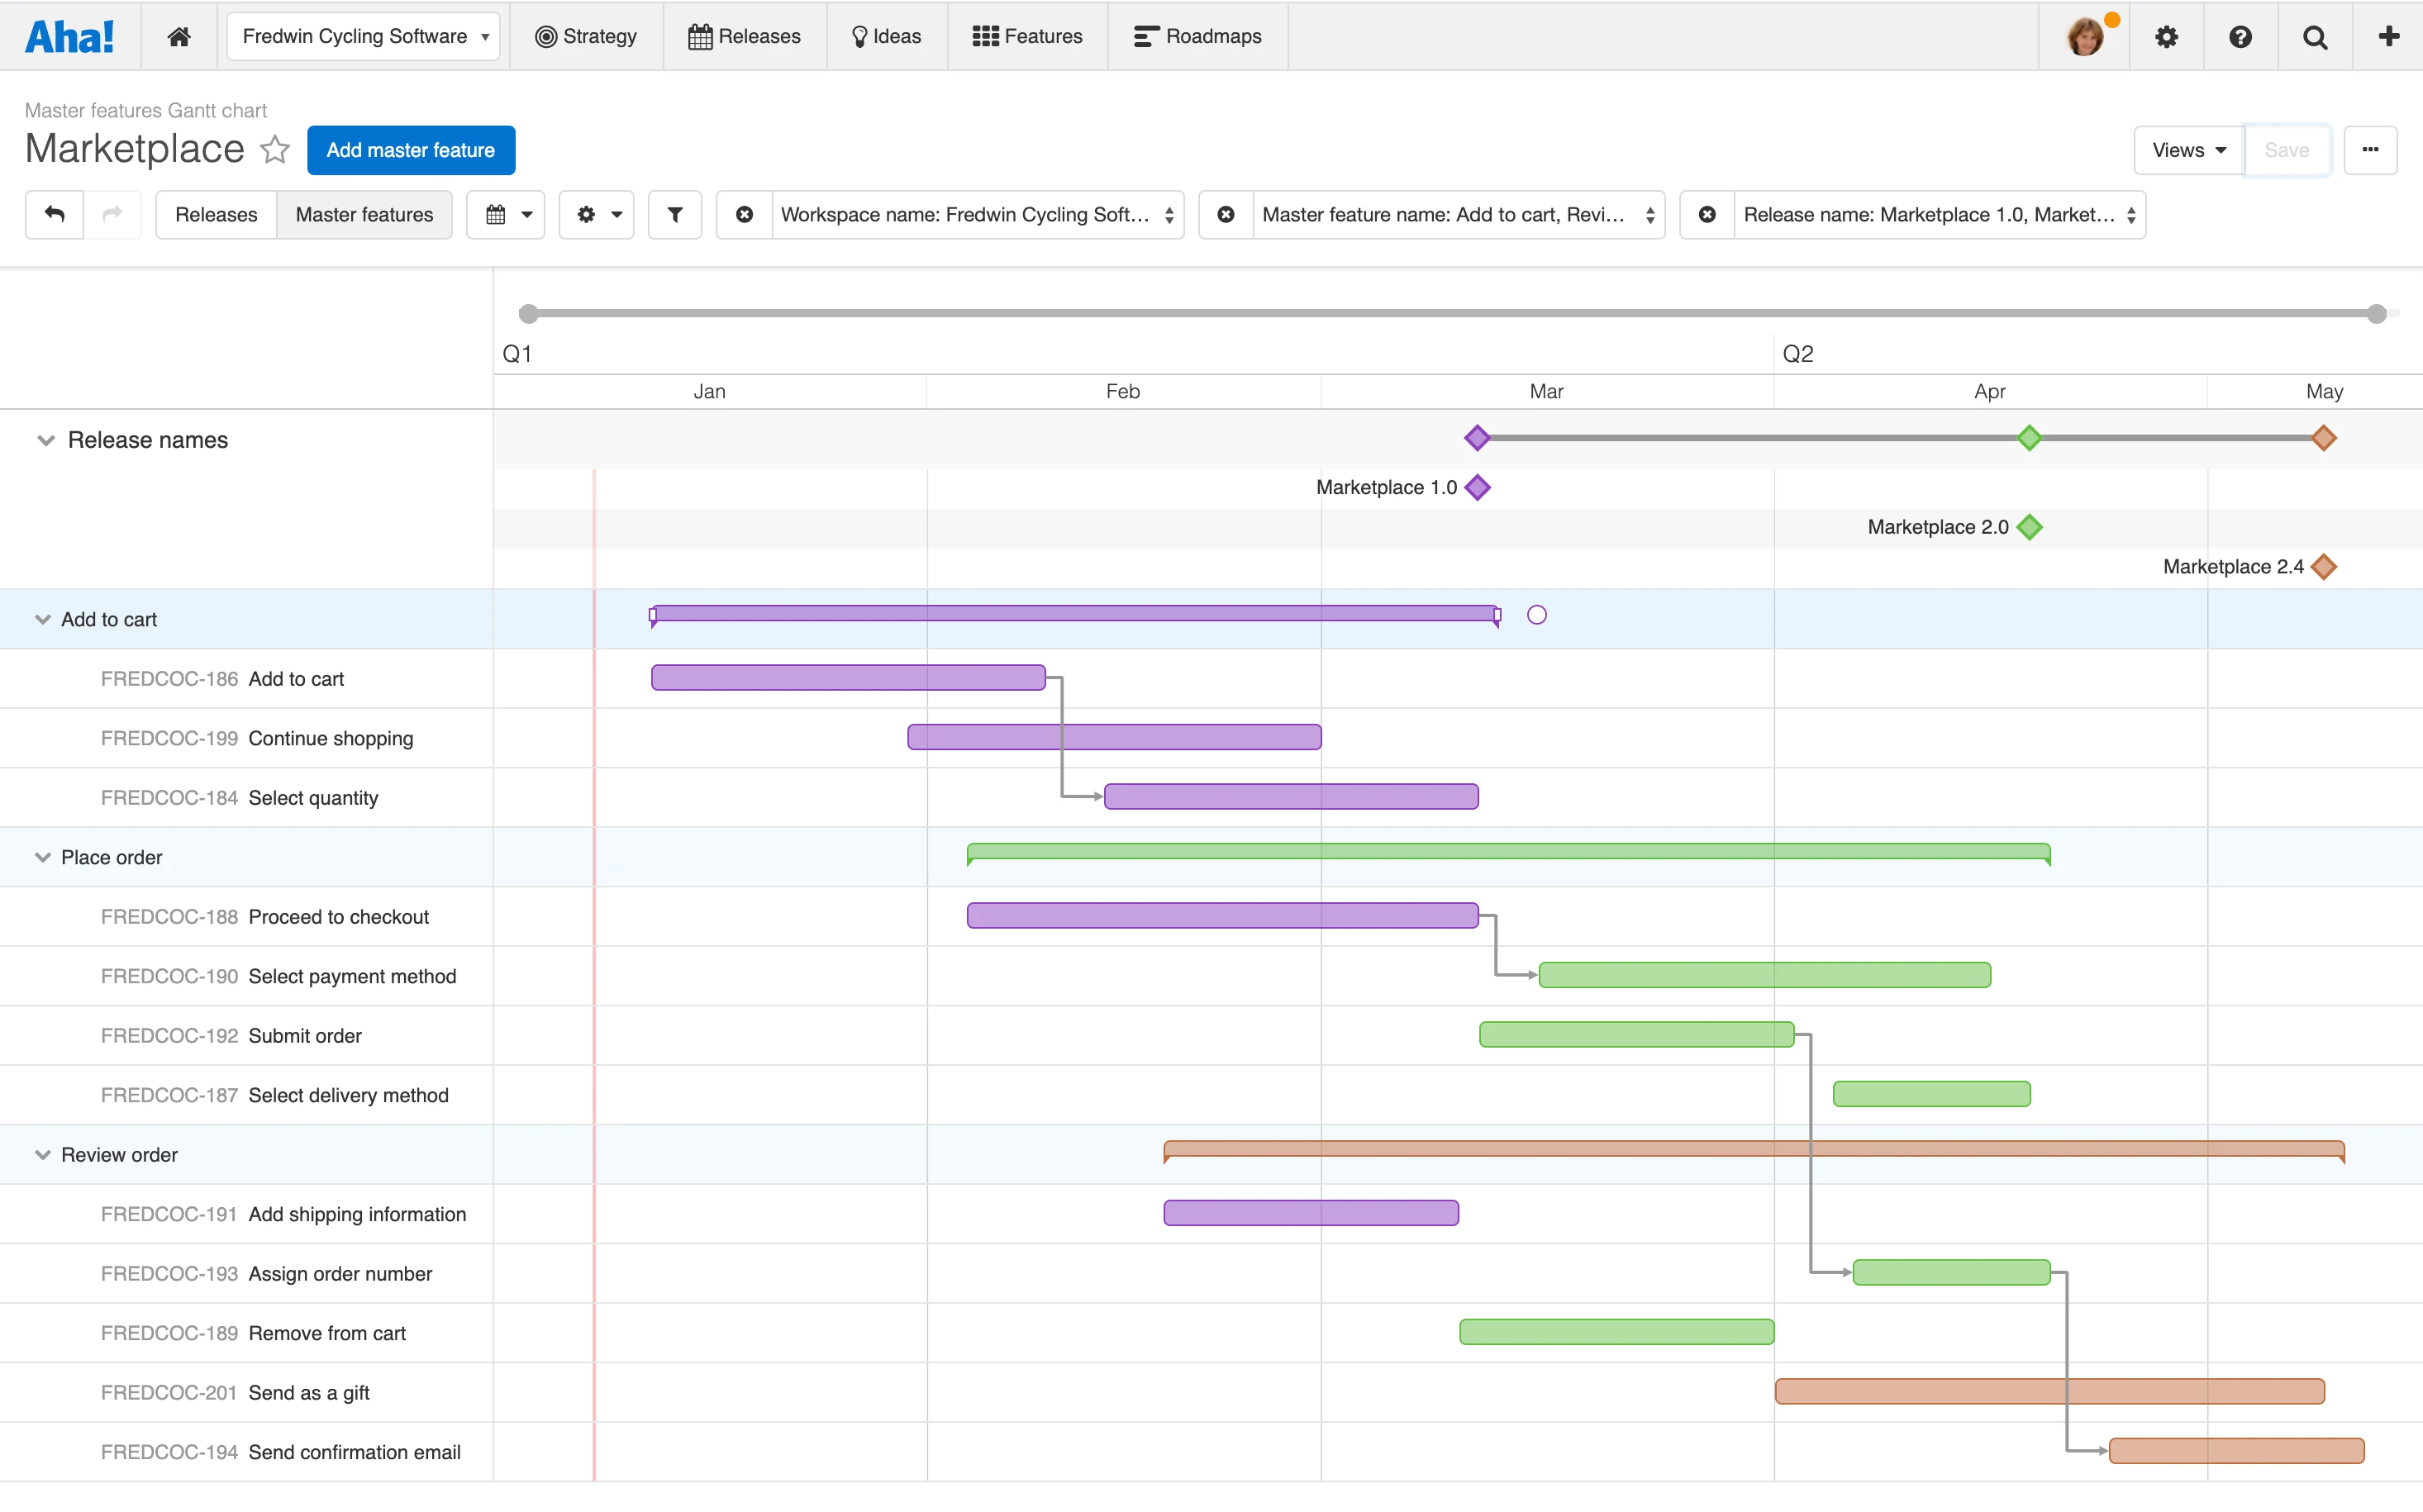
View a timeline for master features Teams often need to visualize work grouped by theme. Toggle to the new master features view to see all the master features you have planned. You can expand each master feature to see when features will be completed across multiple releases. (Depending on the type of workspace you use, you might see master features and features labeled as master activities and activities.)
Cross-functional efforts are complex enough — you need a tool that makes it easy to manage all the details.
We spent a lot of time thinking about every aspect of the new Gantt chart and making the transition to the new experience as seamless as possible. We look forward to hearing what you think.
Sign up for a free Aha! trial — be happy The Gantt chart is available to all Aha! customers. If you are not already an Aha! customer, you may want to sign up for a free 30-day trial or join a live demo to see why more than 300,000 users trust Aha! to build and market lovable products.