The new throughput report in Aha! Develop shows how much work your team completed week-over-week.
Introducing the New Throughput Report For Kanban Teams


Speed and predictability. These are two traits of successful kanban development teams. You want to ship new functionality and improvements as quickly as possible — so you can delight your customers. Establishing a steady delivery pace also helps the product team accurately predict release plans. The workflow board in Aha! Develop helps you keep work moving on a day-to-day basis. But sometimes you need to take a step back and look at overall performance trends in order to see how you can improve.
The new throughout report in Aha! Develop helps you compare the amount of work completed each week — so you can track productivity over time and spot opportunities for improvement.
This report is ideal for kanban teams that want to track and improve productivity over time. Select a desired timeframe — such as the past six weeks, three months, six months, or one year — and choose whether you want to use estimate or record count as the unit. (If you choose record count, we recommend defining work items that are roughly the same size to reduce variability.) The report shows how much work was completed each week and calculates your average throughput. This helps you identify performance trends — so you can establish a more efficient and predictable workflow.
The throughput report is available for teams using the Aha! Develop Advanced plan. You can find it in the Reports section of your account. View performance across the entire team or apply a filter to understand the amount of work completed by individual team members.
Let's take a closer look at how the throughput report works:
Analyze team performance
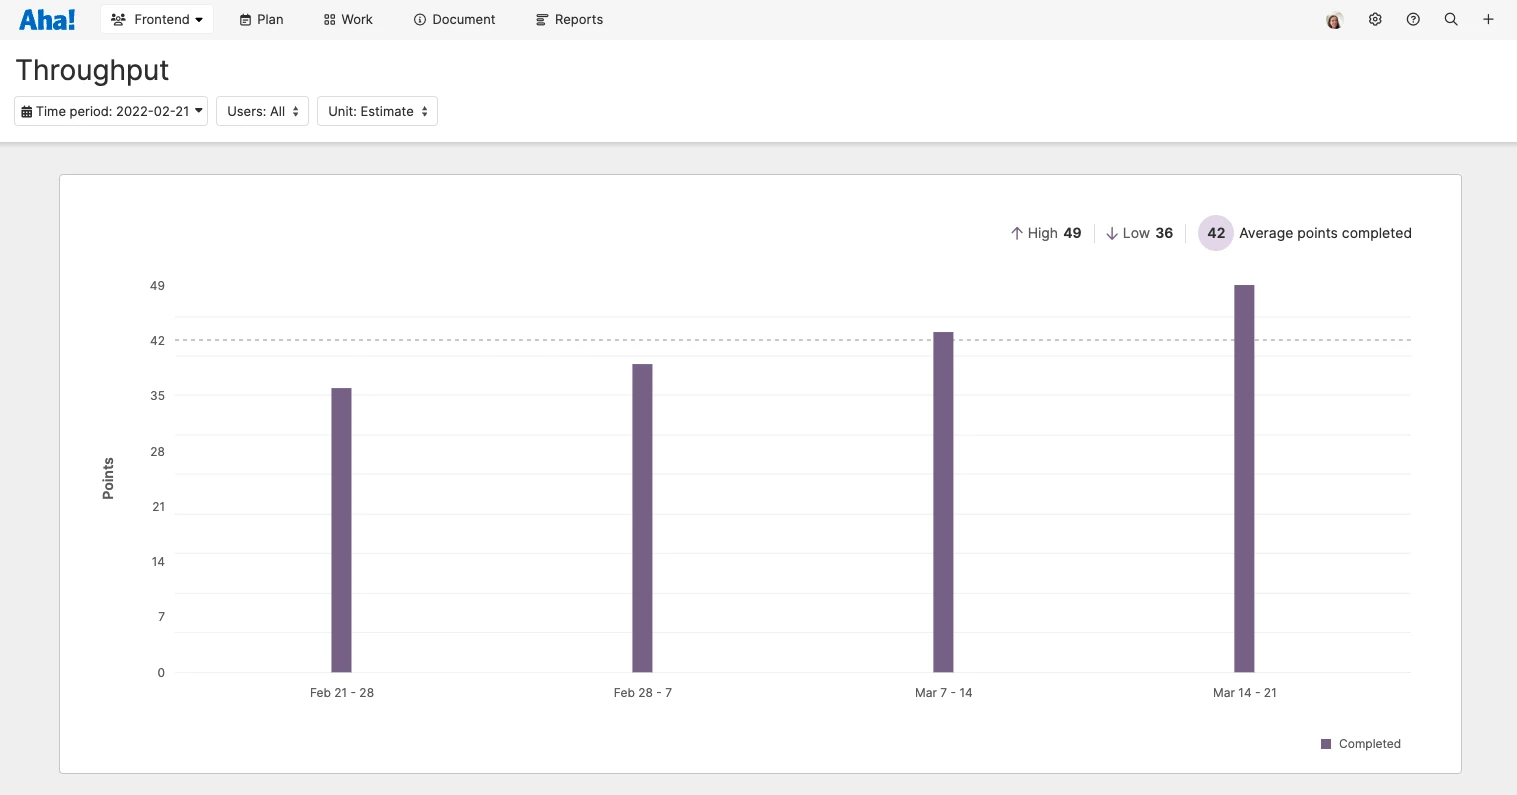
Let's imagine we are preparing for a monthly retrospective. We pull up the throughput report and refine the view to show only work completed over the past four weeks. In the example below, you can see that the team delivered an average of 42 points. You can also see that the throughput is trending upwards over time. This indicates that changes we made to optimize our workflow after the last retrospective are working — so we should keep doing what we are doing!
See how much work your team completes week-over-week and celebrate your progress.
Go ahead and check out the new throughput report in Aha! Develop today. You will love the new insights it offers on team productivity. And let us know what other analytics you use to track your kanban system. We are actively working on incorporating more agile metrics for kanban teams.
Sign up for a free trial of Aha! Develop
Aha! Develop is a fully extendable agile development tool. Prioritize the backlog, estimate work, and plan sprints. If you are interested in an integrated product development approach, use Aha! Roadmaps and Aha! Develop together. Sign up for a free 30-day trial or join a live demo to see why more than 600,000 product builders at companies of all sizes trust our software to build lovable products and be happy doing it.