View actual work completed alongside total scope and forecast completion using past team performance.
Introducing the burnup chart to track the impact of scope creep


Do your sprints ever take on a life of their own? You start with a clear plan. The team is aligned and ready to deliver. Then, stakeholders add new requirements or a technical issue expands the work. This makes it hard to tell if any progress is being made. You need to see what work has been added (or removed), what is done, and when the sprint will end — so you can keep everyone aligned and deliver with confidence.
Use the new burnup chart in Aha! Teamwork and Aha! Develop to track scope changes and accurately forecast completion dates.
Manage evolving scope
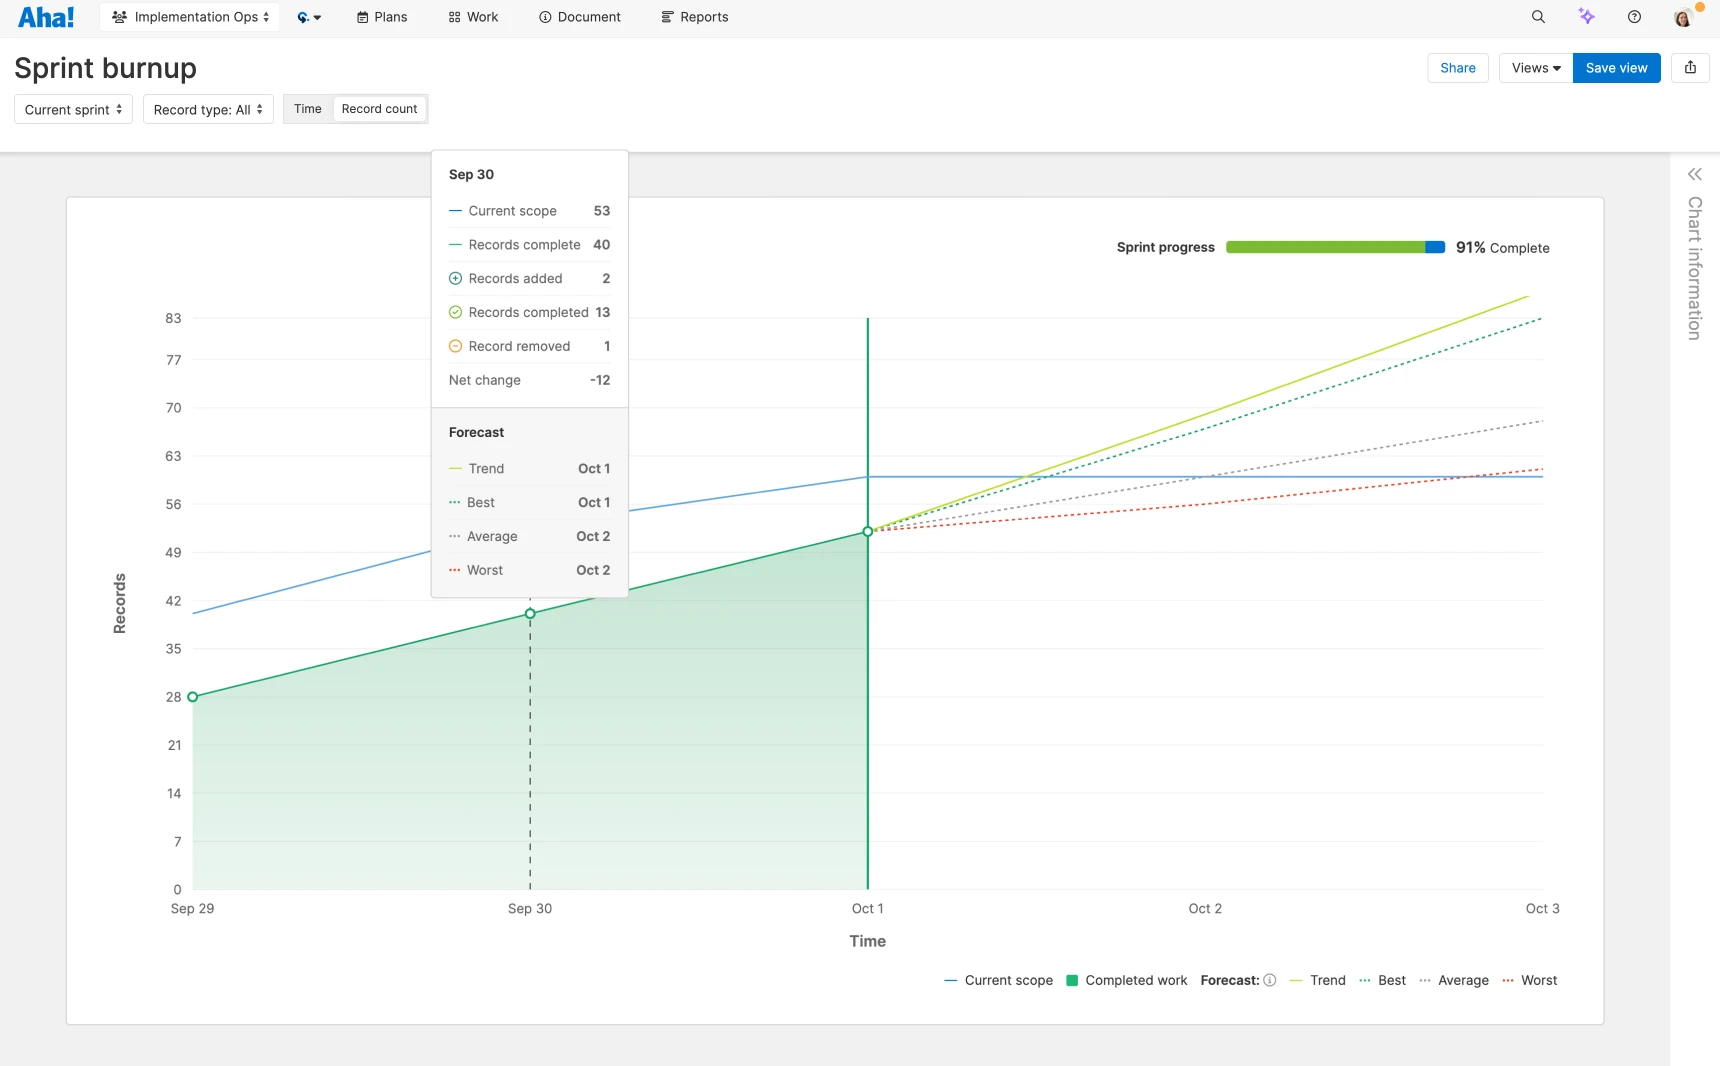
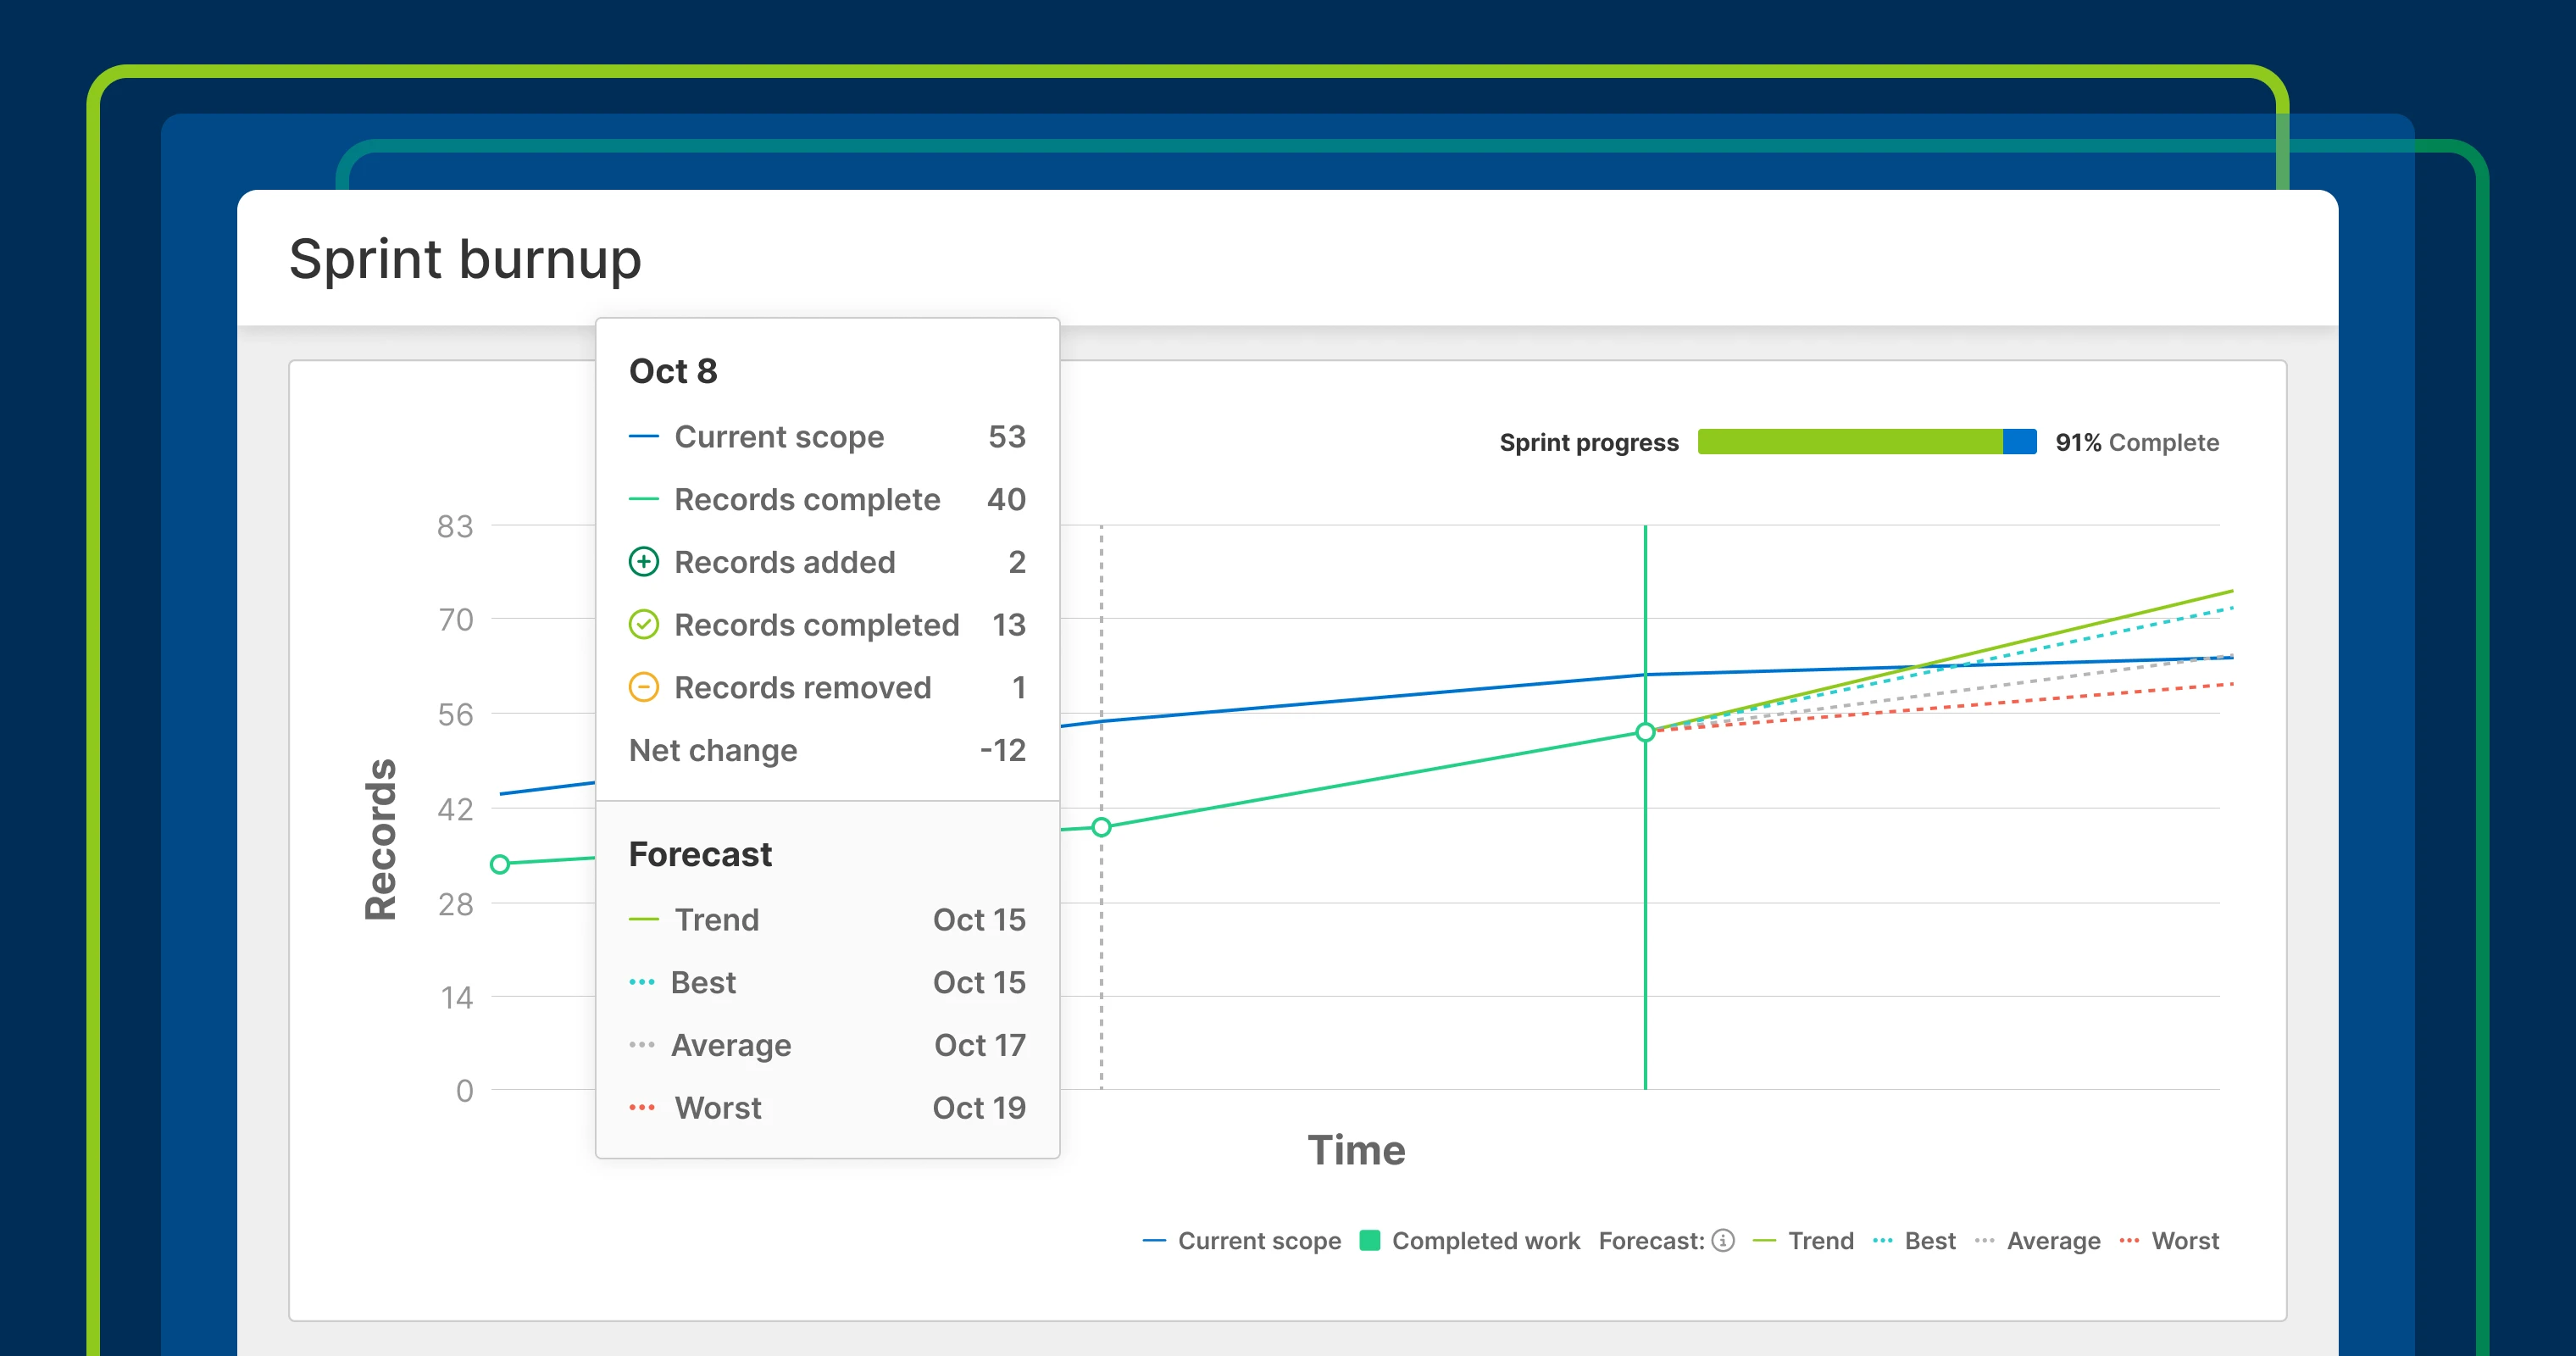
You can already use the burndown chart in Aha! Teamwork and Aha! Develop to monitor progress toward completing the current sprint. It helps you understand the ideal velocity and spot deviations that put delivery at risk. But it can be hard to get an accurate picture of what will get done when the scope changes mid-sprint. The new burnup chart shows current scope alongside completed work — so you can set clear expectations with stakeholders and the team.
Here is what you can do:
Track scope changes: See when work is added to or removed from an in-progress sprint.
Forecast work completion: Assess best, worst, and average delivery dates based on recent team performance.
Increase transparency: Share a real-time view of sprint progress with stakeholders.
Use the burnup chart to discuss the impact of scope changes and determine the best way to deliver your plans.
The new burnup chart is now available in Aha! Teamwork Advanced and Aha! Develop Advanced. When you use these delivery-focused tools with Aha! Roadmaps, you can also add the report to dashboards, notes, and whiteboards to keep stakeholders informed.
Here's Amy Ellis from our product team with a closer look:
How to get started
Go to Reports Burnup chart.
Use your current sprint or choose a different one.
Filter by record type to focus on features or requirements.
Choose to measure progress by story points or record count.
Analyze five key lines:
Current scope: Total sprint work (changes with added/removed records)
Completed work: What your team has completed so far
Best case: Projected completion date based on your team's top sprint velocity
Worst case: Projected completion date based on your team's lowest sprint velocity
Average case: Projected completion date based on your team's average velocity
Hover over the Actual line to see what changed in the sprint that day.
Adjust the sprint plan as needed to deliver key functionality on time.
📚 For more details, read the full support article.
So, which chart should you use: burndown or burnup? The answer depends on your goal. Use a burndown chart when you need a simple way to track progress toward completion. Switch to the burnup chart when scope is likely to change and you need visibility into how those adjustments impact delivery. Together, they give you complementary views of sprint performance so you can align the team, adapt to changes, and deliver on time.
Start a free trial
Burnup charts are available for Aha! Teamwork Advanced and Aha! Develop Advanced customers. Aha! Teamwork is the flexible project management tool. Complete all tasks, streamline workflows, and increase visibility. Aha! Develop helps agile development teams connect to the roadmap, optimize workload, and streamline delivery. Use Aha! Teamwork or Aha! Develop with Aha! Roadmaps to keep operations, IT, marketing, and engineering teams aligned with your overall strategy. Sign up for a free 30-day trial or join a live demo to see why more than 1 million product builders trust our software to build lovable products and be happy doing it.