Just Launched! — Enhanced Aha! for Marketing Integration With Google Analytics


Editor's note: The Google Analytics integration is no longer available due to Google’s deprecation of Universal Analytics. See release note.
Great marketing requires strategic direction, coordinated schedules, and measurable results. But choosing which activities to pursue can be confusing when you have so many levers to pull — emails, blog posts, and landing pages. How do you tie it all together in a meaningful way? And how do you know if what you are doing is working?
This is why we built Aha! for Marketing — to give marketing teams one place to set and communicate strategy, build visual plans, and report on the results. We launched the product with a Google Analytics integration, to help you do that critical last step of measuring the impact of your work. And we just added an enhancement to help you focus on the metrics that matter most.
You can now customize which metrics you want to bring in from Google Analytics to your marketing workspaces and set the exact date range you want to visualize.
You are probably already familiar with the tracking capabilities that Google Analytics provides. You can measure web traffic and assess the performance of digital advertising campaigns and content. When you connect your strategic work in Aha! for Marketing directly with engagement data from Google Analytics, you can make better planning decisions.
But before we go any further, let’s take a step back to understand how the integration works. There are two types of data in Google Analytics — dimensions and metrics. We refer to this data as “measurements” in Aha! for Marketing. Adding measurements to your records (such as initiatives, campaigns, activities, and requirements) gives you visibility into performance data without ever having to leave your marketing workspace.
Note that Aha! administrators with customization permissions can integrate marketing workspaces with Google Analytics. Marketing owners and contributors can add measurements to records.
Take a look at what you can do by using marketing workspaces and Google Analytics together:
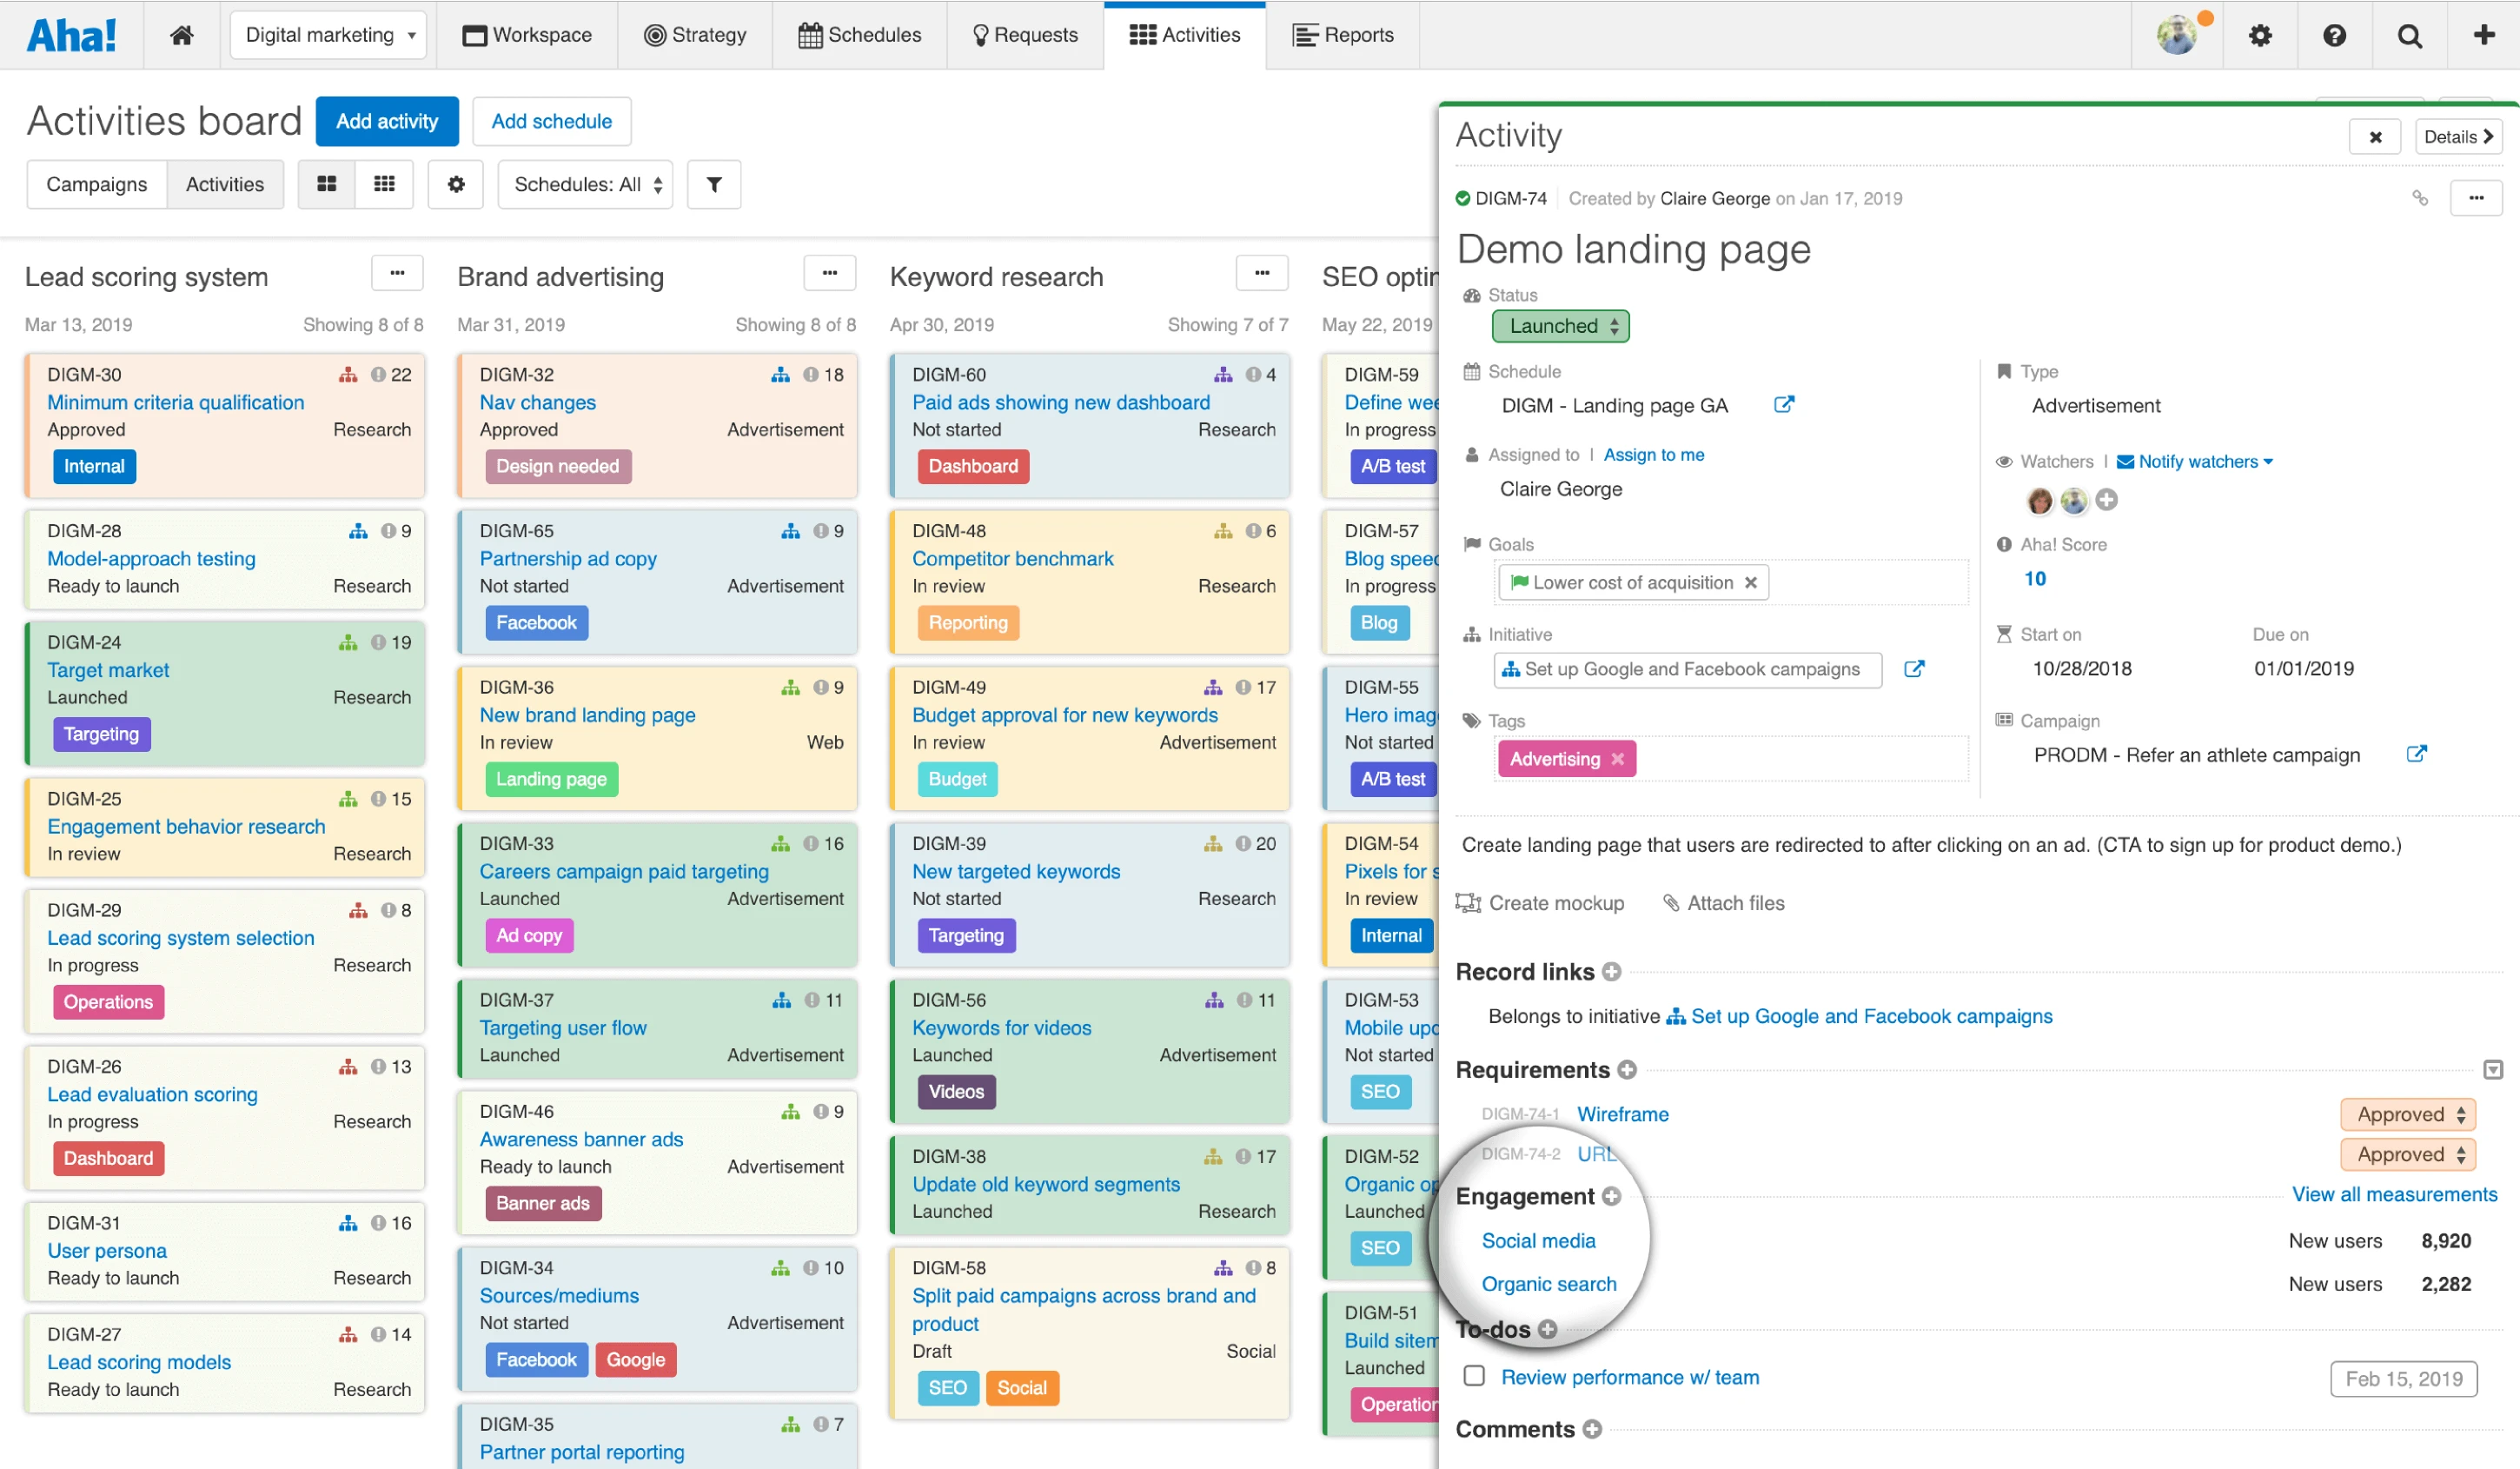
Add and view engagement data Once the integration is enabled in your workspace, an engagement section appears in the drawer view of your records. This is where you add and view the information you want to track from Google Analytics. In the example below, we are tracking the number of new users who visited a demo landing page by medium — organic search and social media.
Pin the most important metric for each measurement to make it visible in the drawer view.
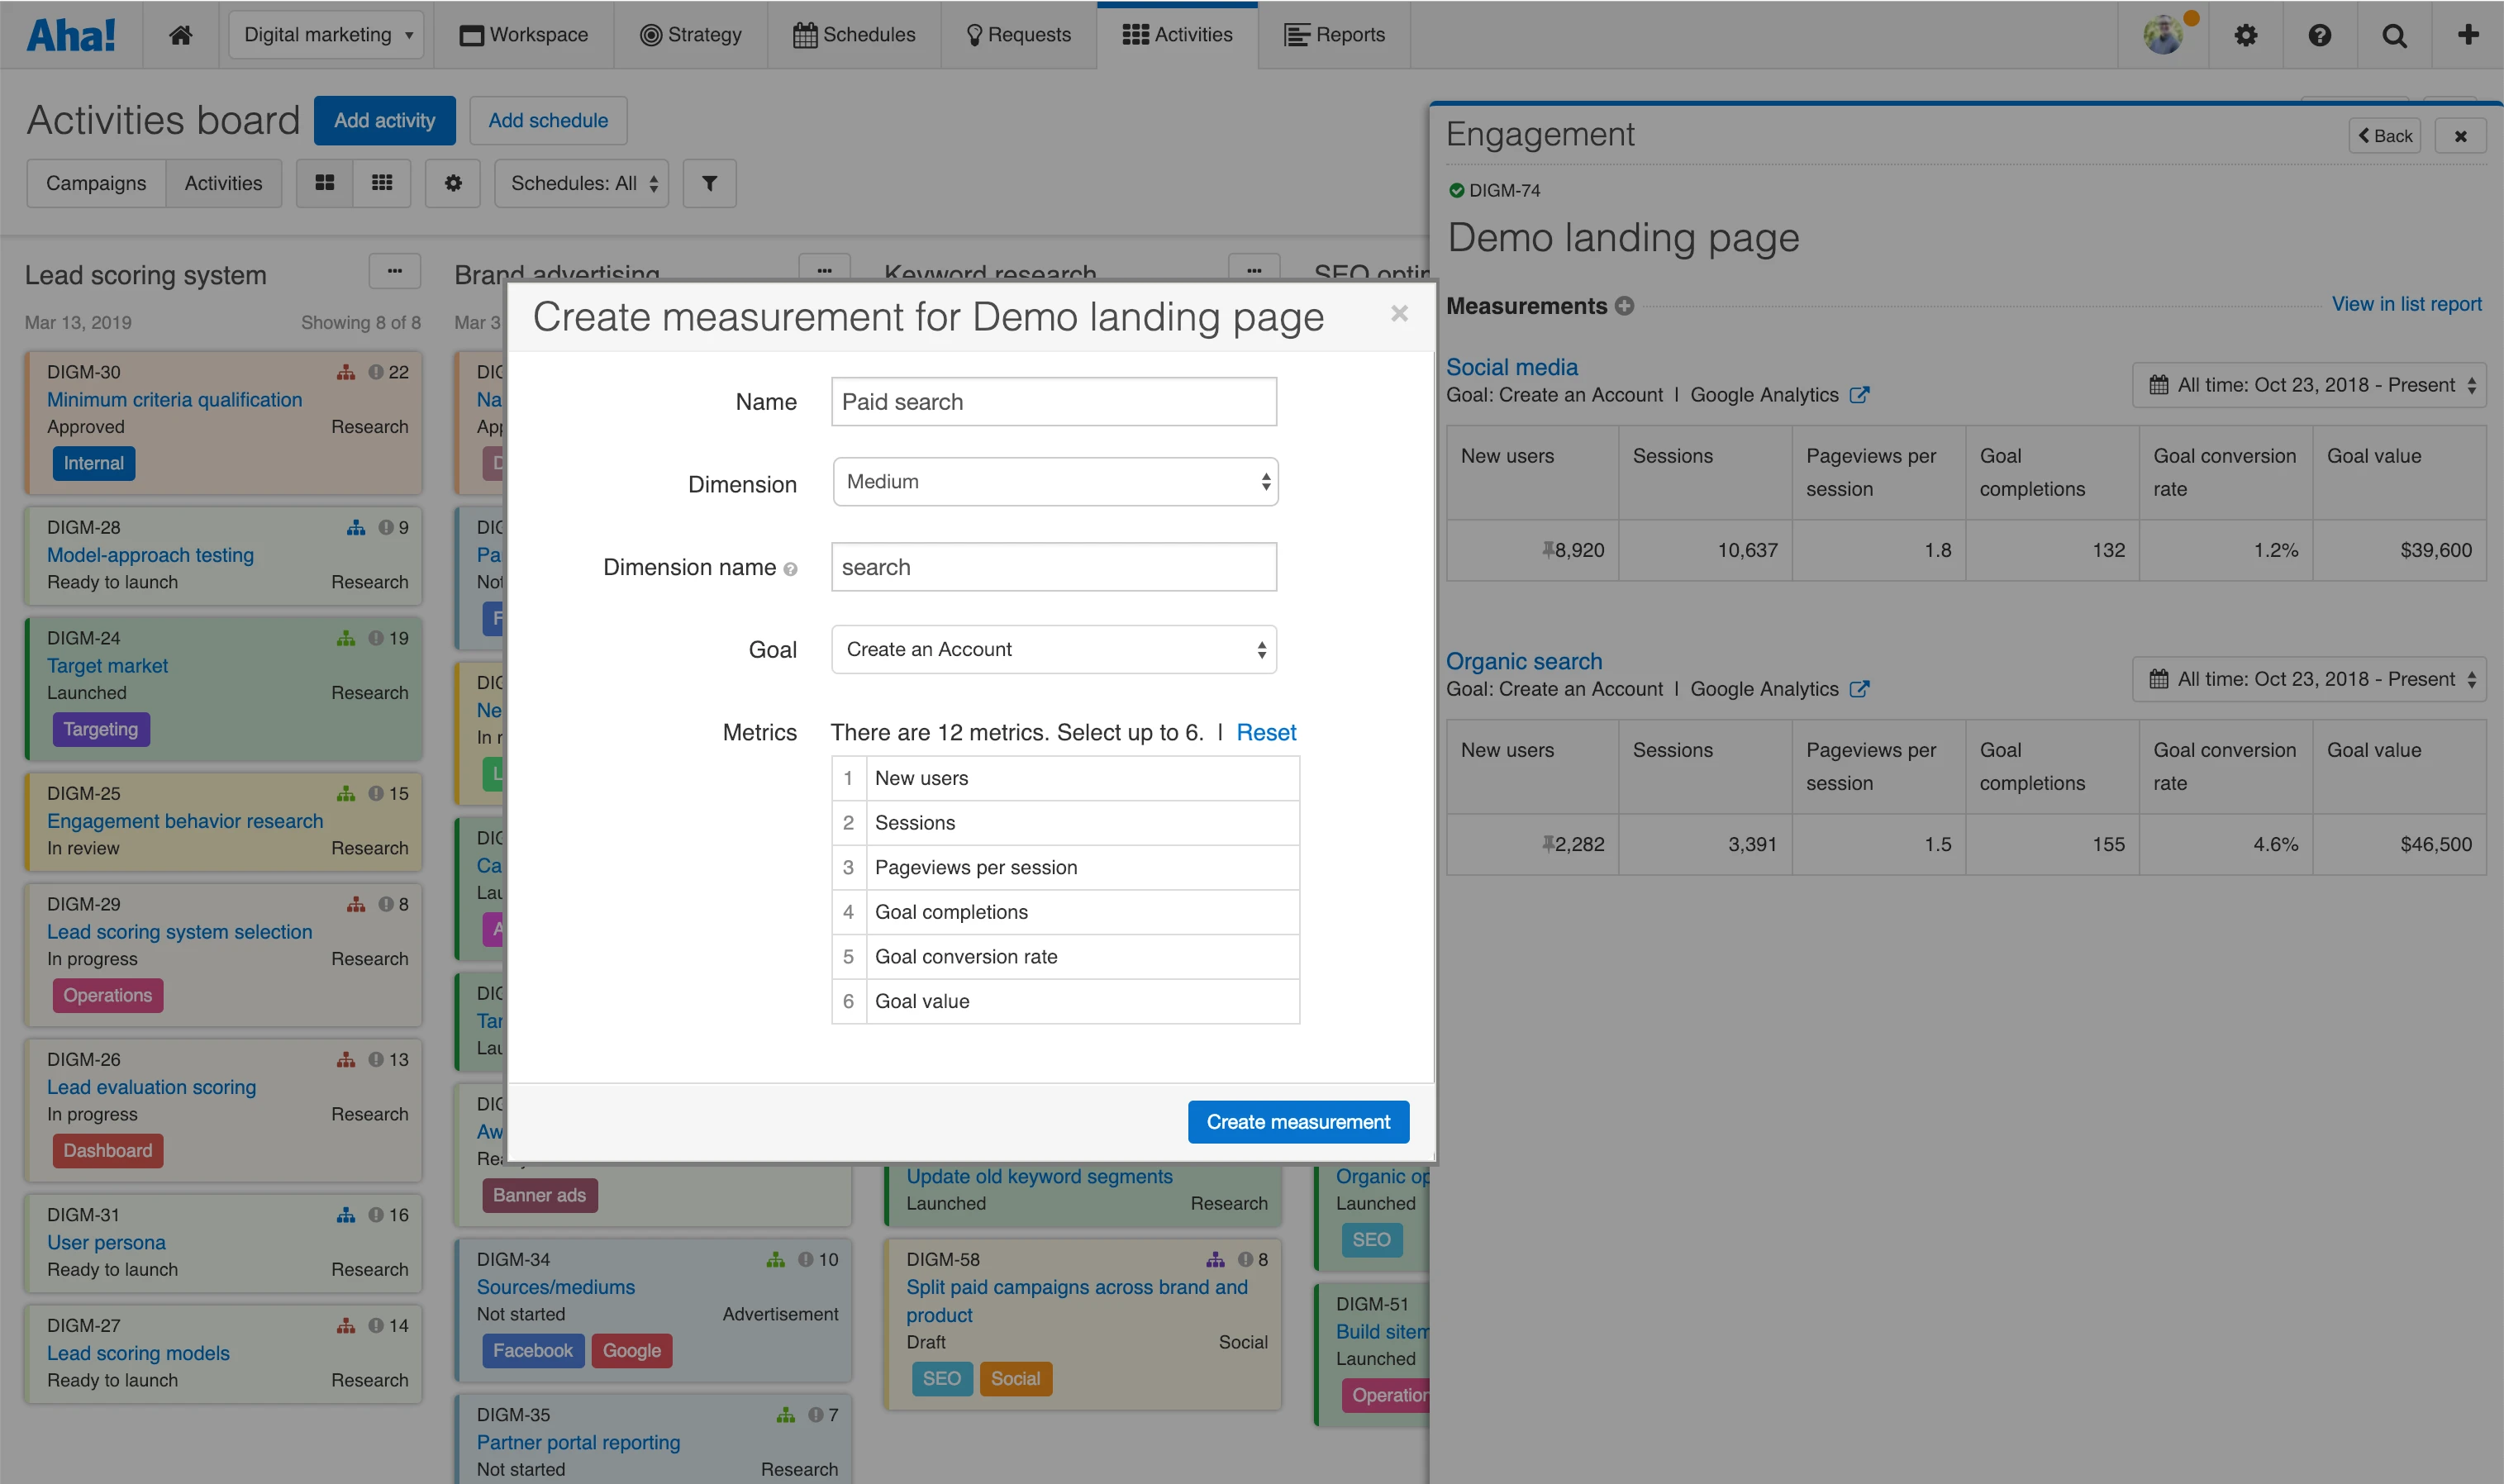
Create measurements Add as many measurements as you need to understand performance — each measurement is based on a specific dimension in Google Analytics. You can segment by attributes such as browser, landing page, source, or medium. Once you have selected the dimension, choose the goal (or desired outcome) that is most important to you. Then, select up to six tracking metrics that you want to display in the engagement details.
Track metrics including page views, sessions, pages/session, bounce rate, average session duration, goal completions, new users, users, goal conversion rate, and goal value.
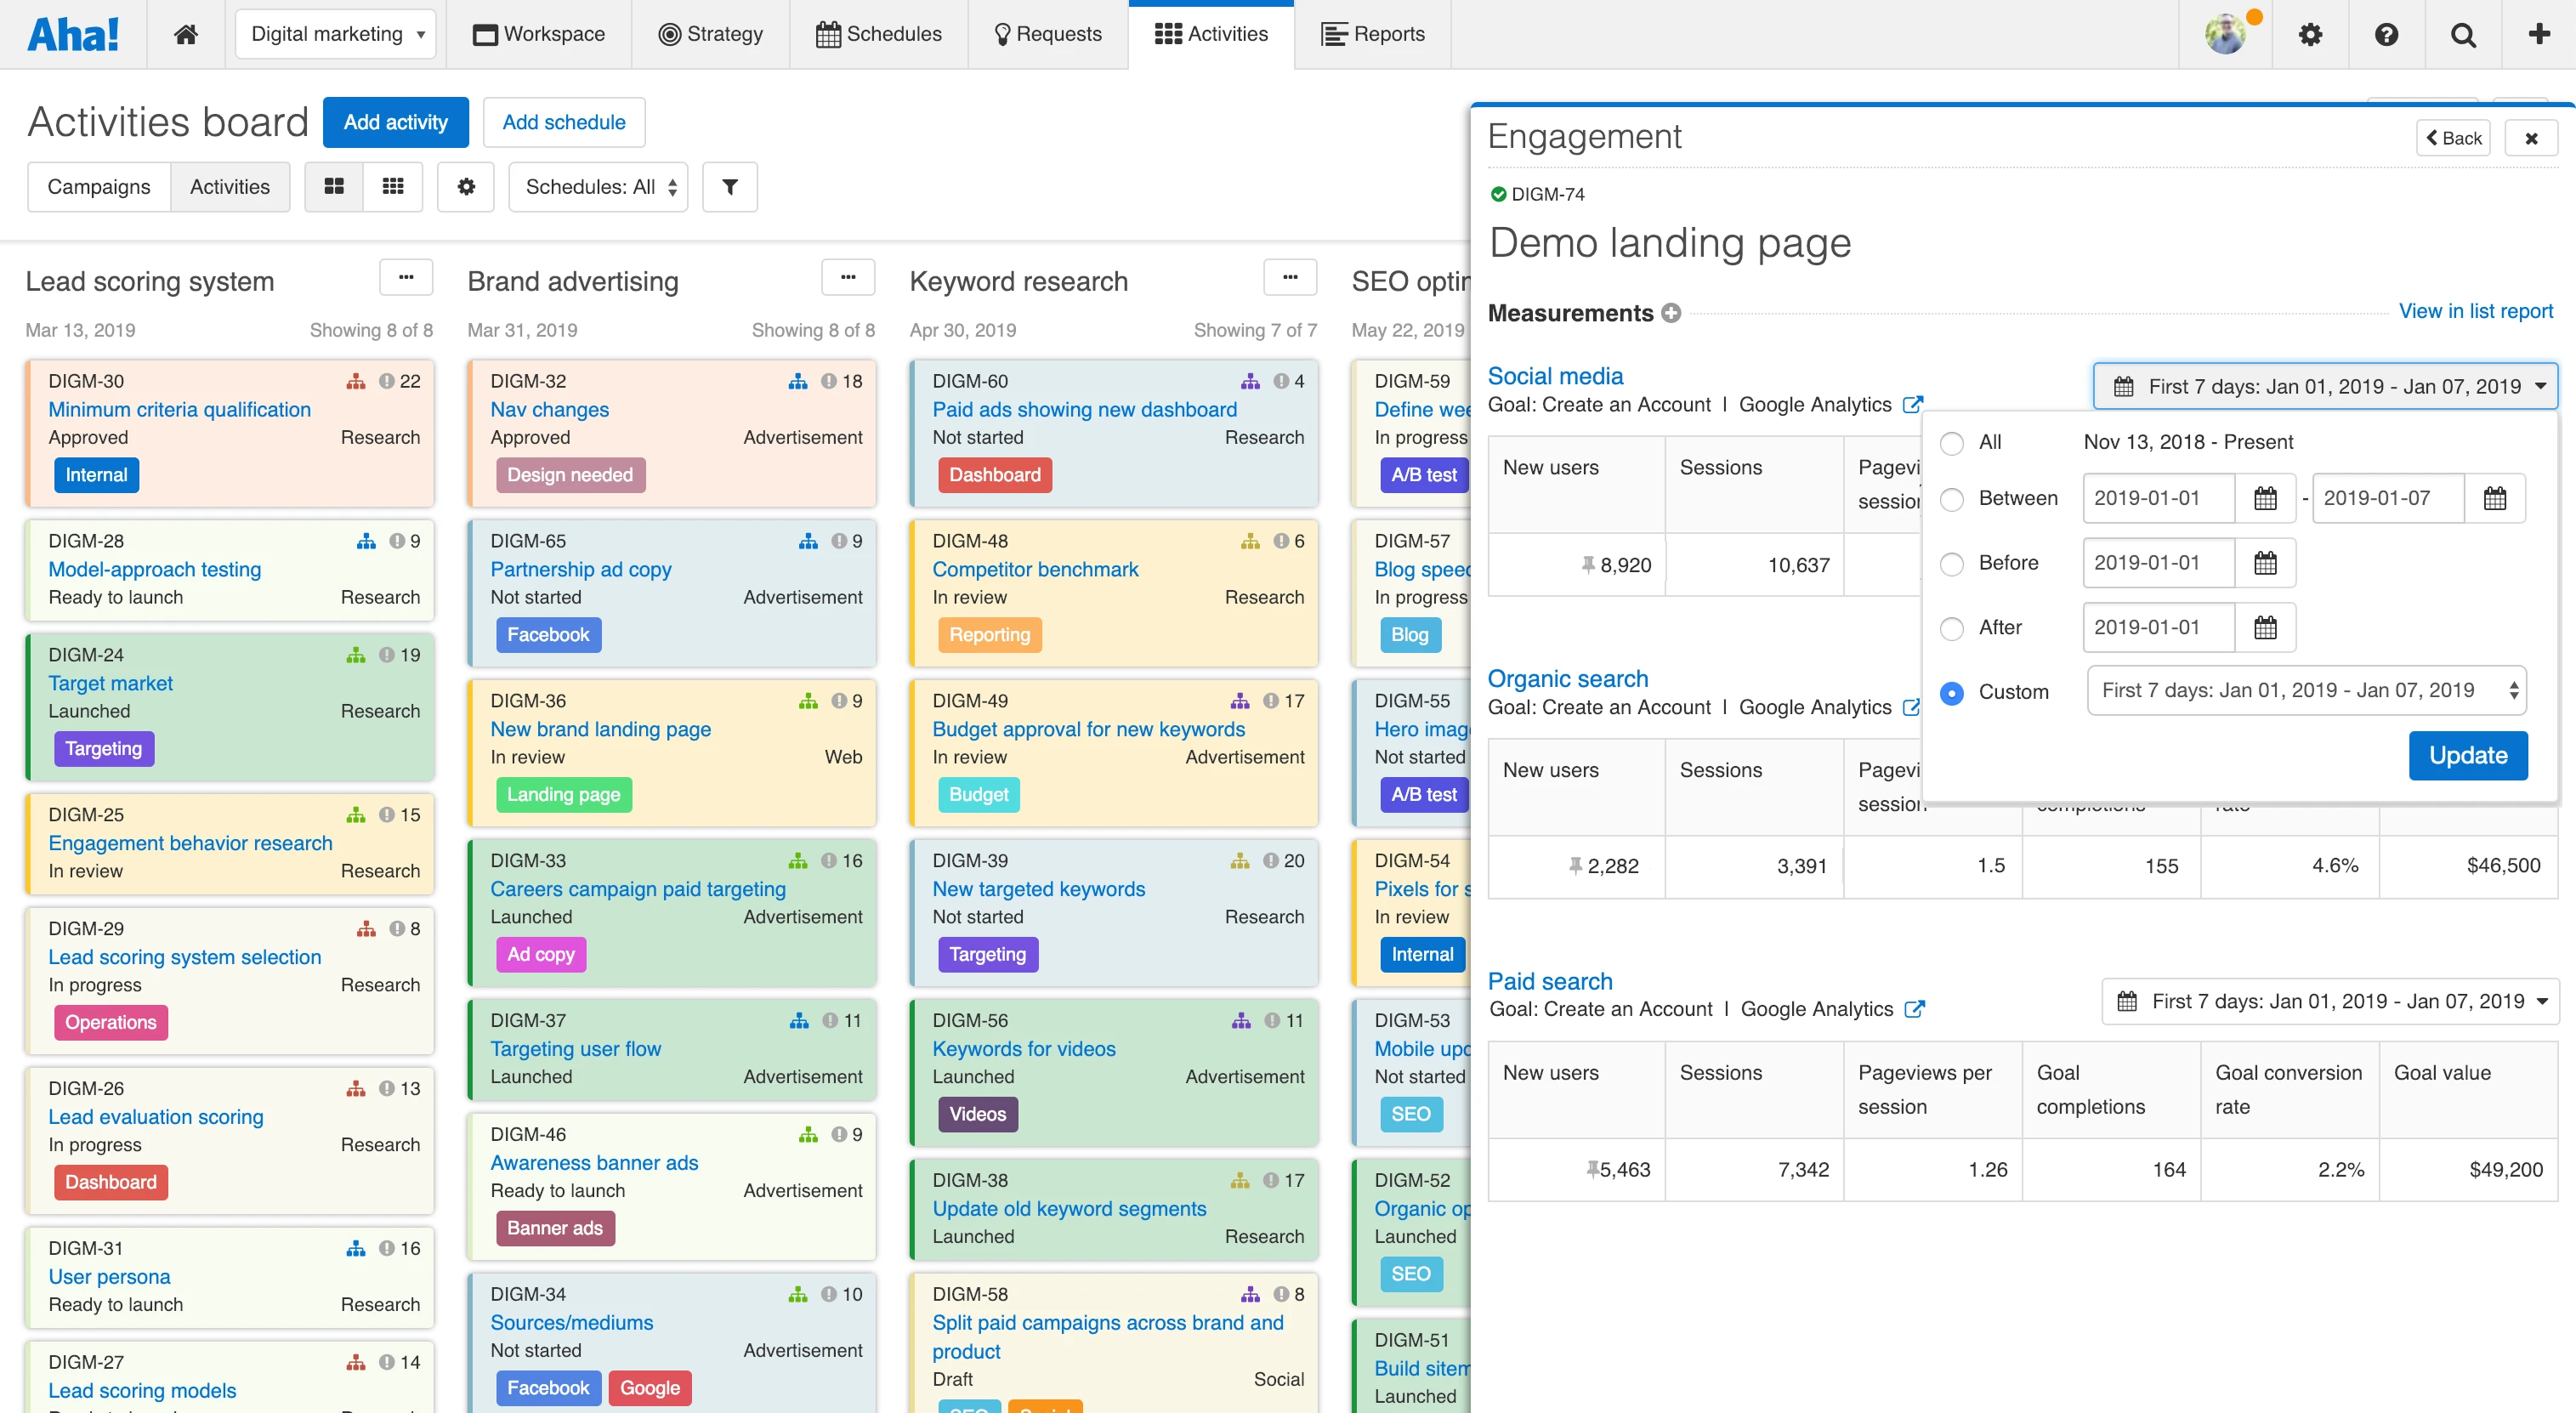
Review performance over time View your marketing results across specific date ranges. For example, you might want to see the number of new users a landing page creates within the first seven days of launching. Or, you might review all-time performance to inform plans for upcoming landing pages. The ability to choose an exact time period can help you isolate data to find meaningful insights.
You can choose specific date ranges or set custom time frames, such as the last 30 days.
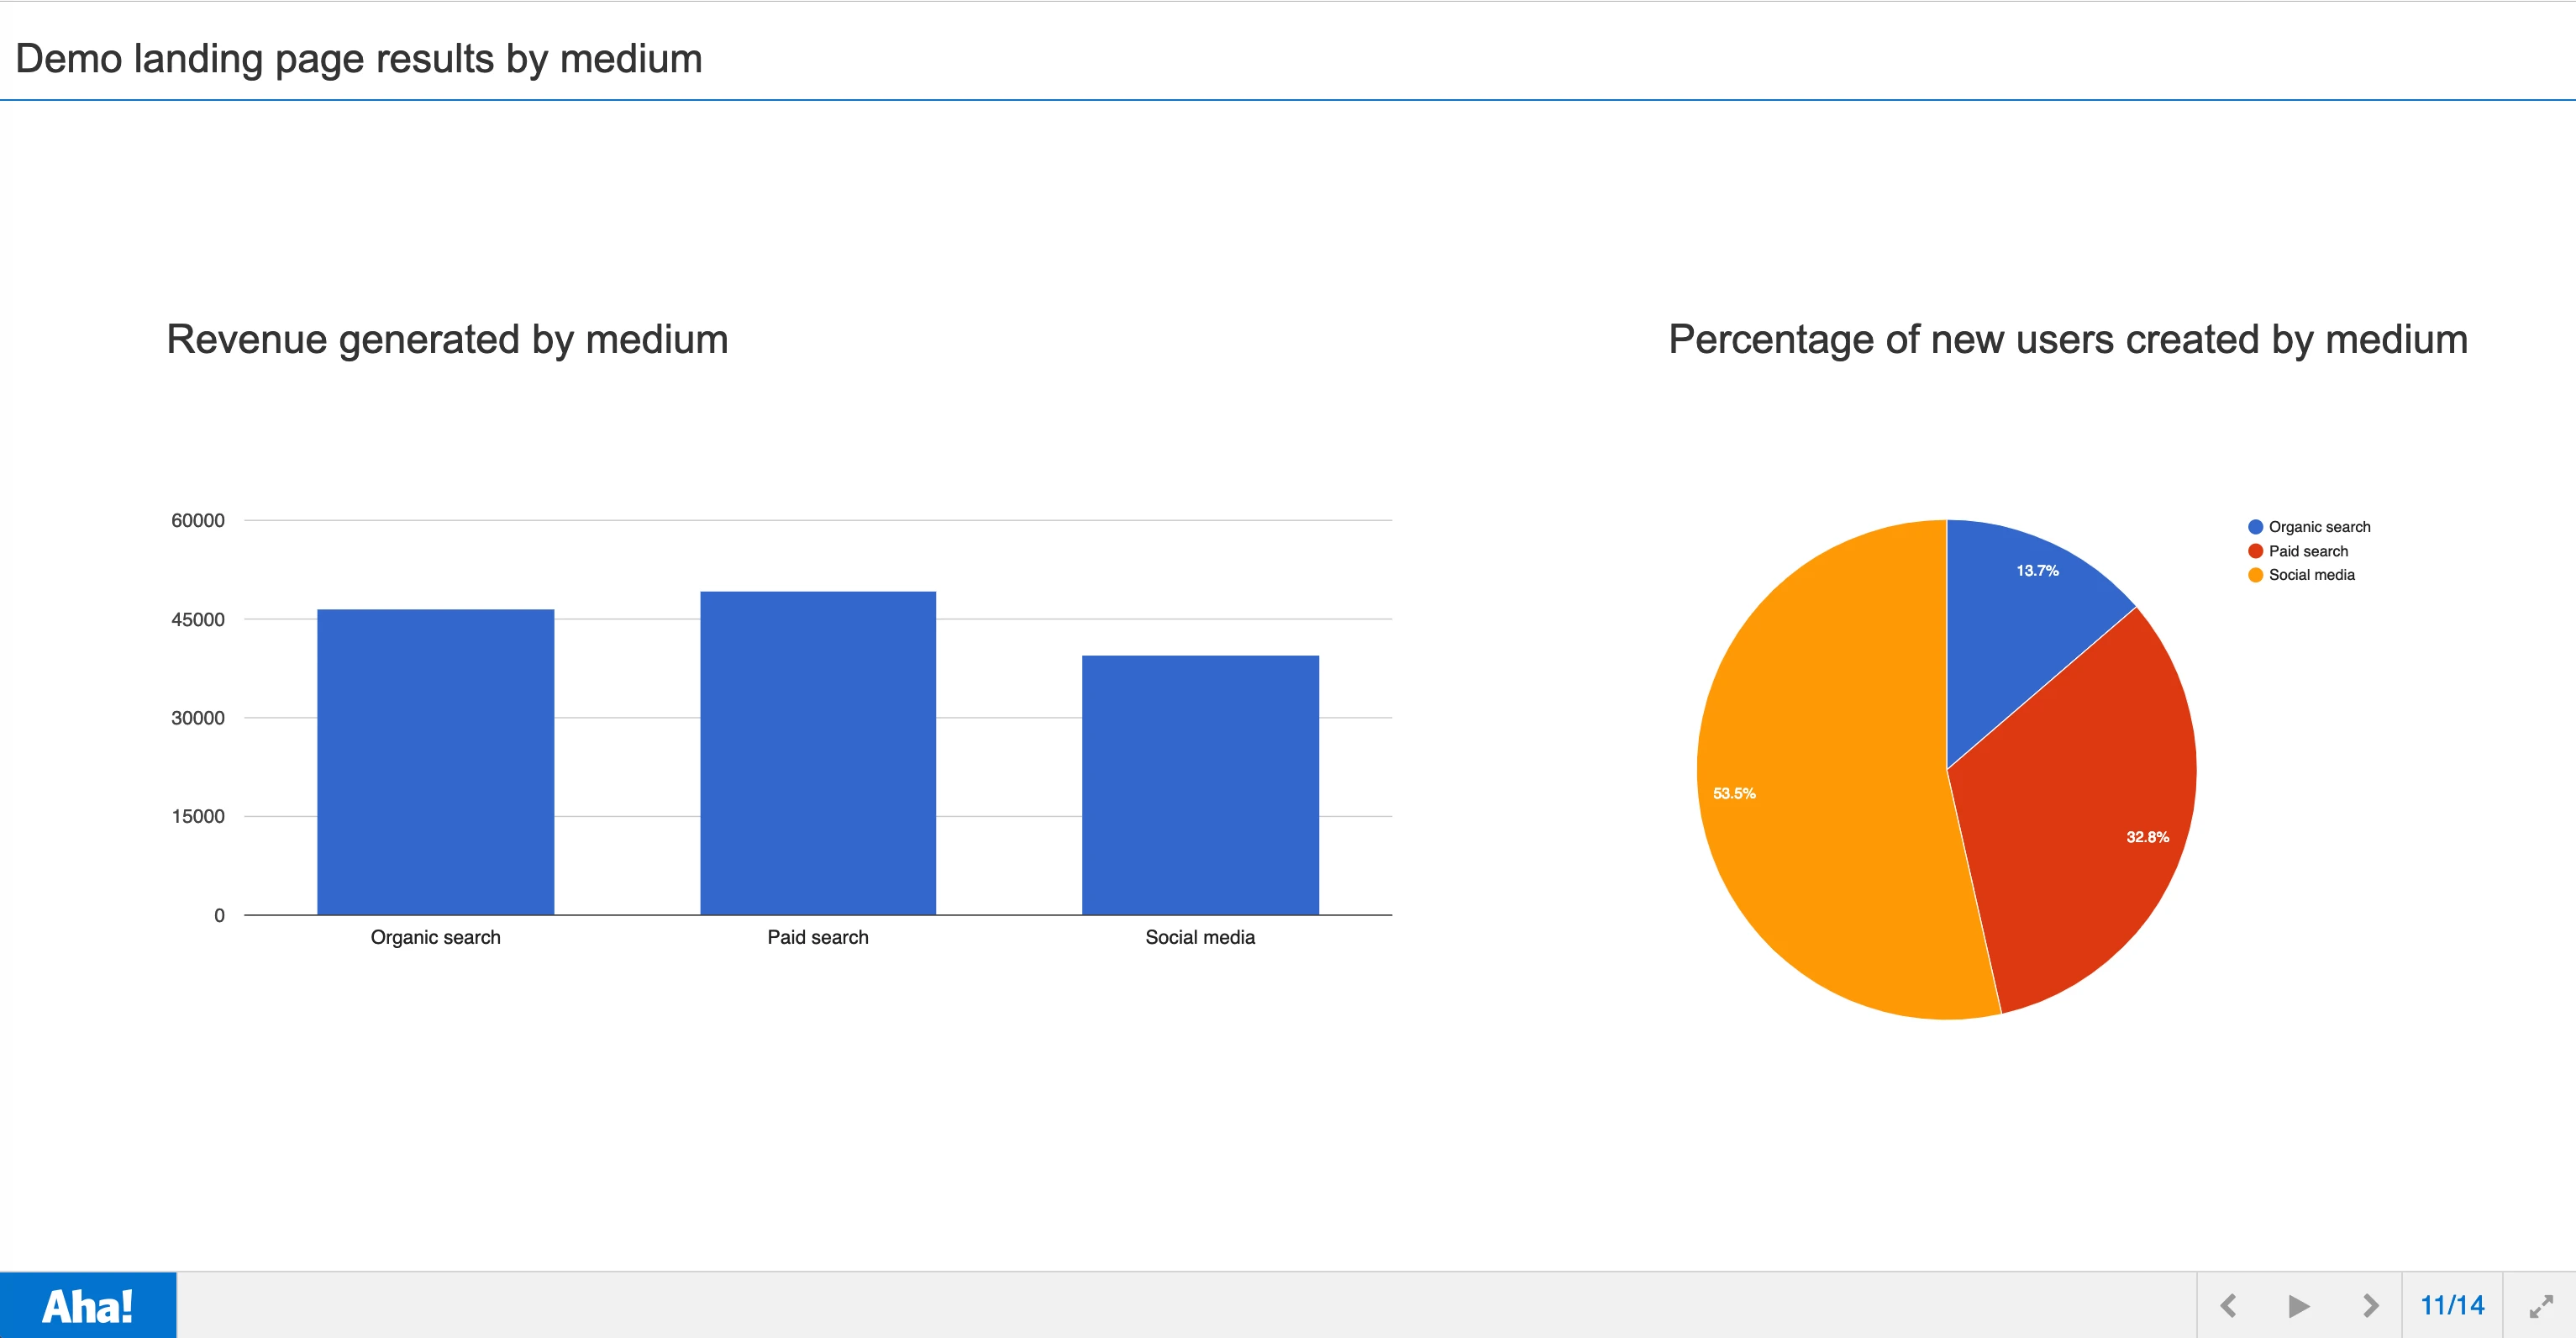
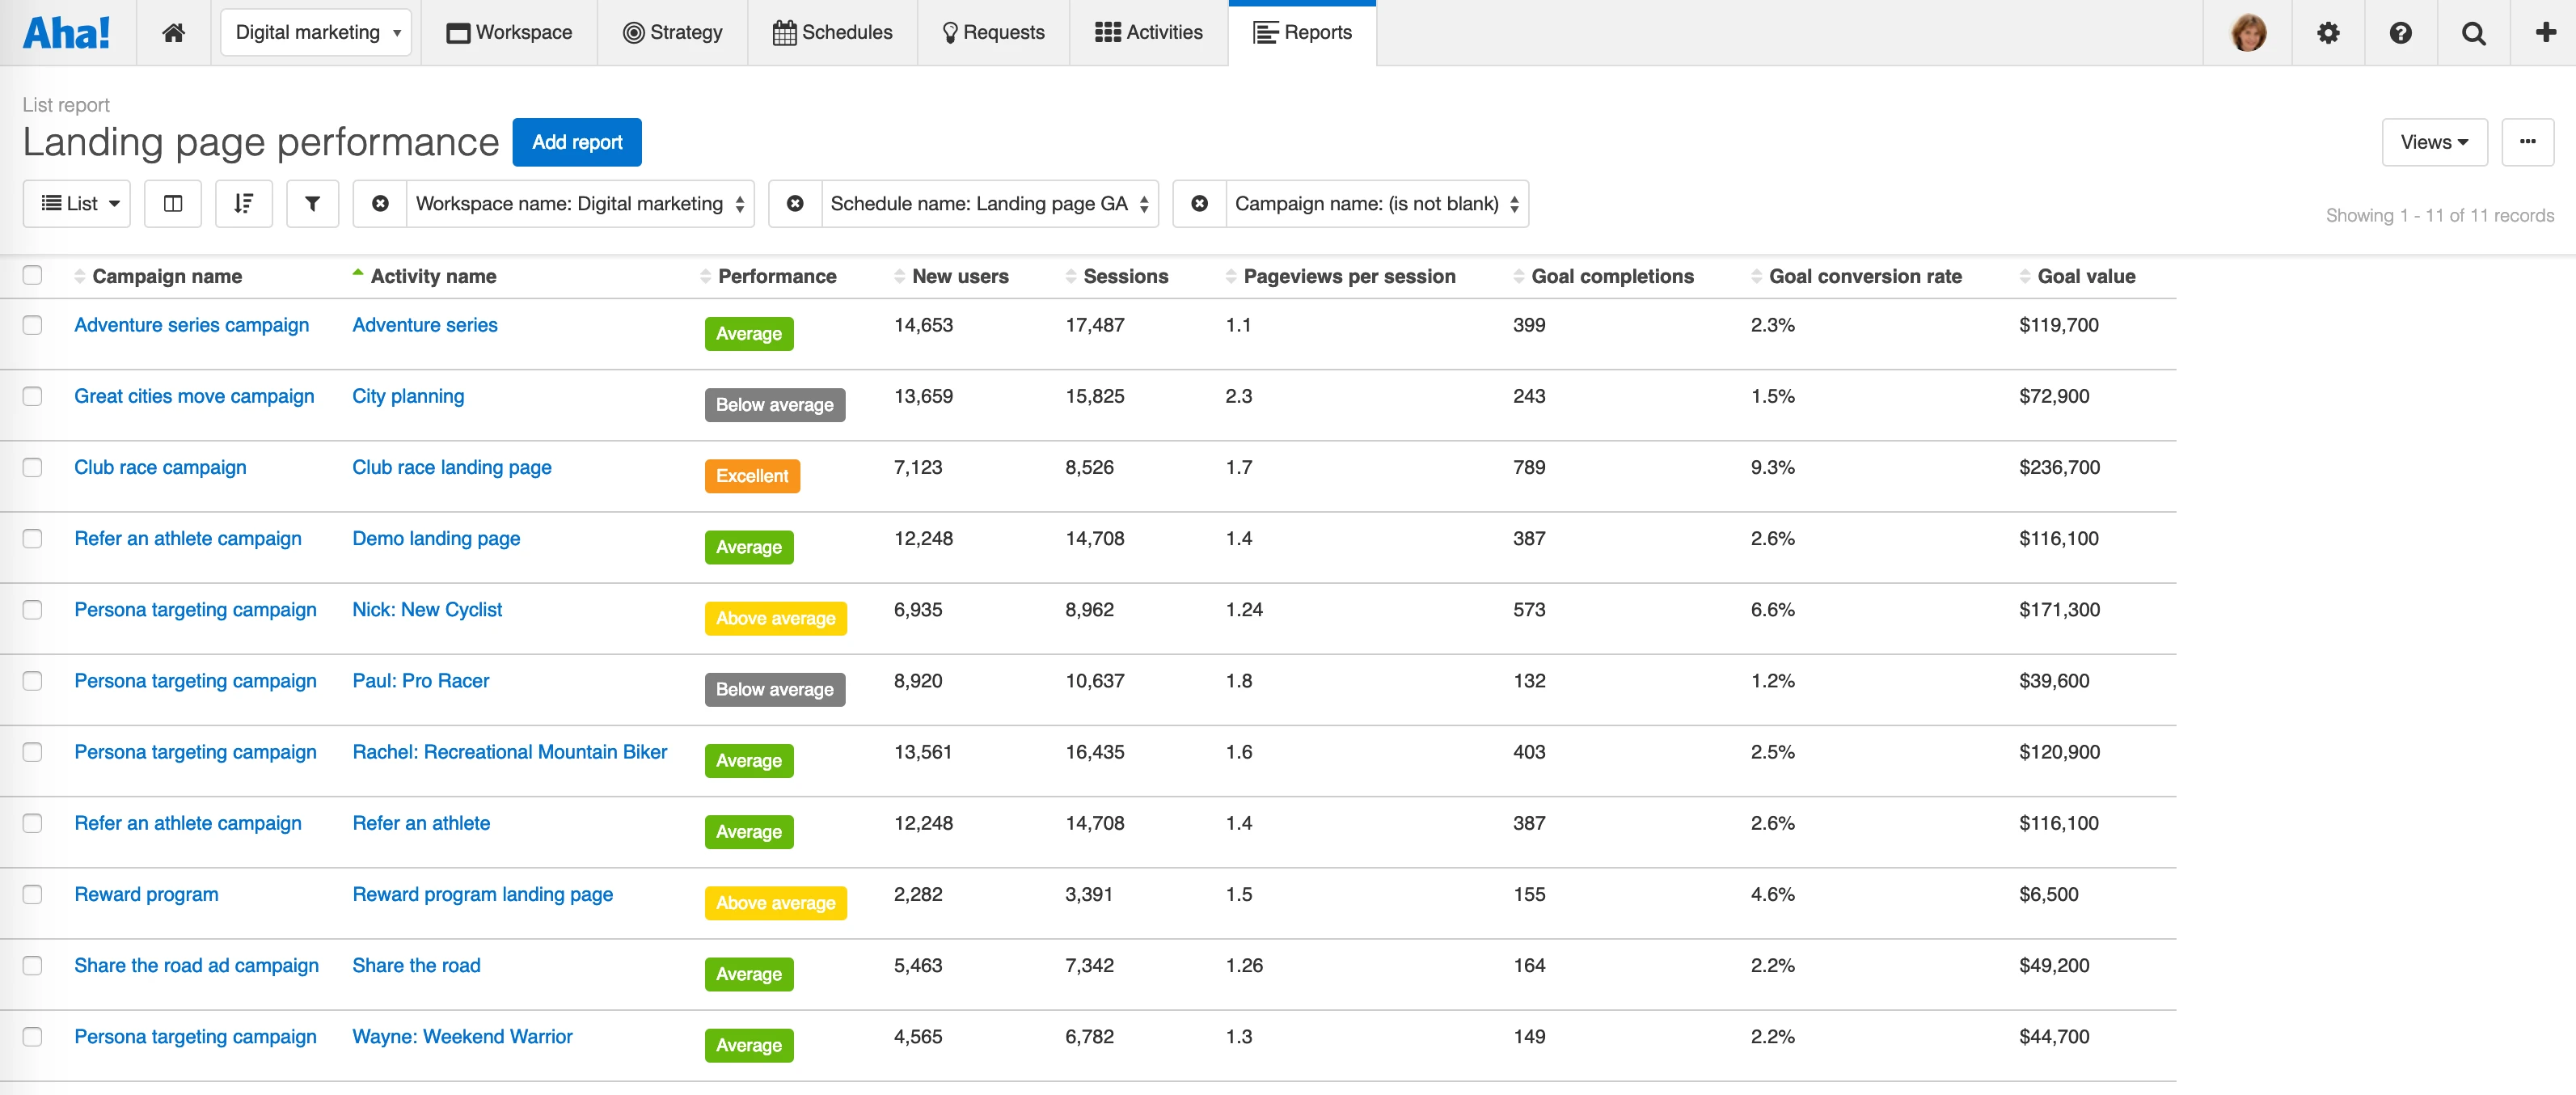
Report on the results Create visual charts and reports to analyze your marketing programs and determine where to invest in the future. In this example, we are looking at the strategic impact of a landing page. The bar chart compares the revenue generated through organic search, paid search, and social media, while the pie chart shows the percentage of new users created by each medium.
Add your report to an Aha! notebook so you can share it with cross-functional teams via a PDF or secure web page.
Strategically align your marketing work and connect it with Google Analytics to measure the impact of your online programs.
Your marketing data is even more valuable when you tie it directly to the work you did. That is why we are excited to enhance our integration with Google Analytics — so you can bring the work and results together in one place.
Sign up for a free Aha! for Marketing trial — be happy The integration with Google Analytics is available to all Aha! customers who have set up a marketing workspace. If you are not already a customer, you may want to sign up for a free 30-day trial or join a live demo. See why more than 250,000 users trust Aha! to set brilliant strategy, capture customer ideas, create visual roadmaps, and manage breakthrough marketing programs.
If you are an existing Aha! customer, you can quickly set up marketing workspaces and use the Google Analytics integration in your account at no additional cost.