Just Launched! — Visualize Strategic Goals and Initiatives With Custom Charts


Great products start with a clear vision and strategy. You need to know where you are headed and why. And every business has a strategy that is unique to their organization and the products they sell. That is why we allow you to customize Aha! to match exactly how your team works.
And today we are taking that level of customization one step further. You can now customize how you visualize your goals and initiatives in Aha! by changing the charts that are used to present your plans.
No matter where you are in the strategic planning process, you can use Aha! to visualize and compare goals and initiatives, and even report on their status. We have done this by allowing you to customize goals and initiatives charts by changing the text of the default labels and axis.
There are dozens of unique ways you can customize your goals and initiatives. Here are a few examples:
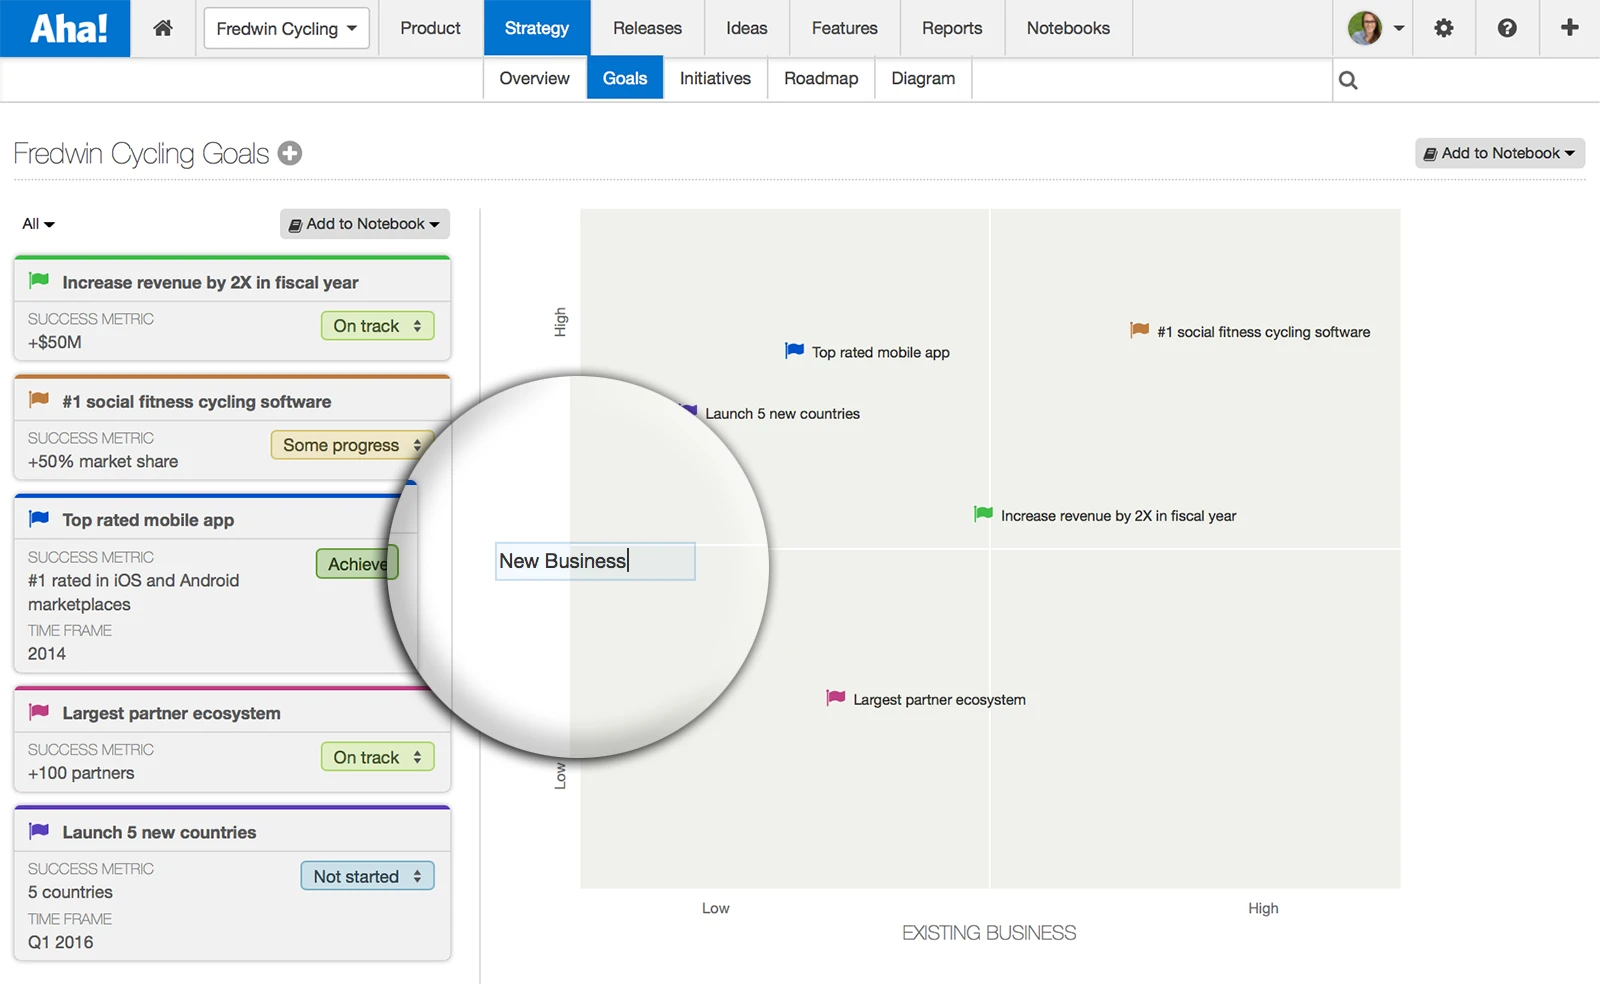
Decide which goals to pursue You can now visualize goals with custom labels to help you better understand and visualize which ones to pursue. For example, some goals may be specific to creating new lines of business and others to building your existing business. By editing the text of the default labels on your goals chart, you can use terminology that fits how you want to map them.
Use custom chart labels to rank goals for new business vs. existing business.
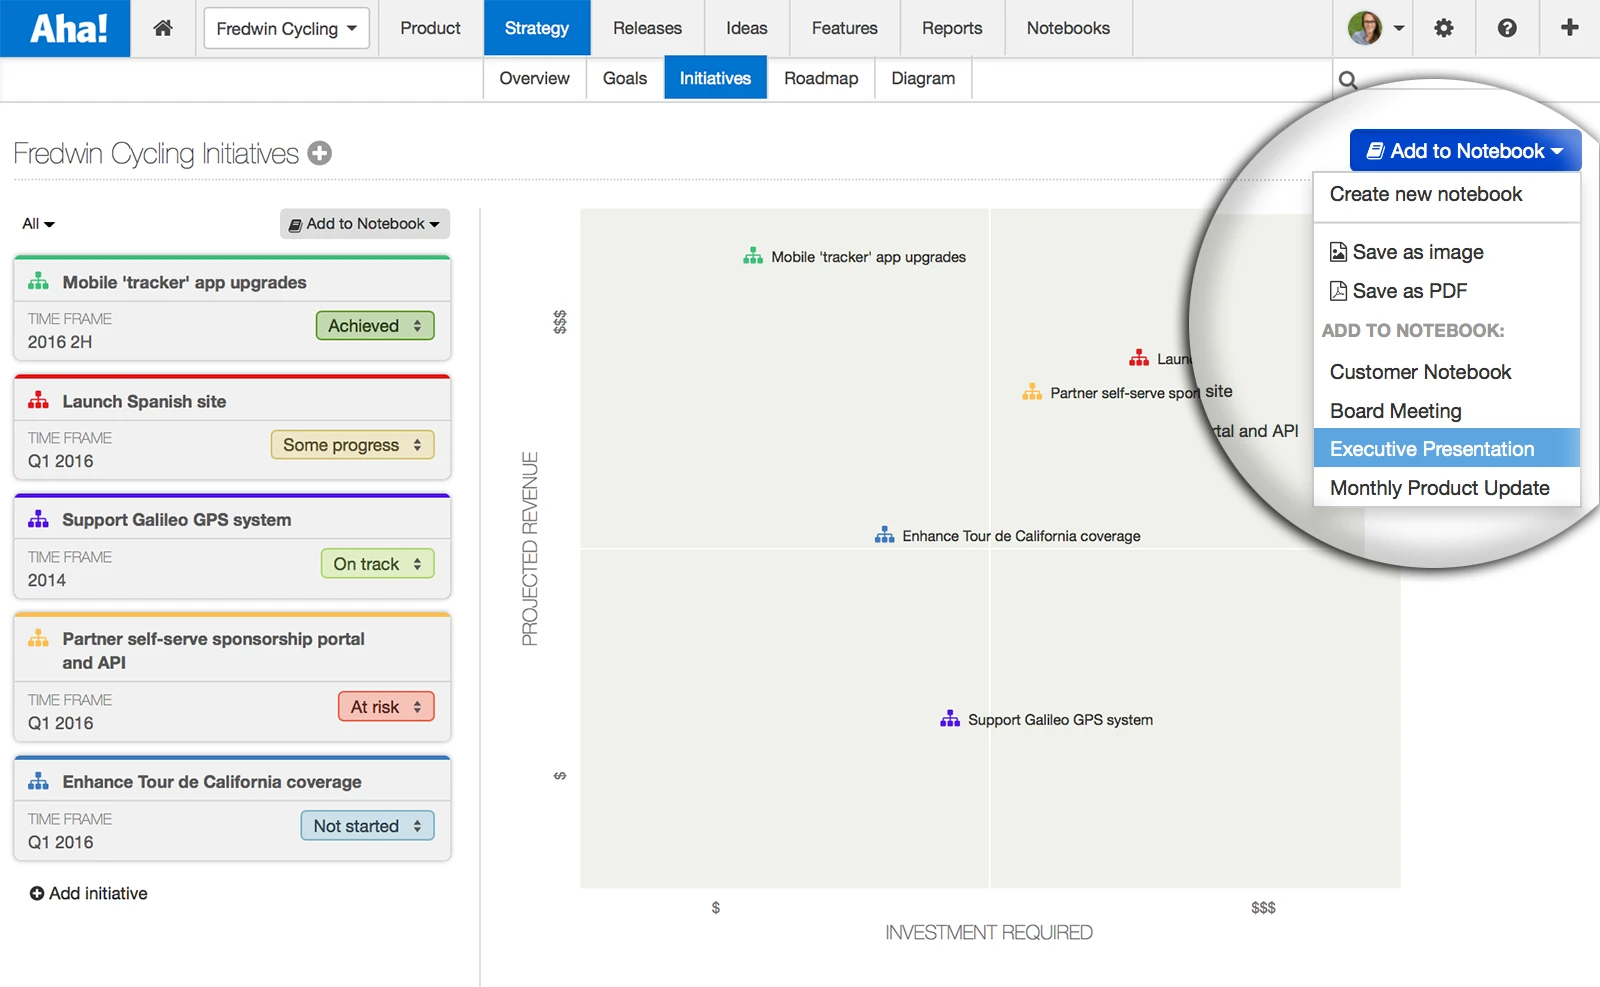
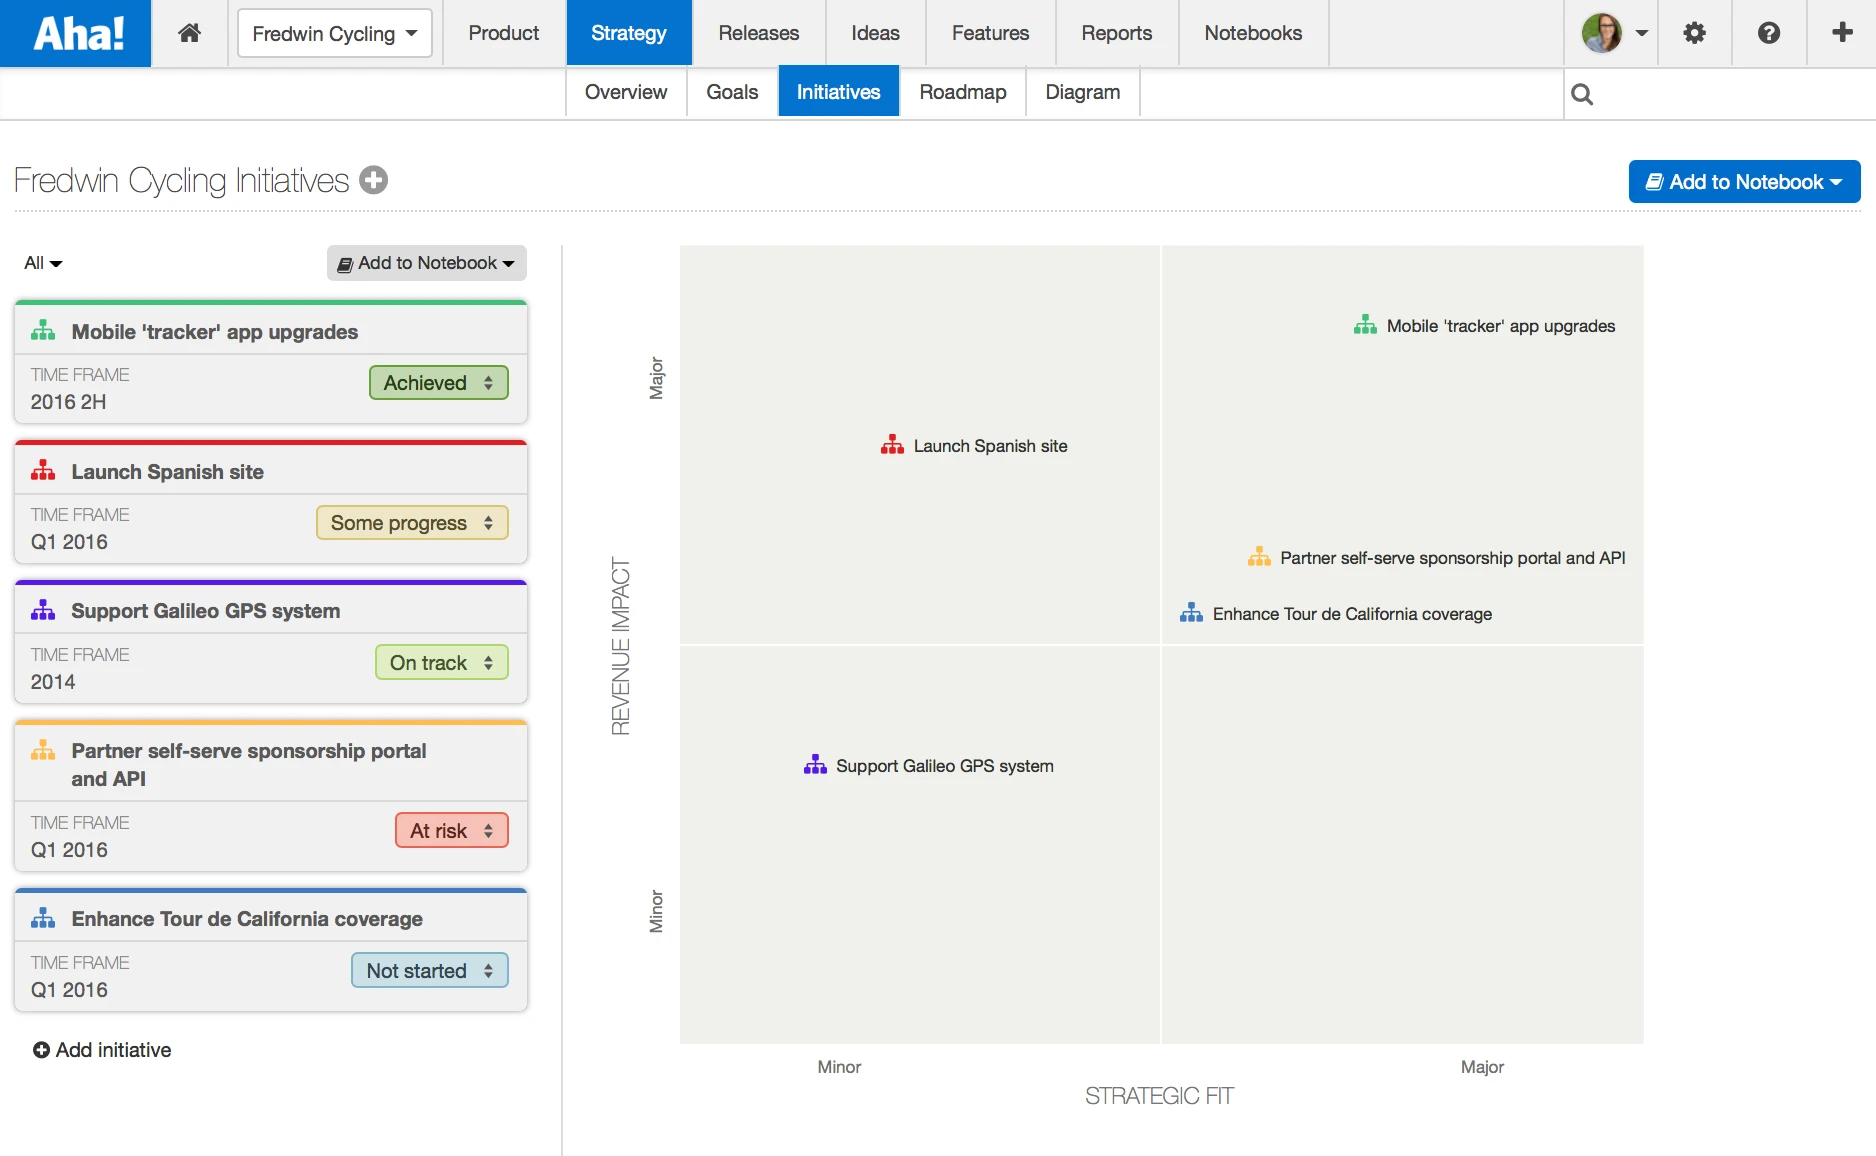
Prioritize which initiatives to fund You can also customize the labels on charts for initiatives based on factors that are most important to you. In the example below, a custom chart shows a comparison of projected revenue vs. the investment required. Visualizing the expected impact of your initiatives will help you make more intelligent prioritization decisions. Then, you can share the plan with your team by adding your custom initiatives chart to a Notebook or saving it as an image or PDF.
Add your custom chart to a Notebook as a live view or snapshot in time.
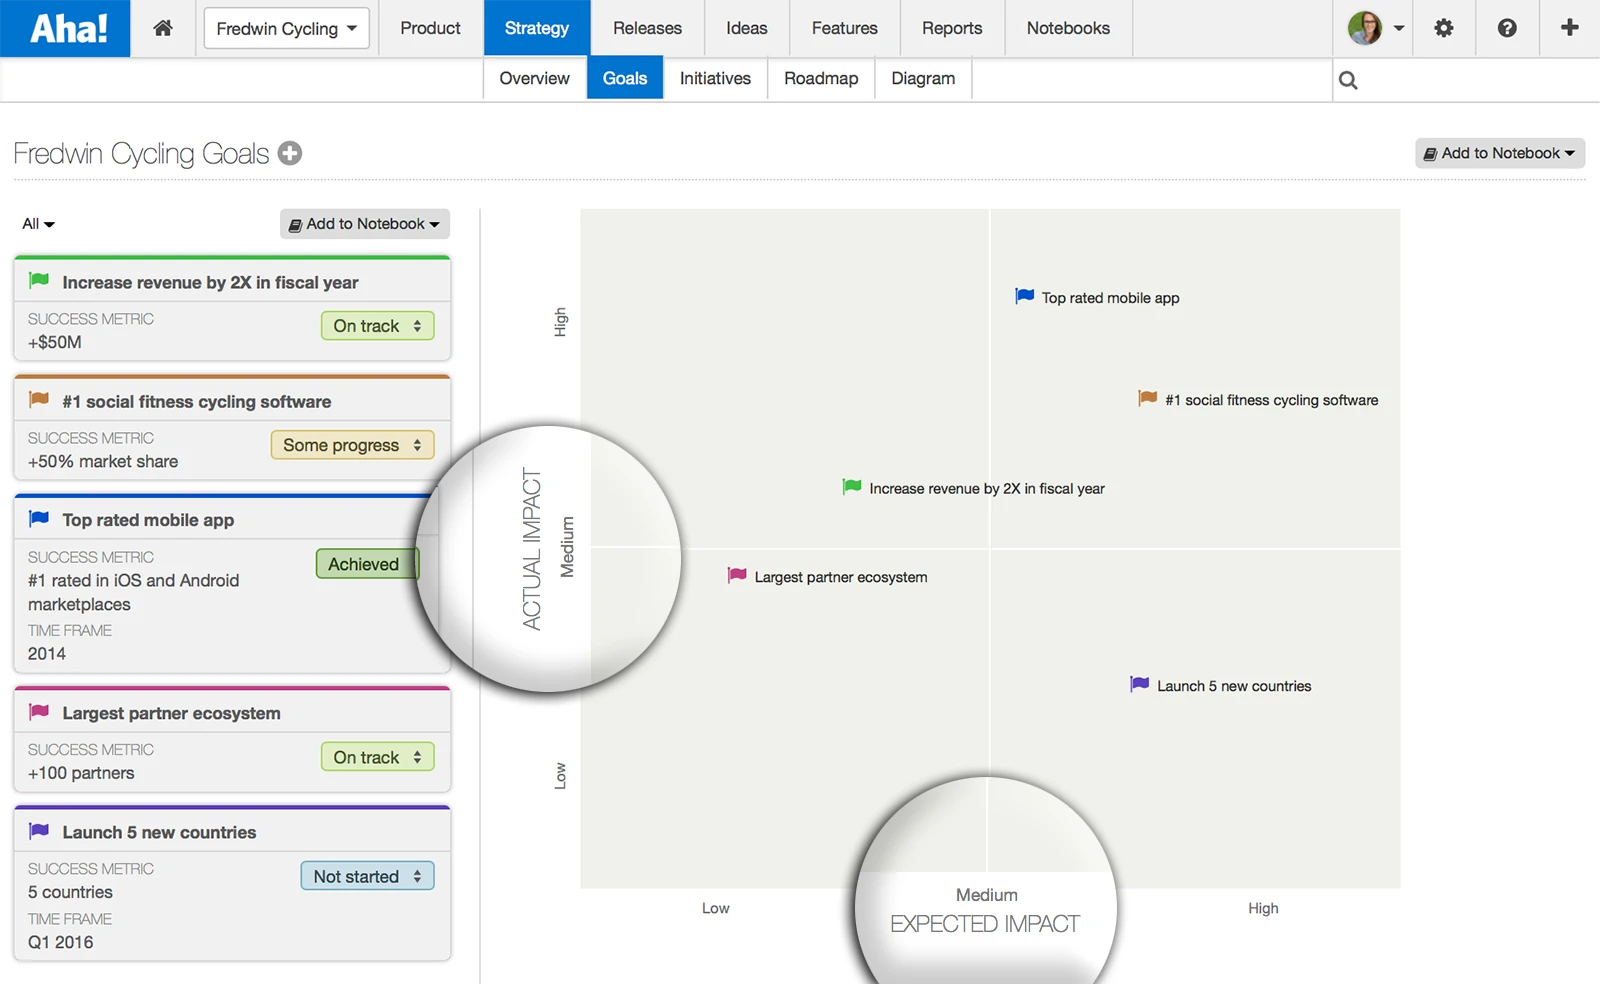
Compare actual vs. expected results As work evolves, you can continue to change labels and create additional strategic planning visualizations. For example, you can change the labels to present the actual impact and expected impact to assess your strategic planning capabilities.
Compare actual impact vs. expected impact to determine how work is progressing against your goals.
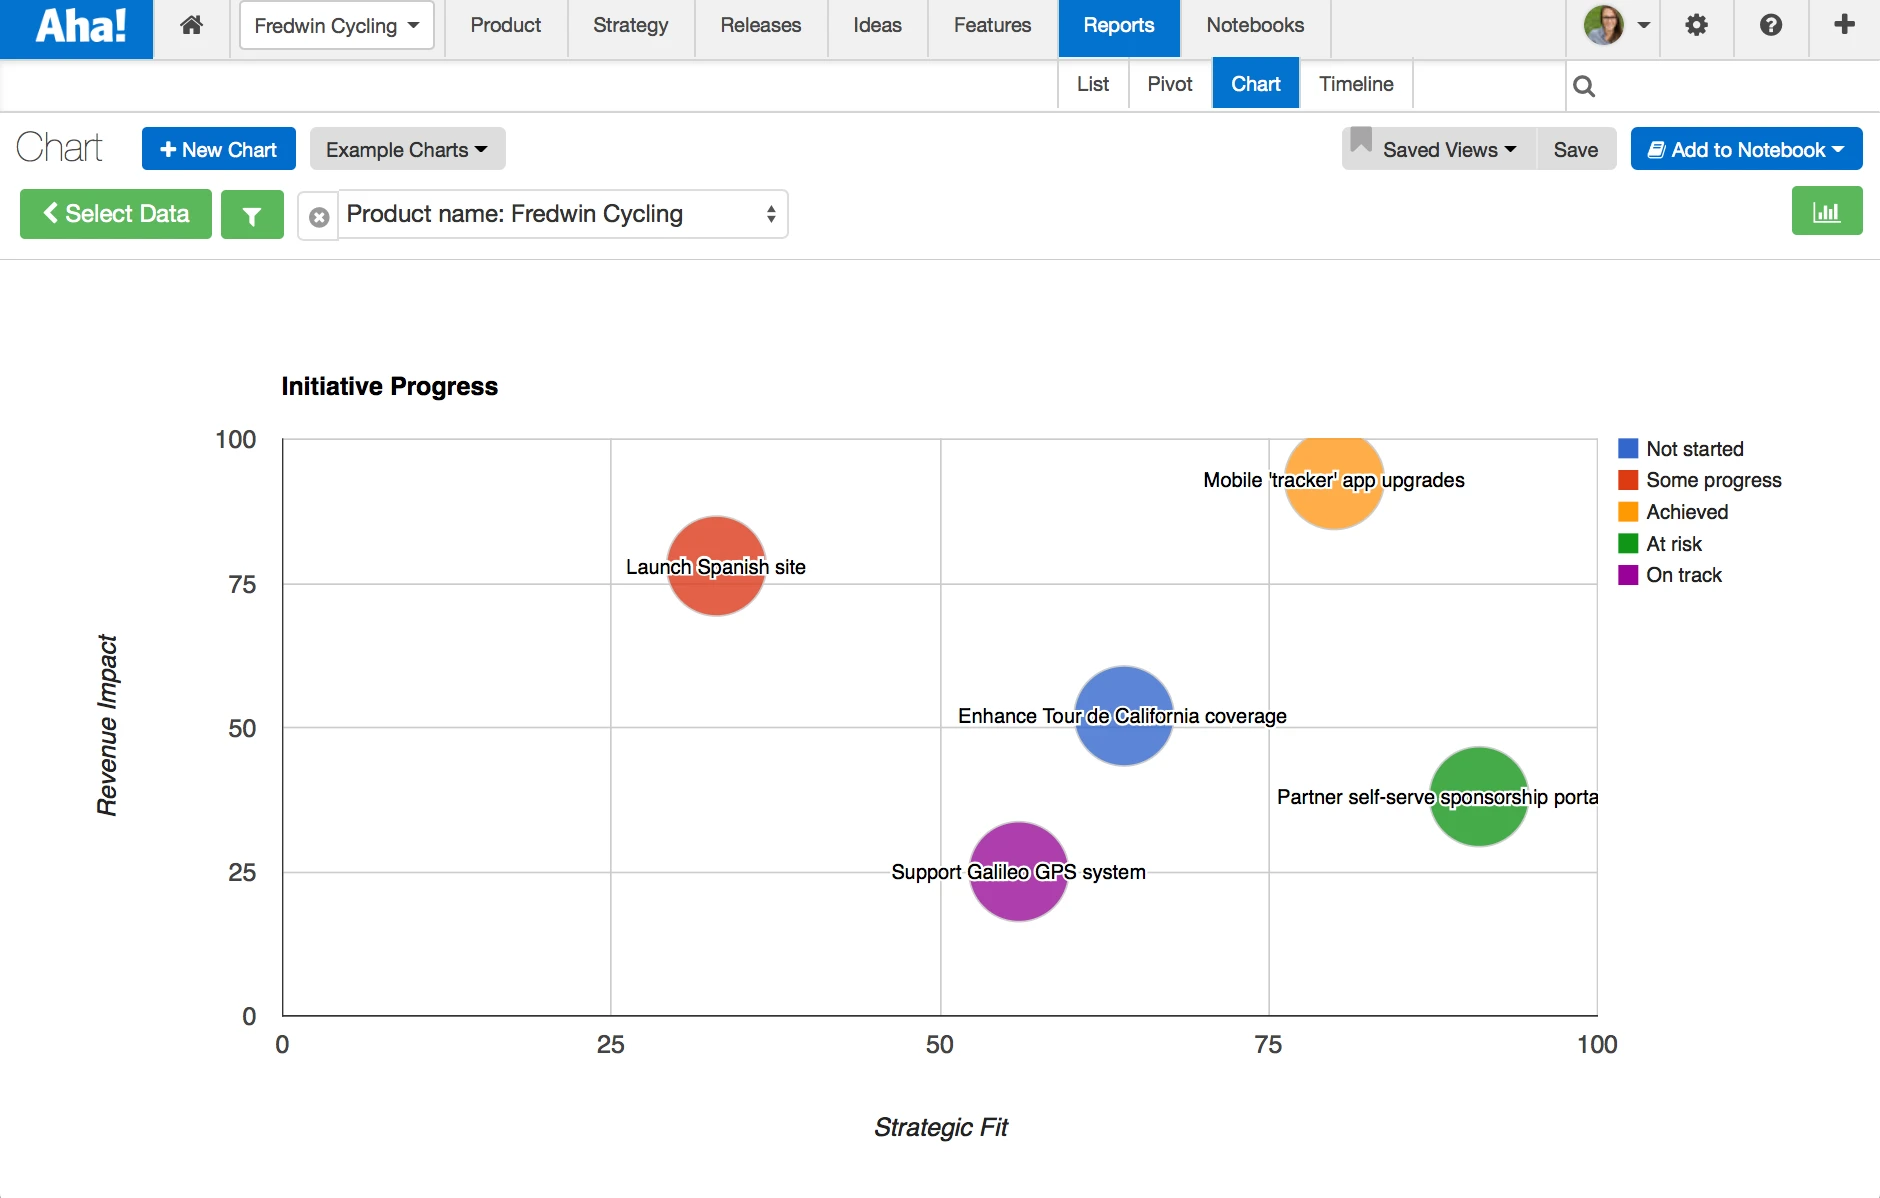
Report on and share progress In addition to planning and prioritization, you can report on the progress of your initiatives throughout the year. Track and share progress with your team to make sure that you are on pace to achieve your goals.
Choose from a variety of reporting capabilities including custom graphs, timelines, and tables.
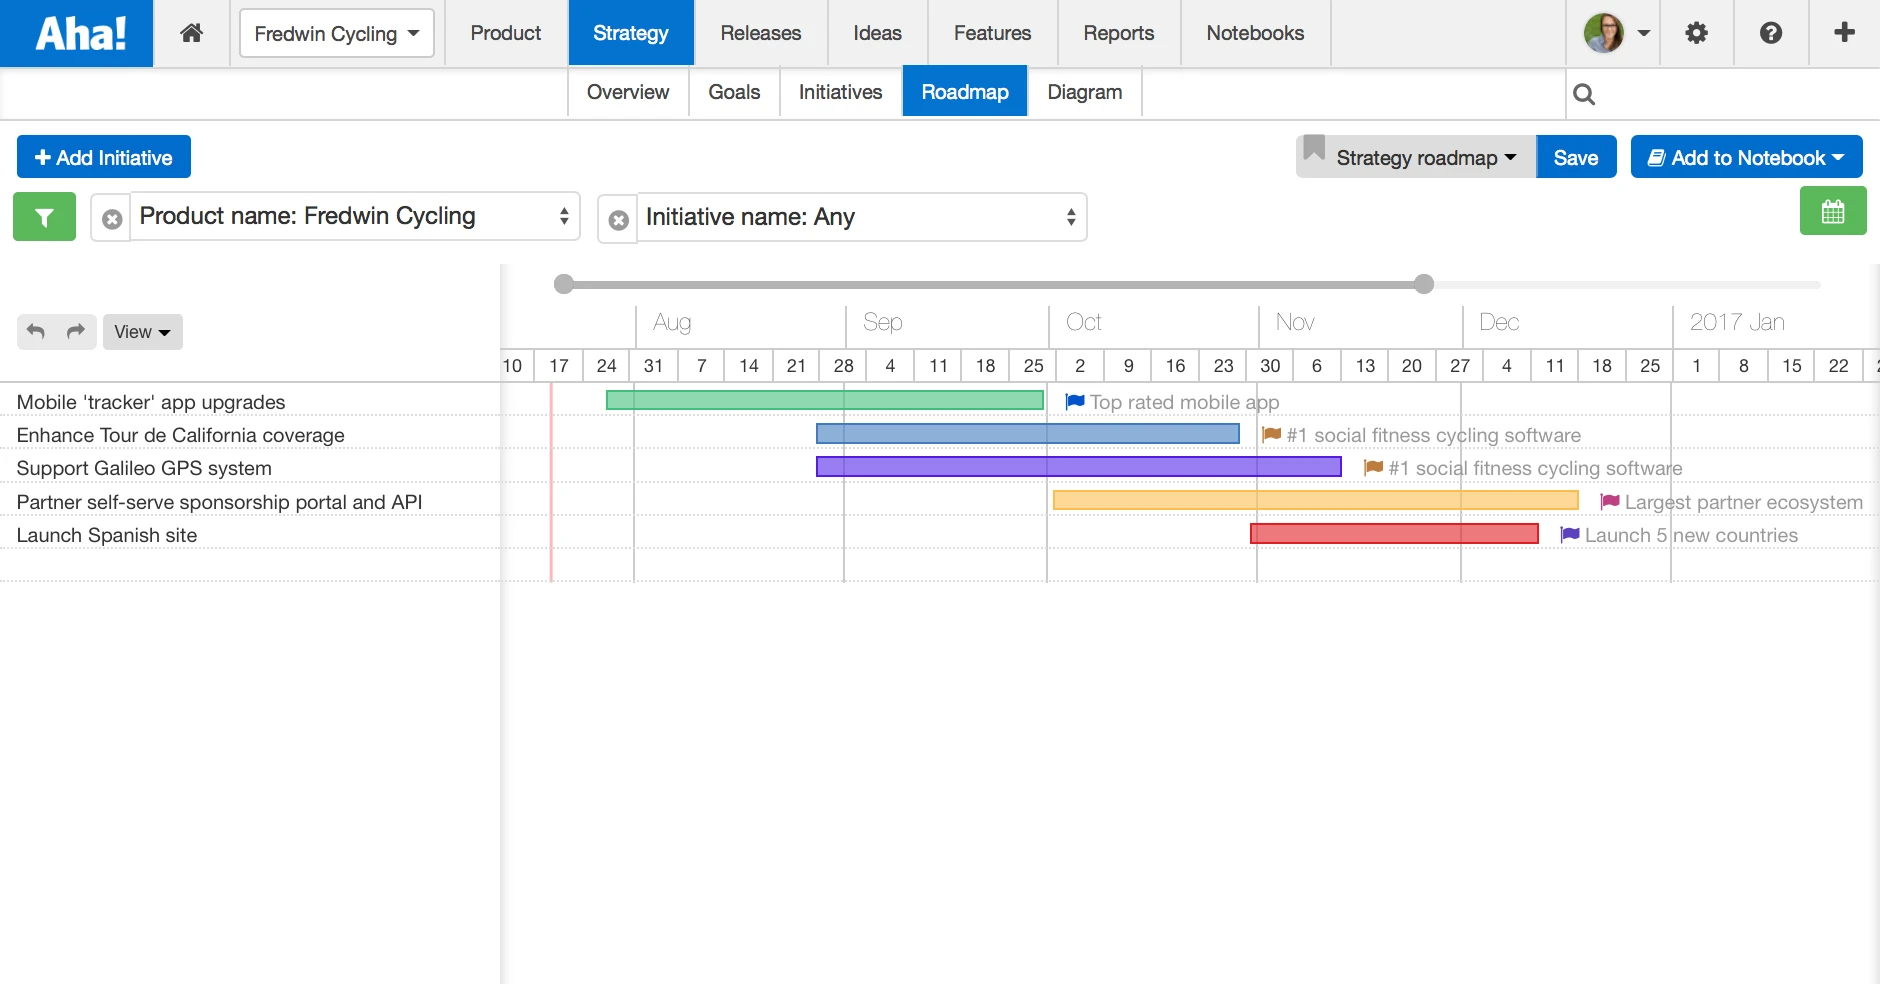
Visualize and share a strategic roadmap Finally, you can build a visual strategy roadmap to showcase your new goals and initiatives. This ability already existed in Aha! and allows you to highlight the timing of each prioritized initiative and the goal it supports. Use your strategy roadmap to ensure that the team is moving in the right direction and focusing on what matters most.
Visualize a strategy roadmap that displays your high-level goals and initiatives.
Getting strategy right is hard, but fundamental to any successful business. And to get it right your team must understand it and be engaged. This new capability gives you the ability to quickly visualize and share your strategy with your team.
So what are you waiting for? Start by adding your goals and initiatives, then completely customize your charts to visualize your strategy in a way that maps to your business.
Sign up for a free Aha! trial — be happy Custom goals and initiatives charts are available to all Aha! customers. If you are not already an Aha! customer, you may want to sign up for a free 30 day trial now. Find out why over 50,000 users trust Aha! to set product strategy, create visual roadmaps, and prioritize releases and features.