Create Visual Views of Your Product Roadmap With Tables and Charts


Aha! now enables you to create custom views of your goals, initiatives, and releases for sharing and analysis. We make it easy to visualize and report on your product plans through the new product roadmap pivot table. If you have used Excel in the past to share your thinking and plans — it’s time to stop the madness and use Aha! to showcase your roadmap and what the team is going to deliver.
Over the last few months at Aha! we have met with hundreds of software companies that serve different industries and use different techniques to set their product strategy and roadmaps. Consistently, we have found that folks want to be able to create custom tables and charts to share internally and present to customers. They also want to be able to report on and analyze what’s planned across the product portfolio.
We also know that the larger the team and business, the harder it is to consistently present a unified roadmap with every team using the same conventions to publish their plans. And numerous executives and product leads have told us that passing Excel spreadsheets around just does not work anymore. In fact, we are working with COOs and GMs in multiple major name-brand software and Web companies. Their teams spend dozens of painful hours every quarter trying to reconcile and consolidate the different roadmap views that are presented by product teams for easy consumption by the senior management team and board.
You can now use the Aha! roadmap pivot table to create and publish the perfect view of your roadmap. If you are familiar with using a pivot table (or even if you are not) with a few clicks you can now create tables and charts of your goals, initiatives, and releases to answer just about any question.
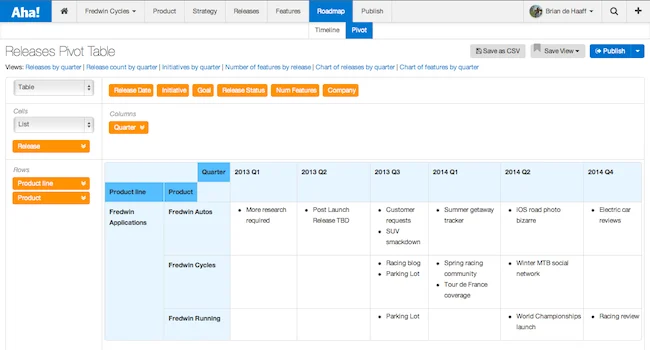
The following is a small sample of the different types of tables and charts that you can choose from and create with the new product roadmap pivot table functionality.
Release by quarter The release by quarter table highlights the releases (by name) that are planned by quarter across products.
Feature count by release The feature count by release table highlights the number of features that are planned by quarter across products. Click on any data in the chart to get the full chart editor and tons of options to further customize the view.
Initiatives by quarter If you are linking initiatives to releases, you can also build a table that highlights the initiatives that are planned to be delivered against by quarter. The same type of chart can be used to highlight goals as well (if you are linking goals to releases too).
You may have also noticed that in the screenshots above that the tables and charts can be saved as custom Views for you to go back to or share with your team. Any view can also be saved as a snapshot and published via a notebook as a PDF or secure Web page with any non user of Aha!


