Aha! Roadmaps | Explore an IT workspace in your account
Every IT group knows that there are more projects that need attention than people and time to get it all done. Aha! Roadmaps is a centralized workspace that is purpose-built for IT teams to gain alignment around what is most important to the business, make hard tradeoff decisions, and be even more agile.
Use this article to tour an IT workspace. We will walk through the demo workspace, called Fredwin IT (Demo). You can enable it in your own account, use this information to start building out your own IT workspace.
We created Fredwin IT (Demo) as a fictitious company, fully populated with records and data. By exploring it, you can get a sense of how Aha! Roadmaps works and how you might like to structure your own IT workspace.
All Aha! Roadmaps trials are fully functional — including the ability to set up integrations. This means that you can start adding your own strategy, roadmaps, and features at any time, even after starting with the demo project. You can also import your data into Aha! Roadmaps if you have IT projects in another tool.
Click any of the links to skip ahead:
Enable a demo IT workspace
A demo IT workspace is available for paid and trial accounts by navigating to Settings ⚙️ Account Profile and scrolling down to the section Demo data. Click Add demo to add the example IT workspace to your account.
Once you become comfortable with Aha! Roadmaps by using the demo workspace or creating your own demo IT workspace, you can easily delete all demo data and start managing your real IT work with your team. To delete the demo project line, navigate to Settings ⚙️ Account Workspaces and click the Delete button that appears to the right of the workspace line.
The IT data model
Let's start with an overview of the data model. You can watch this video to explore the Aha! Roadmaps data model, or keep reading to explore the IT workspace data model.
The Aha! Roadmaps data model does two things: It highlights the key building blocks in Aha! Roadmaps and it explains the relationships between them. The five main objects are lines, workspaces, releases, features, and ideas. Strategy can be set at both the IT workspace and the IT line levels and then linked to releases and features.
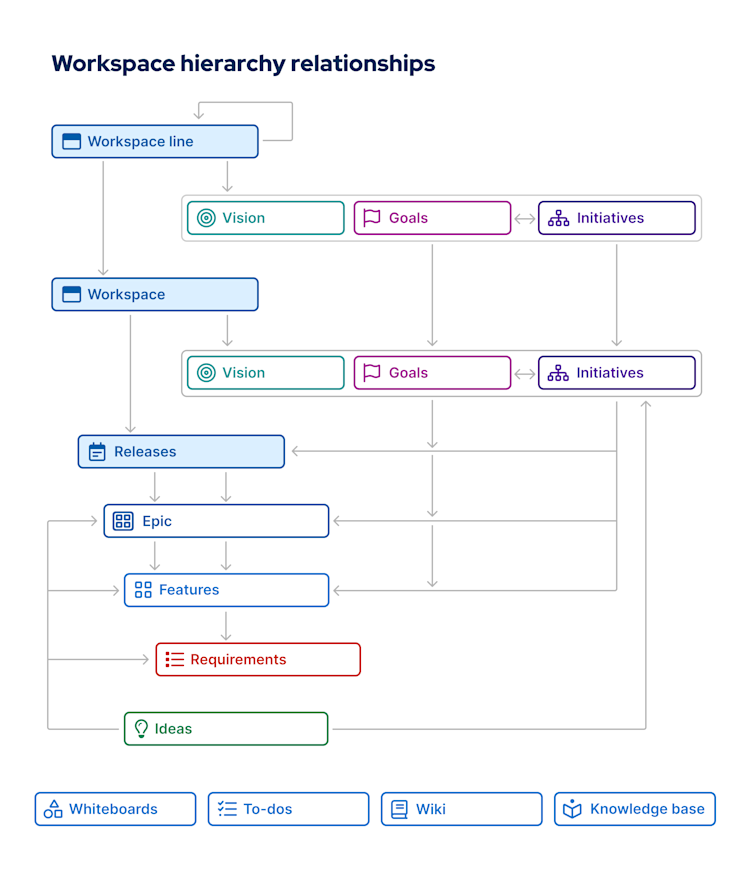
Workspace hierarchy
One of the first tasks in your new workspace will be to create your workspace hierarchy.
Click the dropdown in the top-left corner of Aha! Roadmaps to see the Fredwin IT (Demo) hierarchy. This demo company and workspace has two levels, but you can create as many as you need. This allows you to structure your Aha! Roadmaps account to reflect the design of your organization.
Knowledge
Centralize product information — from meeting agendas to brainstorming sessions, a single customer call to an entire product development framework, the Knowledge menu brings all your documents together.
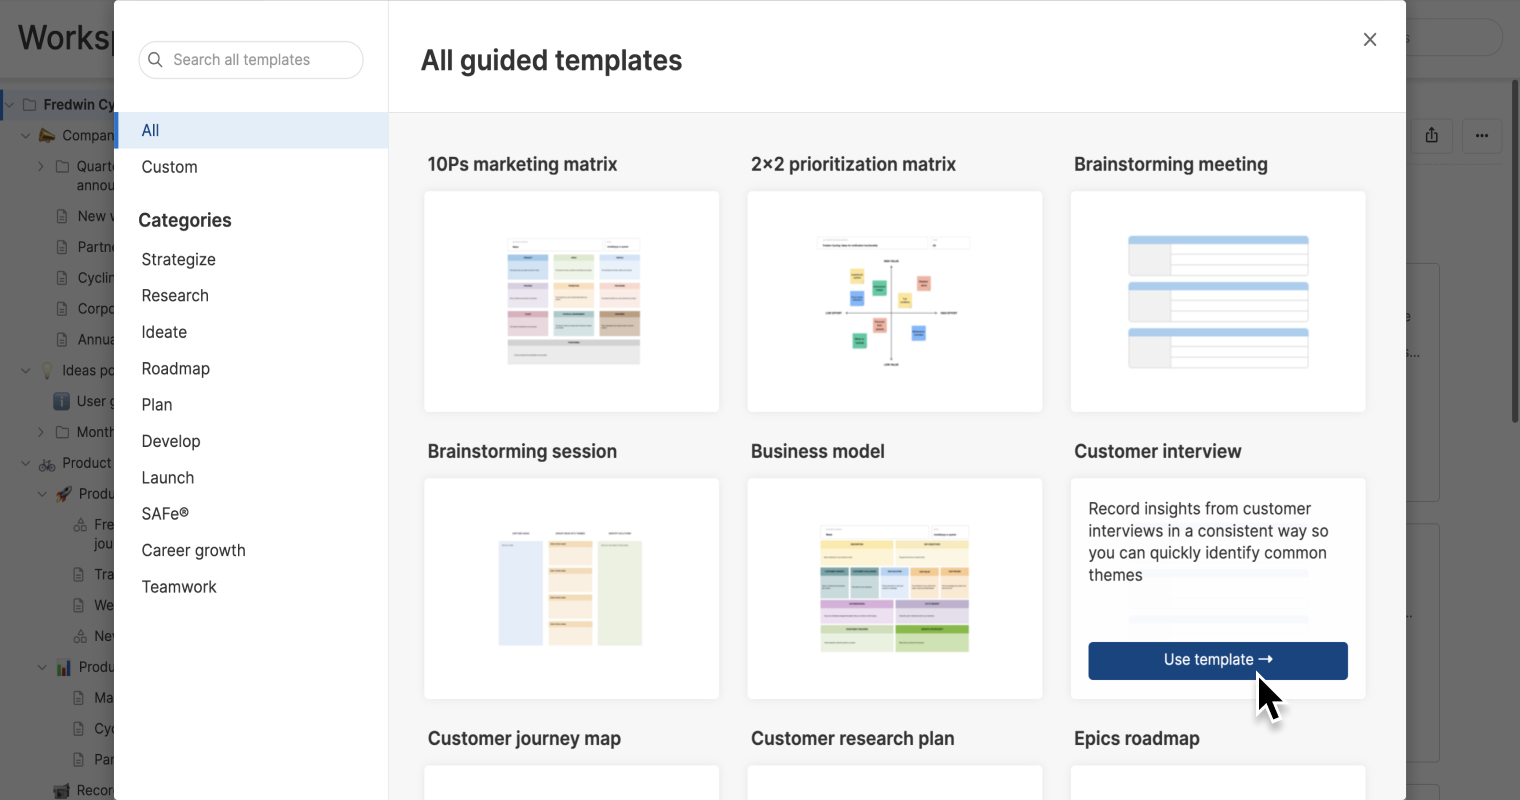
Use Documents to create the notes and whiteboards that spark ambitious ideas and track your team's progress towards success. Documents help you define team processes, train new members, collaborate in whiteboards, or any other use that comes to mind. Use the library of guided note and whiteboard templates to inspire creativity, drive consistency across teams, and establish a standard approach for documentation
Frameworks give you a central place to diagram the product development methodology that your organization uses — from setting strategy all the way through to launch. You can build your own framework, start with a scrum or SAFe�® template, or even use The Aha! Framework.
Files are a repository of every file attached to a record across your Aha! account, so you can easily find them again.
Strategy
In the Strategy tab, you can capture your strategy for each level of the workspace hierarchy — beginning with your workspace and rolling all the way up to the company level. You should link your strategy to the work your team completes as well, so that every feature, release, or idea has a clear connection to your strategic vision and every person on your team can see that strategic connection.
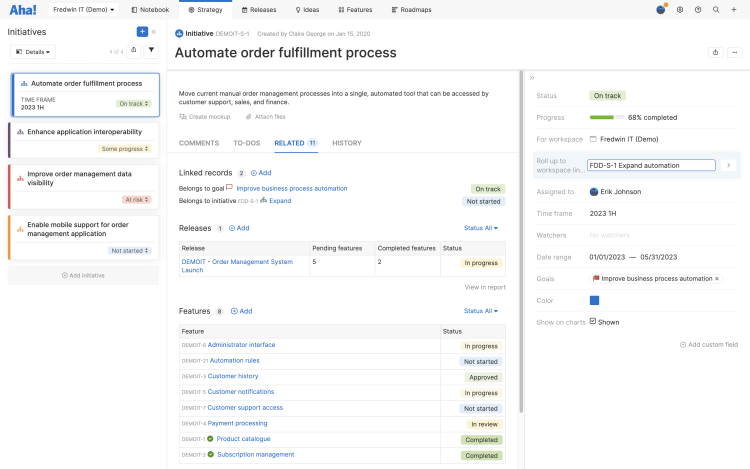
You will find goals and initiatives already set at the workspace level. When you link initiatives to releases, it creates a portfolio roadmap view. This helps you visualize how your releases tie back to your strategy.
You can link initiatives and goals together to show their relationships. However, initiatives can only be linked to goals at the same or higher level in the workspace hierarchy.
Releases
Your team's success often depends on your ability to prioritize your work, coordinate with other teams, and deliver on time. Releases in Aha! Roadmaps help you do just that.
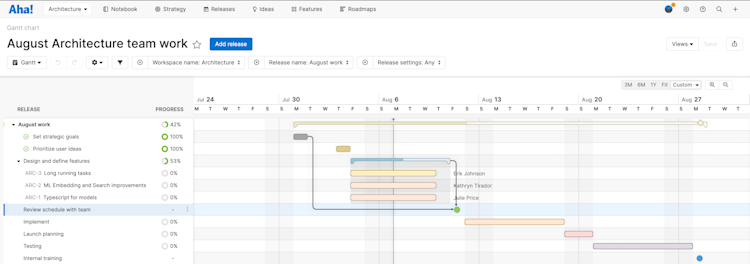
We created four releases. This is reflected on the Releases Gantt page. You can set up your own release template (with custom phases and milestones) under Settings ⚙️ Workspace Release templates.
You can also use these steps to add records to a release:
If you want to add features individually or structure release phases and milestones, click on your release in the Releases Gantt view to open its detail drawer. From here, click the Phases tab and Add phase or Add milestone. Click on the Related tab and Add to add a feature. Edit the details of each after you add them.
If you know exactly where you want to add a release element, expand your release on the left side of the Gantt view, then click the + icon between the two records where your new release element should appear. From there, you can add a New feature, Existing feature (one that has been hidden from the Gantt view), a Milestone, or a Phase.
You can also use the + icon that appears alongside a phase name to add New or Existing features directly to the phase.
The Aha! Roadmaps data model does two things: It highlights the key building blocks in Aha! Roadmaps and it explains the relationships between them. The five main objects are lines, workspaces, releases, features, and ideas. Strategy can be set at both the IT workspace and the IT line levels and then linked to releases and features.
Ideas
Better ideas lead to innovation, and innovation leads to market leadership. Every organization wants better ideas, but it's tough to actually capture them in a manageable way.
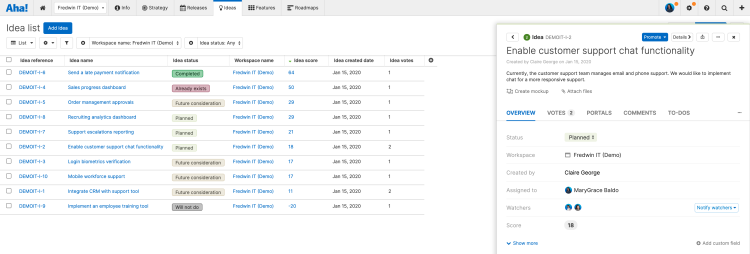
We created a set of ideas at the workspace level with varying statuses. You can see a list of all the ideas and their statuses on the Ideas List page. You can click on ideas to view descriptions and promote the best ideas directly to your roadmap. Scores have also been added using an idea scorecard. You can visualize the relative value and effort levels for each idea on the Ideas Chart page.
From the Ideas Overview or Ideas List page, you can add your own ideas by clicking Add idea. You can also create an ideas portal to capture ideas from internal users and other key stakeholders.
Features
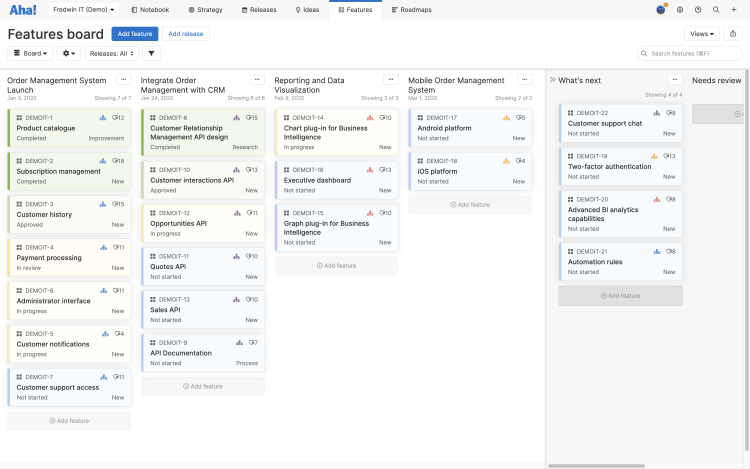
Features represent the incremental units of technical and non-technical work that carry out your strategic goals and initiatives.
Features have been linked to goals and initiatives. Aha! scores can be added using the Aha! scorecard to highlight the business value of each feature. Click on a feature to see its details.
You can organize your backlog items by adding as many parking lot columns as needed — just click Add Column.
Epics are used to group features that share a common business objective. Epics are also created with an Aha! Roadmaps score but are turned off by default. To enable epics, go to Settings ⚙️ Workspace Configure. Once enabled, you can switch between viewing epics and features on the Features Board page, and between viewing epics and releases on the Releases Gantt page.
Roadmaps
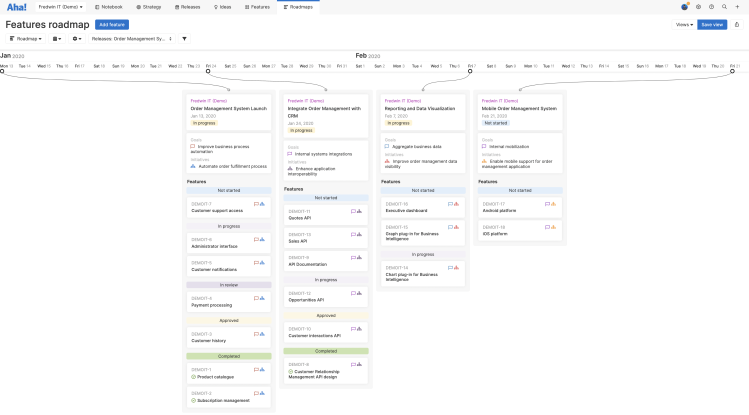
Visual roadmaps are one of the most powerful ways to communicate where your project or service is headed. Use them to showcase upcoming features you plan on delivering, set expectations around project timelines, or ensure key stakeholders are apprised of your high-level initiatives.
Go to Roadmaps Features and make sure that Fredwin IT (Demo) is selected in the hierarchy dropdown. With this roadmap, you can check which features you want to highlight and uncheck the features that you do not want to show.
From the Share menu, you can add the view to a new or existing Aha! Roadmaps presentation. Adding Aha! Roadmaps views to a presentation allows you to securely share your roadmaps with non-Aha!-Roadmaps users.
Analytics
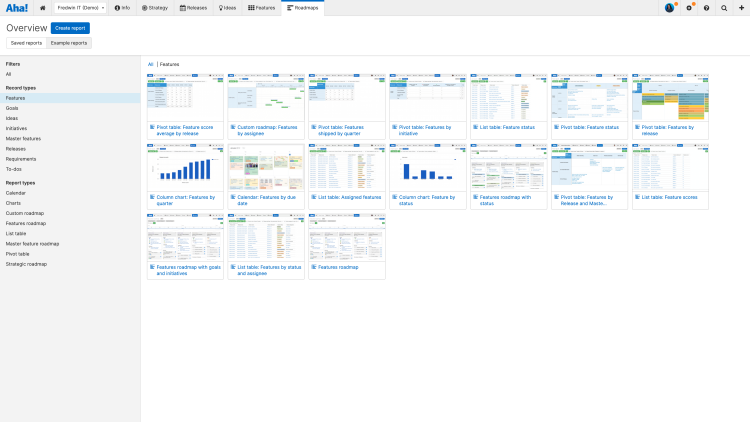
Analytics let you analyze your IT data using highly customizable list tables, pivot tables, and charts. To get started quickly, navigate to Roadmaps Library Overview. You will find more than 75 example reports that we created to help you get up and running.
For example, select the Features folder and choose List Table: Feature status. This will generate a report that lists the sample IT features in the selected workspace and their status.
You can also track progress on all major Aha! Roadmaps record types using the Progress field. This will automatically calculate the percent of work completed and visualize progress on roadmaps and reports.
In addition to the example reports, the Analytics section allows you to manipulate the hundreds of data objects in Aha! Roadmaps to create your own custom roadmaps and IT reports.
Presentations
An Aha! Roadmaps presentation is an easy way to share your roadmaps, reports, and other information from Aha! Roadmaps with your audience via secure webpage or PDF — or, for a live audience, deliver it from your browser using Presentation mode. The information shared in your presentation is directly connected to the data in your account, making it painless to keep your audience informed as updates are made.
Support
After you have gone through the demo IT workspace, it is time to add your own IT workspace.
If you get stuck (or curious!) reach out to our Customer Success team. They are all Aha! experts and they respond super fast.