This article refers to releases and features. Depending on your workspace type, you may see "schedules" and “activities" in your workspace.
Aha! Roadmaps | Create record links
Regardless of the size of your team or the complexity of your roadmap, you will come across portions of work that relate to or depend on each other. It can be incredibly useful to create links between Aha! Roadmaps records that allow your teammates to dig in for further context and to visualize these links in reports and roadmaps.
The following record types in Aha! Roadmaps can be linked to each other:
Goals
Initiatives
Releases / Schedules
Release phases / Schedule phases
Release milestones / Schedule milestones
Epics
Features / Activities
Ideas
Notes
Click any of the following links to skip ahead:
Create record links
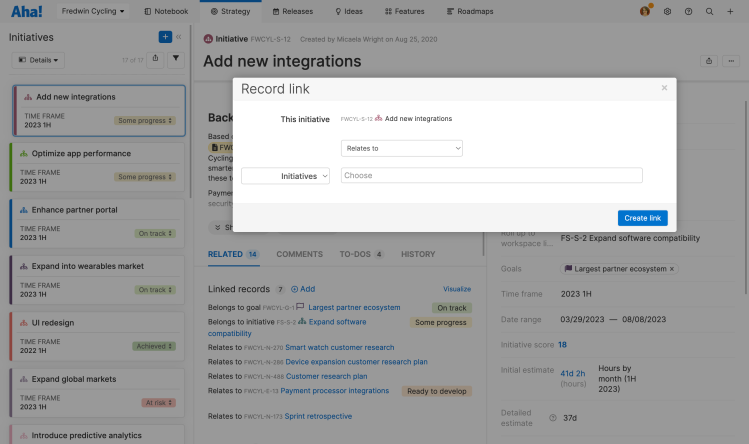
To create a record link, open the detail view for a record and click the More options menu in the upper-right corner.
Click Link to another record to open the Record link modal.
![Create a record link]()
The Relates to dropdown gives you options for the type of record link you want to establish and the These <records> dropdown allows you to select the record type to search for in the Choose field.
Begin typing a record's reference number or title, then select the record(s) from the search suggestions that you'd like to link. Click Create link.
Any record link you create from a record's Research tab will automatically have the link Has research in.
Select a record relationship type
Your record link can be any one of eight relationship types.
Relates to: This is the most generic relationship. When a record is related to another record in some way that's not easily defined by the other categories but you want to show that relationship, you can use Relates to.
Depends on / is a dependency of: This is the most commonly used relationship. It states that one record must be completed before another can start. You can create this record relationship by linking records or on the Releases Gantt view. If you create record dependencies on the Gantt chart and the due date of a record gets pushed out, you can adjust the start and due date for dependent records as needed. If you try and schedule a dependency before the record it is dependent on, the dependency line will turn red to highlight the conflict.
Duplicates / is Duplicated by: Occasionally, you may want to track duplicate work. For example, if you have two products and both will use the same feature, you may still need to track the feature in both product roadmaps. The work only happens once so you should create a primary feature where the work will be done and then create a second feature and link it to the primary. This helps you report on and keep track of the work.
Contains / is contained by: If you are working on a record that will be part of another record, use this link to show the relationship. For example, you might be creating an alerting capability that's triggered by a report. You create the reporting capability in one feature but link it to the other feature for alerting capabilities.
Impacts / is impacted by: This could represent a record whose work will ultimately impact the design of another record (but does not create a dependency). In this example, you may wish to hold off on your design until the first record's design is completed.
Blocks / is blocked by: This could represent a record that completely blocks another record because until you complete the first, absolutely no work can take place on the second record. Another example is that this record uses a resource that you need — the development team's time, for example — and until it's completed, you are blocked. This relationship could be helpful in reporting tradeoffs you've made during the roadmapping process.
Has research in: This record — note, whiteboard, idea, poll, empathy session, or feedback widget — was linked from a record's Research tab.
Release notes in: This note was linked by AI-drafted release notes. You can also link a record to a note manually with this relationship.
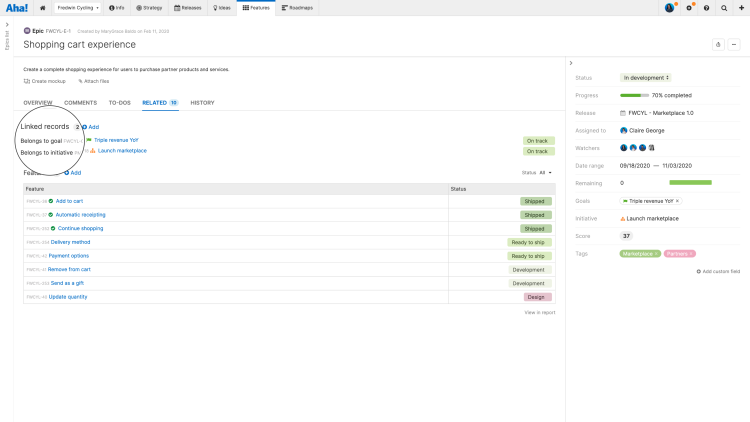
Once you have created a record link, you can see it on each record's Linked records section within the record's Related tab. Click one of the hyperlinks to see the detail drawer for the linked record.
If you have a Related tab with a lot of record links, it can be helpful to know those links' sort order:
Parent record types, sorted by each link's creation date
Child record types, sorted by each link's creation date
Record links that are Relates to and Depends on are kept separate.
Configure the Related tab to make it easier to manage large projects. Access your custom layouts to configure the Related tab for a record.
Visualize record links
Now that you have linked one or more records together, it is time to visualize them.
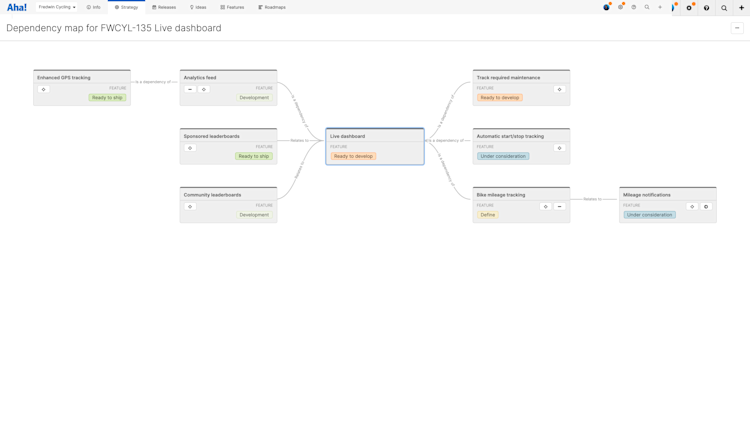
On the Related tab of your records, click Visualize. You will see an interactive dependency map that allows you to click into any of the linked records and expand or collapse the dependencies of records linked to yours.
Visualize does not appear for Belongs to relationships (e.g. if a feature belongs to an initiative). It appears once you have linked records by selecting a record relationship type.
Report on record links
There are two ways to report on record links.
Roadmaps give a time-based view of linked records, so you can track how related work will affect your plans.
Reports help you analyze data, summarize progress, and chart trends.
Let's talk about reports first:
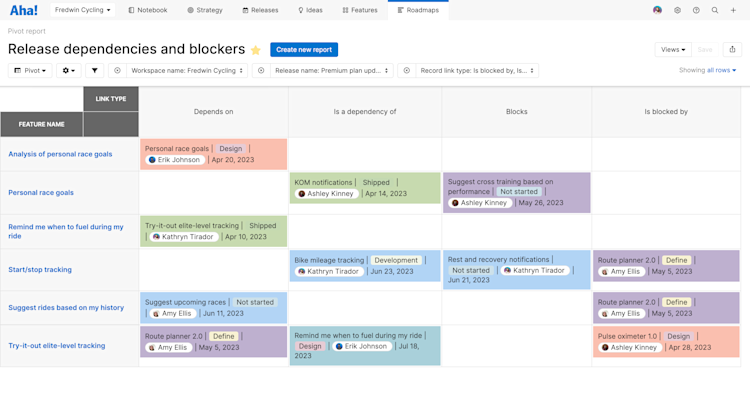
Include key details about dependent work items. Use the [Record type] record links table in any list, pivot, or chart report (or custom roadmap!). Then, add the Linked [record type] table and select any field (like Status, Assignee, or Due date) on the linked record's layout.
For a focused view of critical dependencies, filter these reports to show only records with Depends on/Dependency of relationships. You can also add information about manual and automatic risk indicators. Then, add your filtered report as a dashboard panel.
View dependencies for multiple objects at once using the dependency report.
Next, roadmaps:
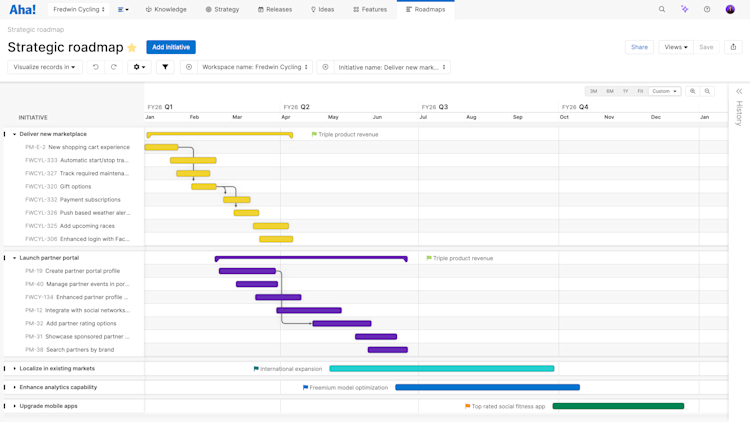
Dependency relationships between initiatives, epics, and features can be visualized on the strategy roadmap.
You can visualize cross-team dependencies on the strategy roadmap, to highlight items that an initiative depends on that might not be visible on the roadmap.
Dependency relationships between features, phases, and milestones can be visualized on the Releases Gantt page (for releases and epics) or on Roadmaps Dependency.
You can visualize cross-team dependencies on the Gantt chart, to highlight items that a release or epic depends on that might not be visible on the roadmap.
There are two ways to view linked records on custom roadmaps. Expand the right sidebar and Show dependency lines to view dependencies on your roadmap. Or, build the roadmap using the [Record type] record links to view all record links, along with their Date range and their Status. If a linked record's Date range exceeds the range of its parent, you will see a warning icon.
Custom roadmaps can build off of list reports, pivot tables, and charts. Add the [Record type] record links and Linked [record type] tables to your custom roadmap to visualize details about dependent records. Or Show dependency lines to see dependencies.
Save any of these visualizations to return to them later, and Share them with your team in Aha! presentations, as secure webpages, or as static images.
Sync record links with development tools
In addition to records within Aha! Roadmaps, you can also link most records between Aha! Roadmaps and the following development tools:
This means development can see dependencies between records that product teams have identified.
You can use field mapping to map different record relationship types to each other — so that Aha! Roadmaps records will retain their links when they flow to Jira issues or Azure DevOps work items, and vice versa.
Note: Requirements, which always exist as children of features, do not sync with these development tools.
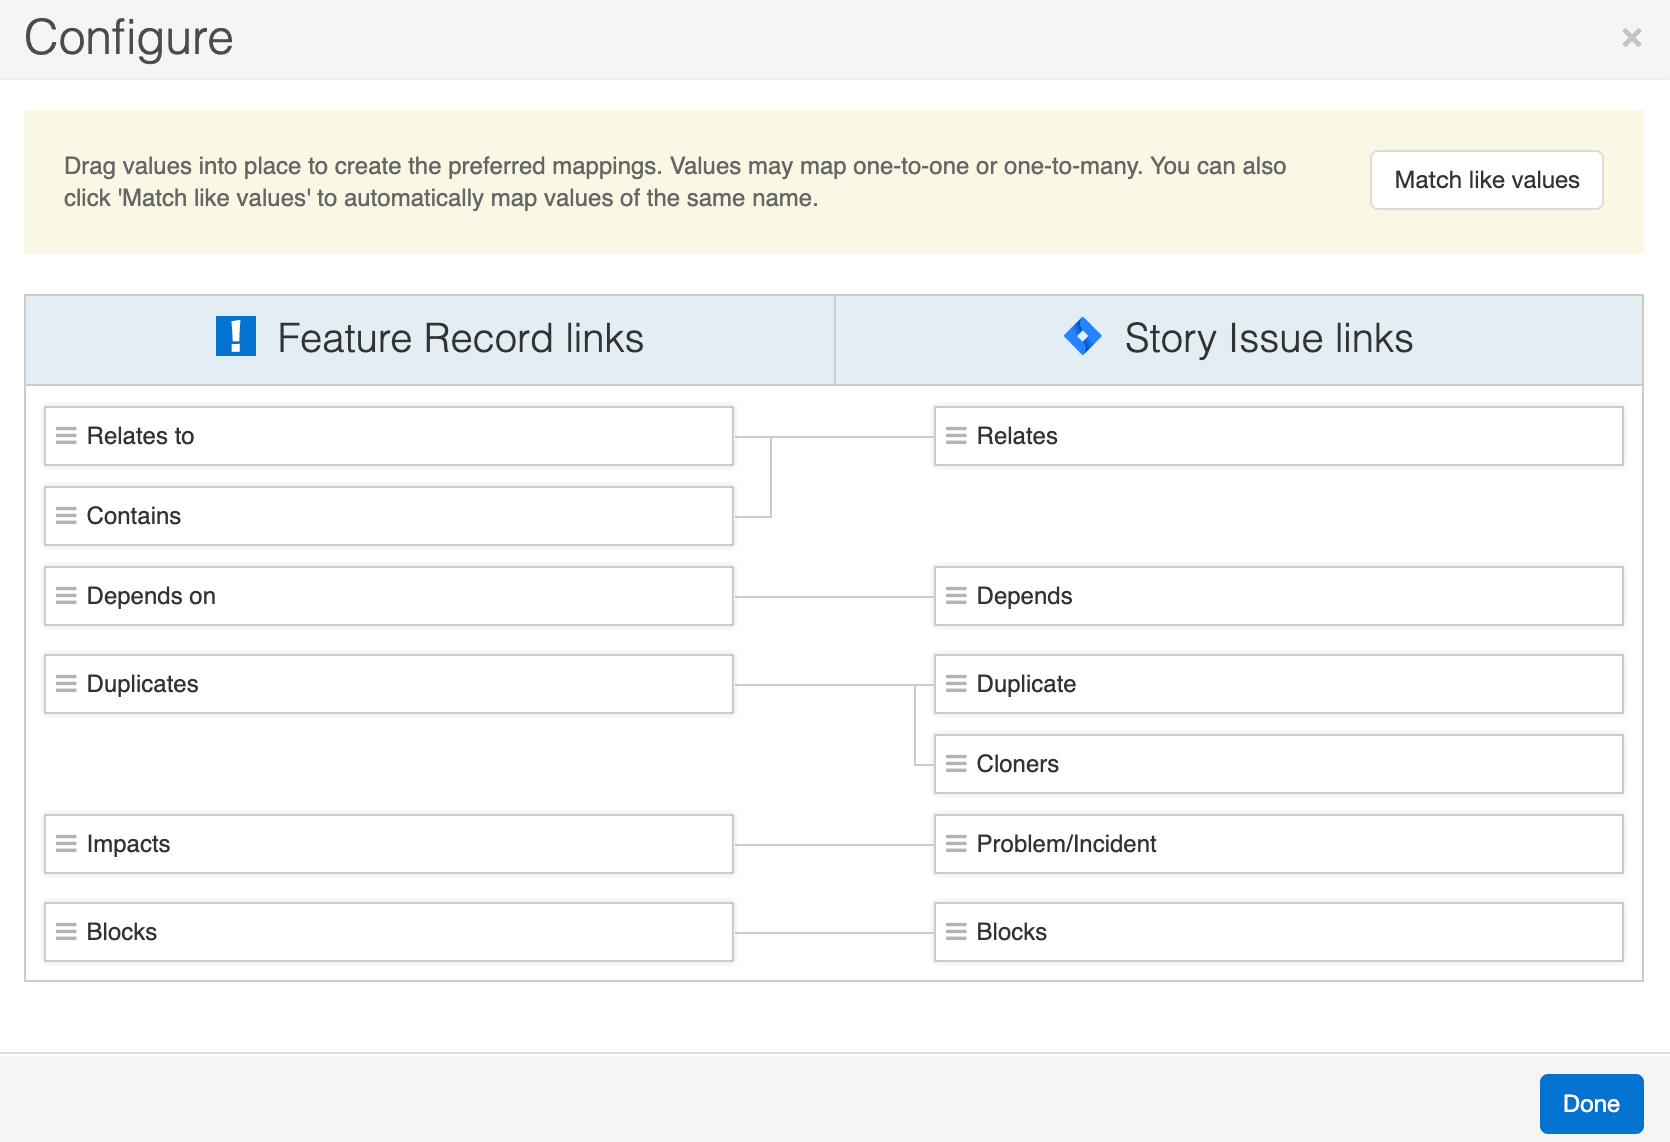
If you use a bidirectional mapping, then users in either Aha! Roadmaps or the development tool can create and update record links as they discover them. Your data will always display the affect of one record on another.
