Aha! Roadmaps | Individuals capacity report
Every team working together to meet ambitious goals needs to answer the following questions:
Can we complete the most important work items with the people we have available?
Is anyone overbooked or underutilized?
How would rescheduling work affect a person's capacity and the overall plan?
What work is unscheduled or unassigned — and who has the capacity to take it on?
You need to be able to see the workload assigned to each team member so you can make informed decisions about changes that affect your roadmap and the opportunity costs associated with them. The capacity report is the perfect tool for this. It can focus on records as small as features or as large as strategic initiatives.
In this article, we will focus on capacity planning and time tracking at the level of individual members of your team. If you are an Enterprise+ customer, you can also visualize capacity across entire teams — including individual team members.
Click any of the following links to skip ahead:
Enable the capacity report
To use the capacity report, you first need to enable capacity planning in your workspace by navigating to Settings ⚙️ Workspace Capacity planning. You will need to be an owner of your workspace to enable the capacity report, though users with any permissions level can use it.
The capacity report is hidden until at least one workspace in your Aha! Roadmaps account enables capacity planning for individuals or capacity planning for teams and then customizes their menu navigation to show the report.
Set up the capacity report
Let's start by getting oriented with the report itself. The report will start on the Capacity view — the the view that shows an individual's capacity by user and month. Since we are focusing on individual capacity planning, select Individuals from the Individuals / Teams toggle.
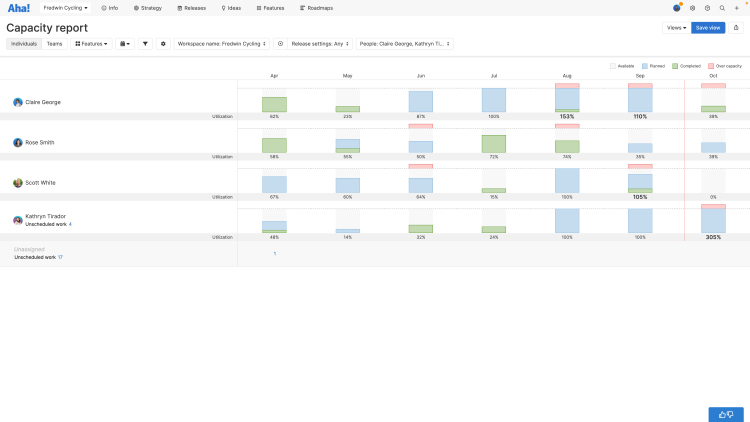
The individuals capacity report looks at work that has been scheduled and assigned to individual Aha! users in your account.
Use the Record type dropdown to select the record type you want to visualize — initiatives, epics, features, or requirements.
Remember, any record with child records — an epic with child features, for example — can have its Detailed estimates calculated from those child records. This way, when you view the capacity report for epics, for example, you will see the total estimates of all child features on those epics. Adjust your Estimate association setting in Settings ⚙️ Workspace Capacity planning to configure the default.
Use the Set dates dropdown to adjust the date range for your report.
Use the filters at the top of the report to focus it to the exact People, Workspaces, Release settings, or Initiative time frames you want. If you want to add a quick basic filter, hover over the filters bar and click the Add filters + icon. If you want to add advanced filters, click the Edit filters icon.
Configure the capacity report
For best results, the capacity report needs to visualize how your team estimates effort and completes work. Click the Configure capacity report ⚙️ button to do this.
First, Configure velocity to select which records should show on the report.
If you select Estimate in time, the report will display any records that have a time-based estimate added to them. The capacity report assumes that each individual works eight hours a day, Monday through Friday. You cannot edit this.
If you select Estimate in story points, the report will any records that have a point-based estimate added to them. You can configure how many story points constitute a day's work. By default, the capacity report assumes that each individual can complete one story point a day.
Next, Configure planning to select how individuals on your team complete work.
If you select Sequential planning, the report will assume that individuals work on one item at a time. It starts with the highest priority item and applies one hundred percent of a person's available capacity to each record in sequence until the work is complete.
If you select Parallel planning, the report will assume that individuals work on multiple items at the same time. It starts with the highest priority item and allocates the necessary daily capacity to complete the item by its Due date — the same amount of effort each day. It then distributes any unallocated daily capacity to the next item(s) in the list.
Finally, Configure estimate to match how you estimate effort.
Best (default) prioritizes the Detailed estimate, if available.
Initial only uses the Initial estimate exclusively.
Detailed only uses the Detailed estimate exclusively.
Click Save to save your changes. The changes you make to this modal do not affect the records themselves, or any other Aha! account user's view of the capacity report.
Note: To appear on the capacity report, a record needs to have two attributes:
It must have Start and Due dates.
The Estimate's units must match the Estimation units you have selected in the Configure capacity report ⚙️ modal.
To ensure that you have a complete view of the work your team has committed to, add estimates to all relevant records and use the same estimation units for all estimates.
Visualize individual capacity
On the left side of the capacity report, you will see a list of Aha! users with access to the workspace(s) you selected in the top filters. Any record assigned to a user will appear in that user's row — either by month in the report itself or in the Unscheduled work section below the user's name.
In the middle of the capacity report, you will see each user's capacity per month. Any record assigned to a user that has a Start date and Due date will contribute to that user's total monthly capacity. The report calls these Scheduled records. If you have not already done so, click on any Scheduled record to add an Initial or Detailed estimate.
If a record has both Initial and Detailed estimates, it will use the Detailed, which is usually the more accurate estimate.
At the bottom of the report, the Unassigned section will display records that have been scheduled but lack an assignee. Just like the other rows in the capacity report, you can see a link here to Unscheduled work — work that, in this case, is both unscheduled and unassigned.
Hover over any cell in the report to see the capacity for that user in that month. Click any month to see the Timeline view, and click on any user's Unscheduled work to see the Unscheduled work view. We'll discuss both views in the next sections.
Finally, you will see a few different colors in the capacity view.
Grey shows that a month or part of a month is available — that the user has untapped capacity that month.
Blue shows that a month or part of a month has planned work in it — that is, records assigned to that user whose Start dates fall in that month.
Green shows that a month or part of a month has completed work in it — records that were assigned, scheduled, and completed.
Red shows that a user is overcapacity in a given month. They either have more work than they can be expected to complete in the month or they have records whose Start dates, Due dates, or Estimates conflict with each other.
Resolve capacity conflicts
The capacity report shows you at a glance where members of your team are over capacity. It also gives you the tools to resolve conflicts right on the report. If you see red on a month or you notice that the total capacity percentage for a month is over 100%, there is a capacity conflict.
Let's look at how the capacity report communicates capacity and how to read it.

In this image, MaryGrace has almost three weeks of available capacity in June, shown by a blue box.

In this image, Claire is over capacity in July. You can see that her blue box is full, and the red extends beyond it. Claire has been assigned more work than she can complete in July.
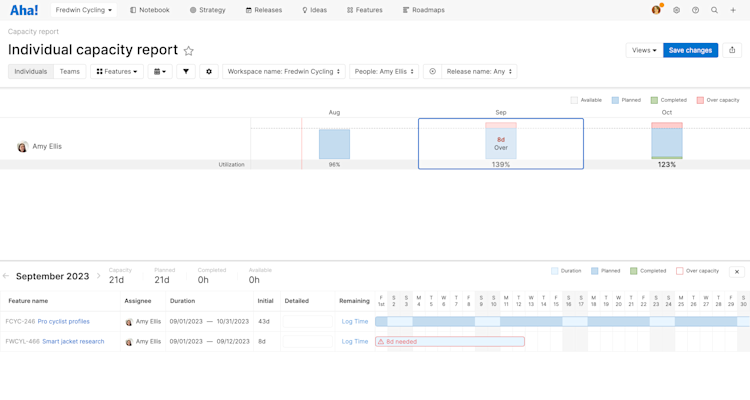
In this image, Rose is working Sequentially (one work item at a time), and has a scheduling conflict in June. We can see that she has available capacity (her blue box is not full), but can not start the next work item until the highest priority item is complete.
If you see boxes like this — with available capacity but red at the top — your next step should be to look at how work is scheduled that month. Click on the month you want to work on to open the Timeline view for that user's scheduled records in that month.
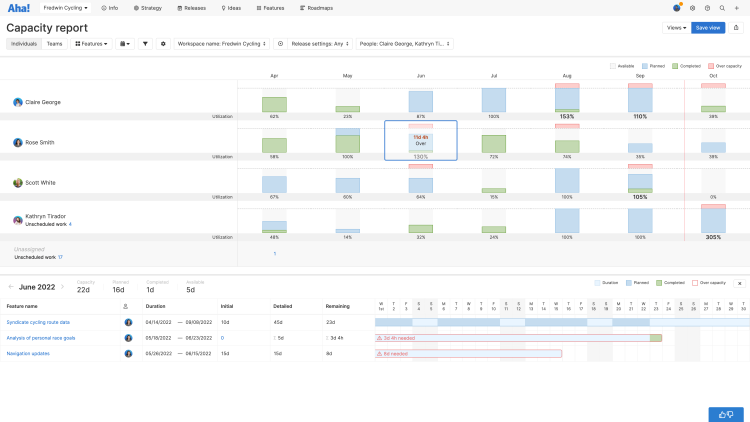
In the Timeline view, you will see a list of records assigned to a user along with scheduling information about them — their Duration (Start date and End dates) and the Estimates (Initial or Detailed). You can also see any Actual effort logged on the record. Click on the Record name to open the record's detail drawer and edit it or click on any of the scheduling fields to edit those.
Note:
If a record has both Initial and Detailed estimates, the report will use the Detailed, which is usually the more accurate estimate.
If you enter an Estimate that is shorter than the time between a record's Start date and Due date, the capacity report will assume that work on that record will begin on the Start date — as long as no other higher-ranked records have the same Start date — and end when the Estimate is complete.
If you enter an Estimate that is longer than the time between a record's Start date and Due date, the capacity report will still tell you how many extra days' work the record needs. But it will not update to show you work completed in the colored progress bar as you log work on the record.
If are estimating in time on the report and you do not enter an Estimate on a record, the report will calculate one for you based on days between the record's Start date and Due date. You can also adjust those dates to adjust your estimate.
The Timeline view shows you every day in your selected month and how your scheduled records play out throughout the month. You can hover over a record on each day in the month to see how much work is planned for that record on that day.
The timeline view also includes colors that are similar to those you saw in the capacity view:
Light blue shows when a record is scheduled but no work is planned. Weekends, for example, will be this color.
Blue shows when work is planned on a record.
Green shows work completed.
A red border around a scheduled record shows that it is in conflict — either with another record or because there is not enough time to complete the work planned in the scheduled time.
Capacity report assumptions
Before we resolve two common capacity conflicts, it is useful to consider a few assumptions that the capacity report makes:
Team members work five days every week (M-F).
Time-based estimates:
Team members work 8 hours a day if you have chosen to Estimate in hours.
Time-based estimates are created in days unless you specify a different Default time in Settings ⚙️ Workspace Capacity planning. So, for example, it will interpret an estimate of "1" as "1 day."
Points-based estimates:
Team members complete a default of 1 story point per day. To change this velocity, click Configure capacity report ⚙️, then change Estimate in story points.
Planning selection:
If you have chosen Sequential planning, the report will use all of the person's available capacity before moving on to the next item.
If you have chosen Parallel planning, the report will assume that users' capacity will be divided among work items with overlapping durations, based on their priority. A record's priority is the same as its rank order on the Strategy Initiatives or Features Board pages.
With those assumptions in mind, we are ready to resolve capacity conflicts. Here are some of the most common conflicts you will face.
A user has too much work assigned to them
In this scenario, when you click on the timeline view for a user in a given month, you will see a record whose Estimate is longer than the scheduled time available to it (the time between the record's Start date and Due date).
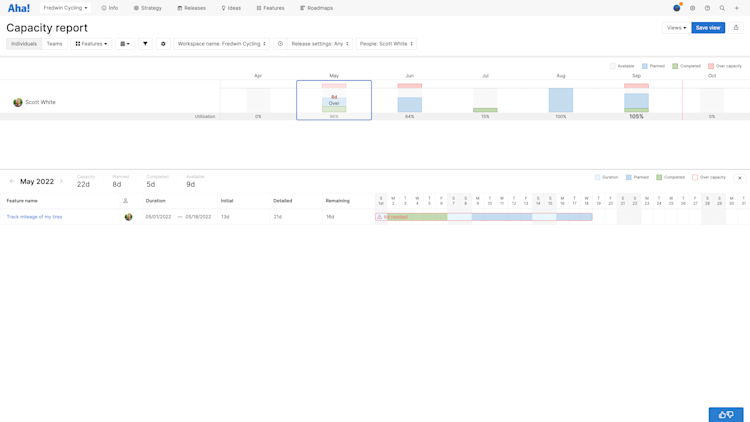
To resolve this conflict:
Expand the scheduled time available by adjusting the record's Start date or Due date.
Reduce the Estimate for the record. Depending on the complexity of the record, this may require a discussion with the record's assignee.
If you have selected Parallel planning, move or adjust the Estimates of records scheduled to be worked on at the same time.
A user has scheduled work conflicts (sequential work)
In this scenario, when you are planning Sequentially and you click on the timeline view for a user in a given month, you see records that overlap with each other. Remember, the report assumes a user will work on one record at a time — so scheduling a user to work the whole day on two records will trigger an overcapacity warning. The report also assumes that a user will work on records in order of rank — so if two records have the same Start date, the one higher on the list will be started first.
Note: To see a record's rank, navigate to Features -> Board for features or epics and to Strategy -> Initiatives for initiatives.
Features and epics are ranked within a release (the higher the order, the higher the rank) and between releases (the earlier the release date, the higher the rank). Releases on the features board are organized left-to-right by release date.
Initiatives are ranked by their order on the initiatives board. The higher the order, the higher the rank.
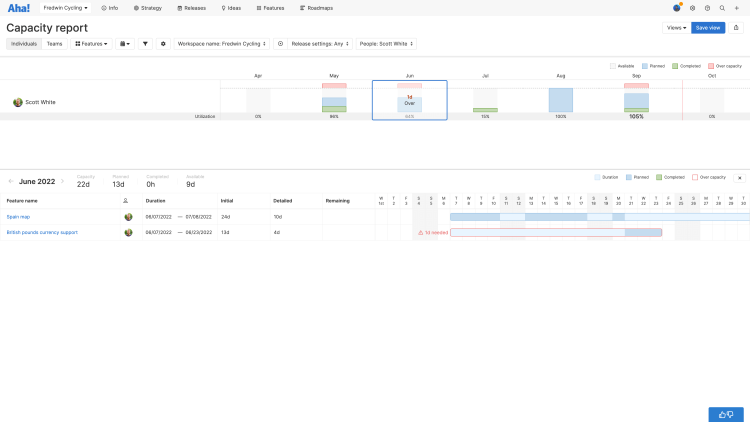
To resolve this conflict, make sure that each record has enough unallocated days to complete its planned work estimate before its Due date.
To do this, look at the colored progress bars for each record. In the screenshot above, you can see that the first feature's Due date overlaps with the second's Start date, but since only one feature has planned work on that day, there is no capacity conflict.
However, the second and third features both plan to start work on the same Start date. This is a conflict for those planning in Sequential planning. Since the capacity report assumes that the user will work on one record at a time and start with the higher-ranked record first, the capacity conflict is with the third feature in the list.
Our options are to:
Shift the Start date for the third feature to a day where the user has no other planned work and extend the Due date so that there is enough time to complete the Estimate. In this example, Thursday the 6th would work, though technically two features are scheduled for work on that same day — so if they are not completed during their planned days, this could become another conflict.
Shift the Start date for the third feature to a day where the user has no other planned work. Also change the Due dates for the other two features so that no other feature is scheduled for work on that day.
Change the Estimates for any of these features so that periods of planned work do not overlap.
Assign one or more of these features to other users.
Change the rank of the features to prioritize which feature should be worked on first. In a scenario where one feature's Due date overlaps with a higher-ranked feature's Start date, changing the features' rank would resolve the conflict.
A user has scheduled work conflicts (parallel work)
In this scenario, when you click on the timeline view for a user in a given month, you see records that overlap with each other. If you are planning in Parallel, this is fine — the report assumes that individuals will work on multiple records at once. But in this case, there is not enough capacity to complete all the scheduled work in time.
The report also assumes that a user will work on records in order of rank — so if two records have the same Start date, the one higher on the list will be started first.
Note: To see a record's rank, navigate to Features -> Board for features or epics and to Strategy -> Initiatives for initiatives.
Features and epics are ranked within a release (the higher the order, the higher the rank) and between releases (the earlier the release date, the higher the rank). Releases on the features board are organized left-to-right by release date.
Initiatives are ranked by their order on the initiatives board. The higher the order, the higher the rank.
If you are working in Parallel and have multiple work items scheduled with overlapping Durations, the capacity report starts with the highest ranked record and divides the Duration by the Estimate to determine how much time a user needs to spend each day to complete that record on its Due date. If there is daily capacity remaining, the report then looks at the next highest ranked record and follows the same process.
So in this case, the first record does not have a capacity conflict, because it gets first priority at the available capacity: half a day for two days, and it will be finished. The second record does, however. After allocating capacity to the higher ranked record, there is not enough available daily capacity remaining to complete the second record by its Due date.

To resolve this conflict, make sure that each record has enough unallocated days to complete its planned work estimate before its Due date.
Our options are to:
Expand the Duration for one of the features by changing the Start and Due dates. If there is more time to complete the work in parallel, both Estimates can remain the same.
Shift the Duration for one of the features so there is less of an overlap by changing the Start and Due dates. When Julie has less overlap, she can devote more of her capacity to a single record.
Adjust the Estimate of one of the features. This may involve descoping the work item, or breaking it into smaller individual items.
Change the rank of the features to prioritize which feature should be worked on first.
Assign one or more of these features to other users.
Resolve unscheduled work
In addition to the capacity view and the timeline view, the capacity report has one further view: the unscheduled work view. You can access this view by clicking the Unscheduled work link beneath any user's row, including the row for Unassigned records.
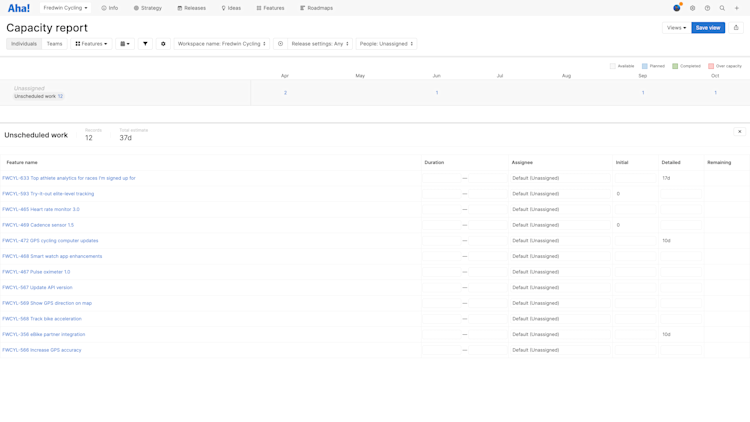
Records show in this view if they lack both a Start date and a Due date.
Click a Record name to open the detail drawer for a record.
Use the Duration section to enter a Start date and Due date for a record.
Use the Estimate section to enter an effort estimation (Initial or that differs from the record's Duration. If you are estimating in time and leave this blank, the Estimate will equal the Duration.
Use the Assignee section to change the record's Assignee.
Once you have scheduled a record, it will appear in both the capacity view and the timeline view of the report. It will contribute to a user's capacity calculations if assigned to a user.
Set a default capacity report
The best saved views drive consistency across your team — or your entire organization. Workspace owners can set default views at the workspace or workspace line levels, so that everyone is using the agreed upon standard. To set defaults more broadly, you can set them at the workspace line level, so that child workspaces can inherit the defaults.
To set a default view, first Save one. Then navigate to Settings ⚙️ Workspace Default views and configure your new default.
A user will see your default view if they do not already have a working copy of a view on that page, or if they click Views Reset to default view.
If you update your default view and Save it again, that update will be reflected for anyone who views the default.
Share your capacity report
Once your capacity report is ready, click Save to name it, save it, and adjust viewing permissions. You can share it with your stakeholders by selecting one of the export options under the Share menu on the top right of the page.
To fold your report into a presentation, select Add to presentation. In your presentation, you can select the report's update frequency.
To invite people outside of your Aha! Roadmaps account to view your report, select Share as webpage.
To schedule recurring email delivery of your report, select Schedule email delivery.
For a static version of your report, export it to PNG image or PDF document.