From slow tests to slow production: Debugging with Stackprof
One morning, a developer announced in our Slack channel that some tests were failing on our main branch. The cause of the failures was not obvious. No recent PRs seemed related, and neither the code nor the tests had changed in a long time. The tests seemed to be timing out after several minutes rather than failing outright. All this piqued my curiosity, and I decided to take a look. It turned out we had just caught a massive potential performance degradation. This is how I nailed down the root cause.
The initial pass
The first step was to look into the CI logs. I focused on one of the tests that ran for two minutes before failing. This was a Capybara test, which can be on the slower side, but two minutes seemed like an outlier. Fortunately, we track the average execution time of our tests and use the data to split tests into buckets for parallel execution. The test in question normally took 20 seconds to finish — so it was suddenly six times slower.
I ran the test locally to see if I could reproduce it, and sure enough, the test hung for about a minute and a half at one point. I started setting breakpoints in the code so I could step through and locate the source of the stall. I eventually landed on a method that was creating a bunch of example data. Were these database queries slow? The logs said no, but they did show a flurry of Active Record callbacks. Sprinkling breakpoints across callbacks sounds about as fun as cleaning up glitter after arts and crafts, so a change of strategy was in order.
Profiling with Stackprof
The next tool I reached for was a sampling profiler called Stackprof. It takes snapshots of the call stack on an interval and writes that data to a file for further analysis. Sampling profilers are generally quick with low overhead, which is useful for not slowing down the already slow test. The code change looked like this:
before do
  StackProf.start(mode: :wall, raw: true)
end

after do
  StackProf.stop
  StackProf.results('/tmp/stackprof.dump')
end
Here, RSpec hooks wrap the spec in a Stackprof call. We are using the wall clock mode so that I/O time is included in addition to CPU time (I figured a slow test was likely waiting on I/O). We also include extra raw data, which is required to generate flame graphs (more on this below). We then tell Stackprof where to write the results.
After running the test and collecting the profiling data, we can analyze the results using Stackprof commands. These are the results as simple text:
$ bundle exec stackprof /tmp/stackprof.dump --text

==================================
  Mode: wall(1000)
  Samples: 123483 (1.09% miss rate)
  GC: 691 (0.56%)
==================================
     TOTAL    (pct)     SAMPLES    (pct)     FRAME
     87774  (71.1%)       87774  (71.1%)     Kernel#sleep
     28736  (23.3%)       28736  (23.3%)     IO#wait_readable
      2062   (1.7%)        2062   (1.7%)     PG::Connection#exec
       516   (0.4%)         516   (0.4%)     TCPSocket#initialize
       394   (0.3%)         394   (0.3%)     (marking)
       295   (0.2%)         295   (0.2%)     (sweeping)
       163   (0.1%)         163   (0.1%)     OpenSSL::SSL::SSLSocket#connect_nonblock
       111   (0.1%)         111   (0.1%)     IO#write
      3588   (2.9%)          93   (0.1%)     Class#new
        90   (0.1%)          90   (0.1%)     Kernel#methods

... more
The test spent 71% of its time sleeping! This is a Capybara test, so of course it sleeps a lot. It has to wait for pages to load and DOM to settle. Even so, 71% is a lot of sleep time, so I dug in further. Here, we can see the breakdown of Kernel#sleep callers:
$ bundle exec stackprof /tmp/stackprof.dump --method 'Kernel#sleep'

Kernel#sleep (<cfunc>:1)
  samples:  87774 self (71.1%)  /   87774 total (71.1%)
  callers:
    87392  (   99.6%)  Redlock::Client#try_lock_instances
      251  (    0.3%)  Selenium::WebDriver::SocketPoller#with_timeout
      131  (    0.1%)  Capybara::Node::Base#synchronize
Nearly all of the sleep time was spent in the Redlock::Client#try_lock_instances method. This turned out to be the smoking gun. Unfortunately, I was not familiar with how Redlock was used in our application. Even though the answer was staring me in the face, I needed more convincing.
Checking the flame graphs
I decided to examine the profiling results in a different way by using a flame graph. Stackprof can generate one with the command:
$ bundle exec stackprof /tmp/stackprof.dump --d3-flamegraph > /tmp/flamegraph.htmlOpen the generated HTML file in a browser:
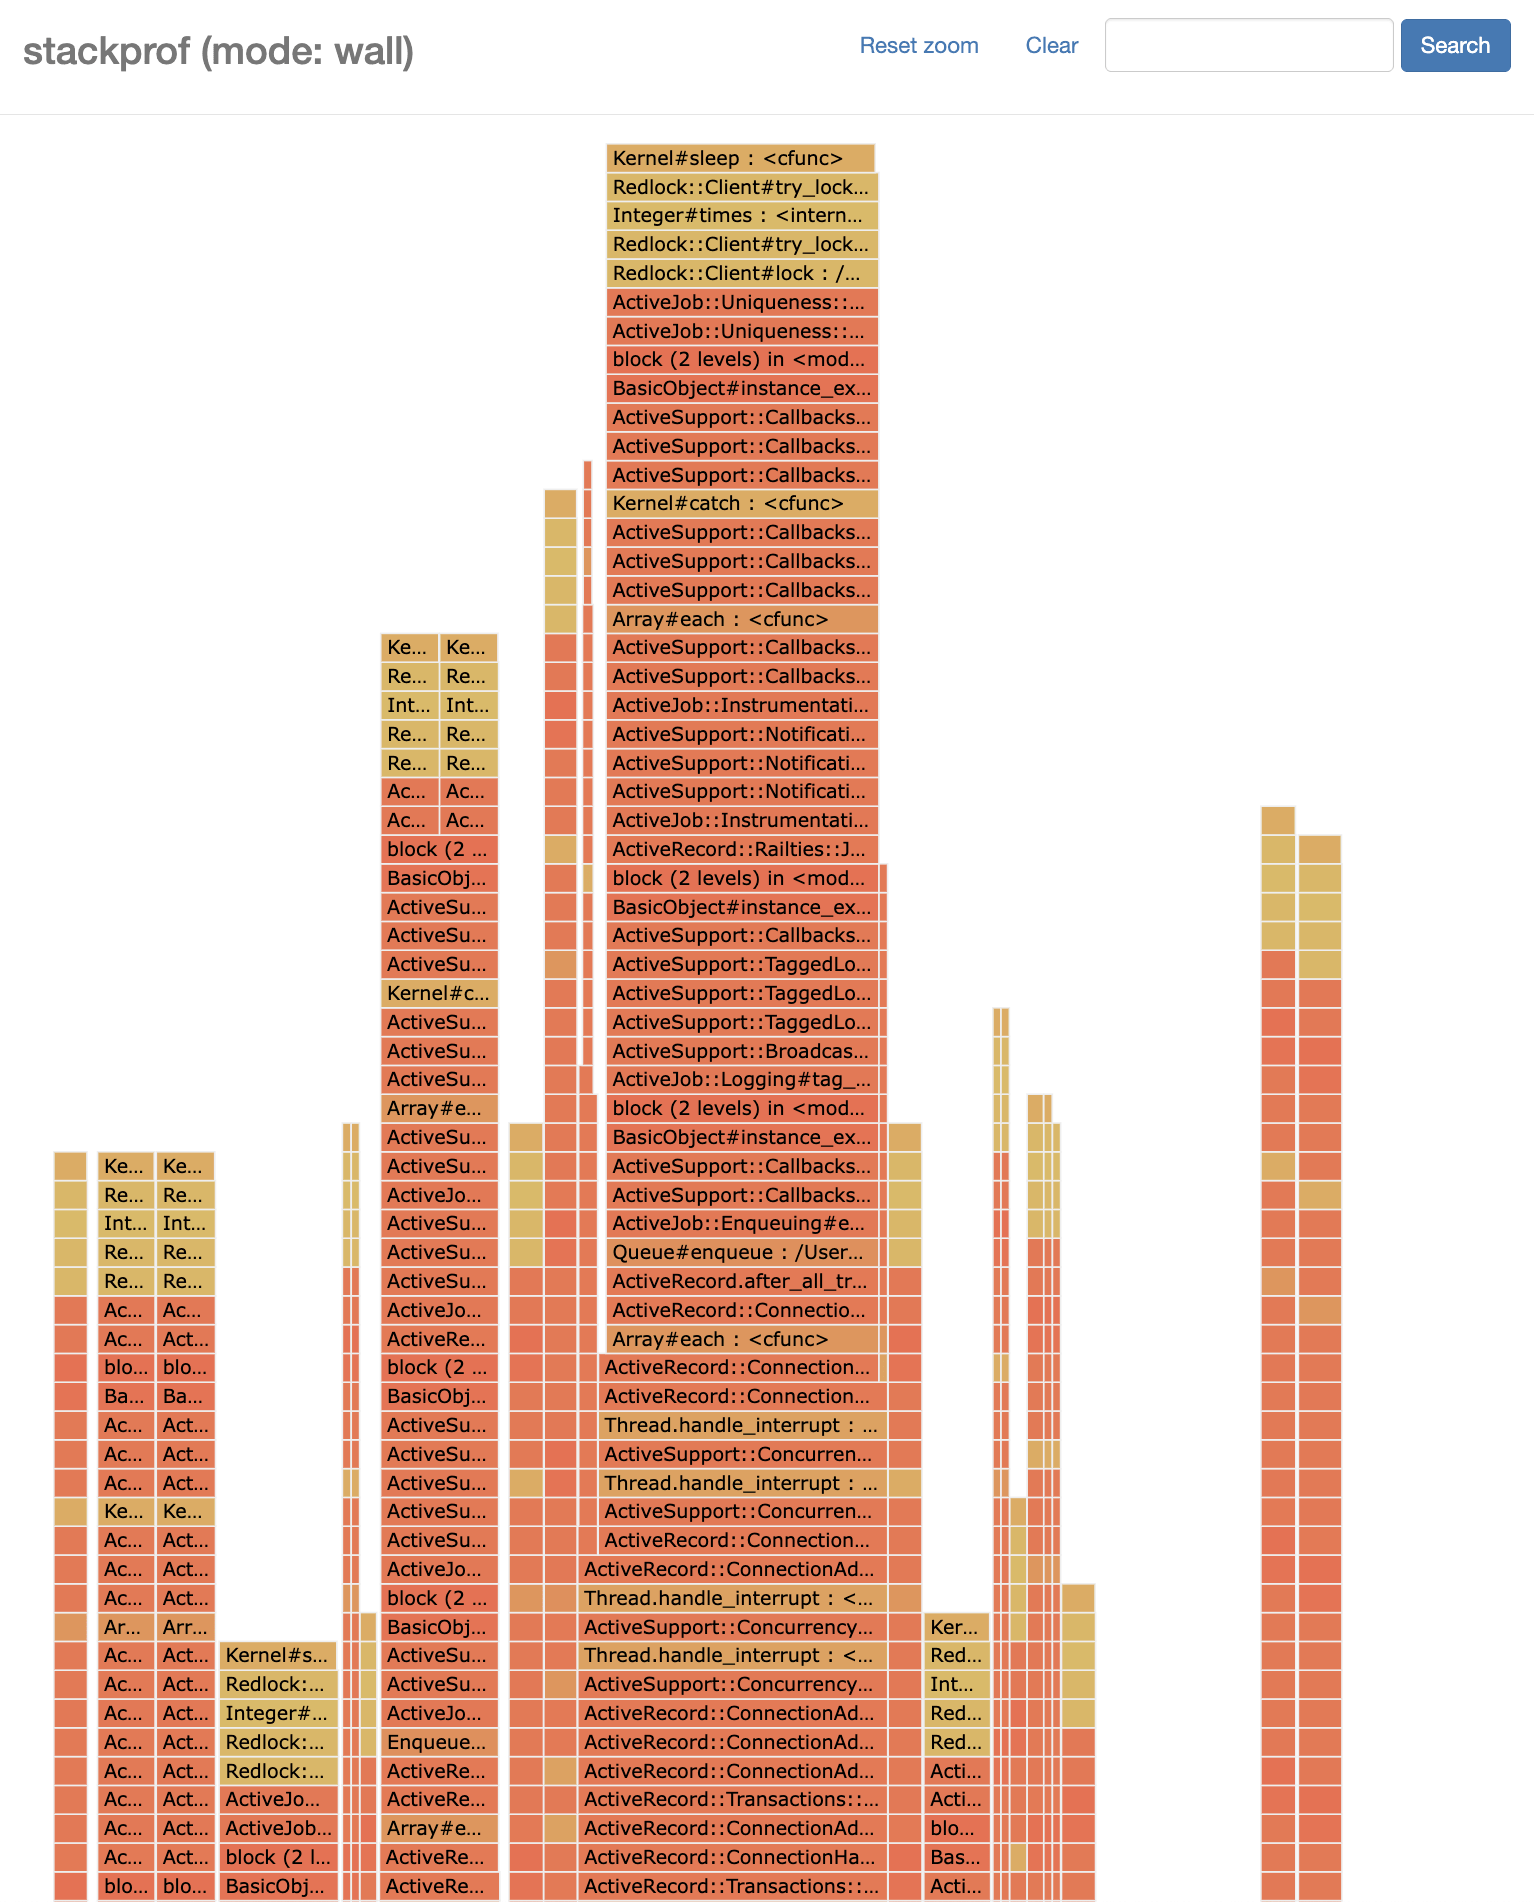
Some tips for interpreting a flame graph:
- Each horizontal bar represents a frame of the stack.
- The width of the bar represents how long the program spent in that frame.
- The height represents the depth of the call stack.
- The root of the stack is at the bottom of the graph.
- The rows diverge as methods are called.
- The colors are arbitrarily assigned within a palette and are just for visual separation.
A good technique for finding the bottleneck is to start at the bottom of the graph and trace upward until the call stack starts to split. When a split occurs, follow the wider frame. Repeat until you reach the tip of the flame. You have now identified the most significant hot spot.
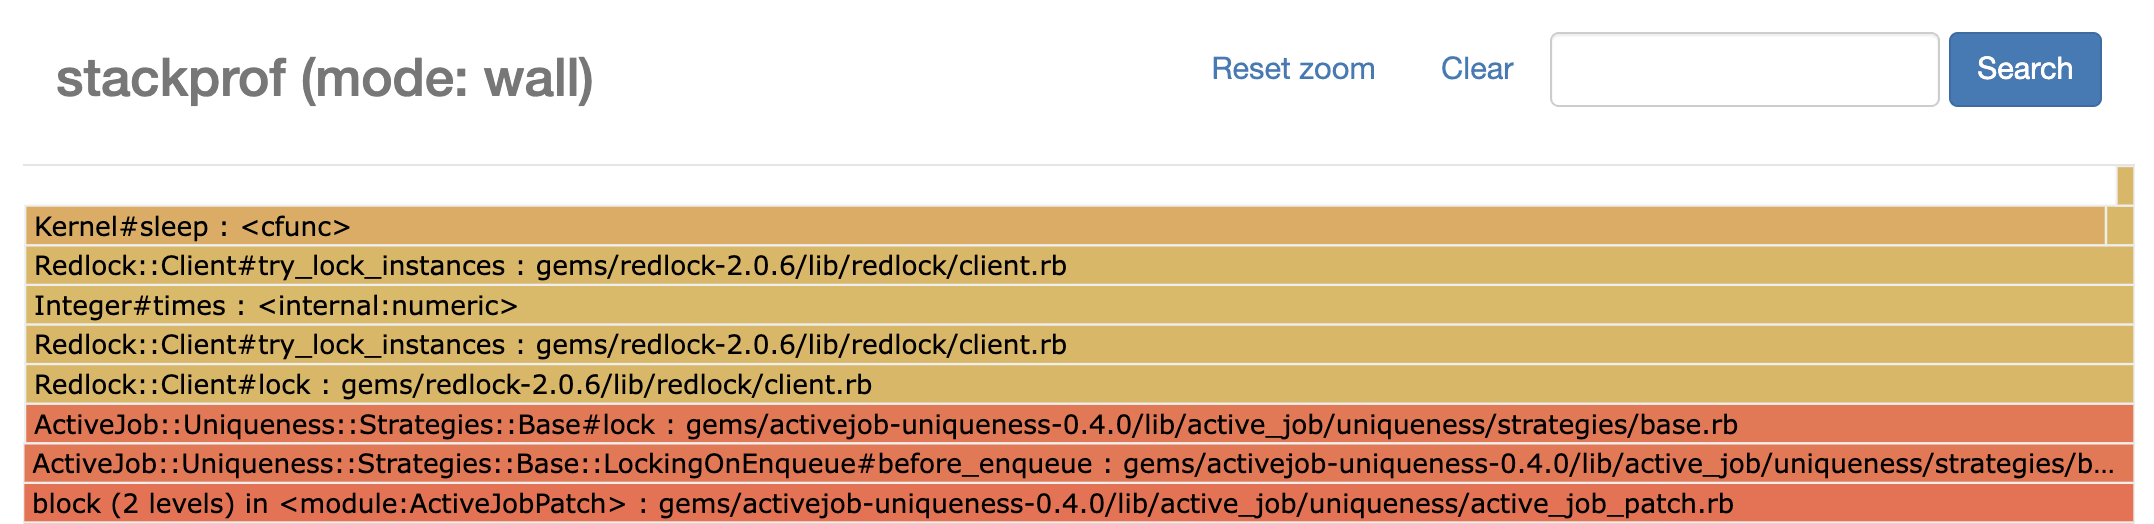
What method did I find at the tip of the flame? Kernel#sleep with Redlock::Client#try_lock_instances directly underneath. In fact, that same pair was at the tip of every flame on the graph. This was clearly the culprit; I was now convinced.
The root cause
Redlock was the culprit, but why? What changed? A search of git log and recent PRs turned up this innocent-looking configuration change:
config.redlock_options = { redis_timeout: 1 }This is configuration for the activejob-uniqueness gem, which we use to deduplicate enqueued background jobs. Each job gets an ID based on its parameters. The first unique job has its ID written to Redis via the Redlock gem. Subsequent attempts to enqueue a job with the same ID will be rejected.
We set a one-second timeout, and tests suddenly got slow. The root cause is clearly timeouts, right? I couldn't find any evidence to back this up. No slow requests in the application logs. No obvious issues in the Redis logs. My intuition said it did not add up, so it was time for a closer examination of the gem's source code.
The activejob-uniqueness configuration code looks like this:
config_accessor(:redlock_options) { { retry_count: 0 } }config_accessor is defined by ActiveSupport::Configurable and provides convenient getters and setters for a config object. Interestingly, a default hash is provided with retry_count set to zero. What happens if we set redlock_options to our own hash? The defaults are overwritten! That means we fall back to Redlock's default retry behavior. Now, we need to dig a level deeper into the Redlock source code.
By default, Redlock will retry lock acquisition if it finds a conflict. The default behavior is configured like this:
#    * `retry_count`   being how many times it'll try to lock a resource (default: 3)
#    * `retry_delay`   being how many ms to sleep before try to lock again (default: 200)
#    * `retry_jitter`  being how many ms to jitter retry delay (default: 50)
That's 3 retries * (200 ms sleep + 0-50 ms jitter), which is 600-750 ms of sleep time per lock conflict! We accidentally sprung a huge performance trap simply by overwriting the default config hash.
Measuring the impact
We identified the root cause, but how impactful is this performance penalty? I added the following code to the spec to measure this:
let(:notifs) { [] }

before do
  ActiveSupport::Notifications.subscribe(/active_job_uniqueness/) do |event_name, *|
    notifs << event_name
  end
end

after do
  puts notifs.tally
end
This subscribes to ActiveSupport::Notifications that match those published by the activejob-uniqueness gem. The notifications are then grouped by name and counted. Here are the results of one spec run:
{"lock.active_job_uniqueness"=>8, "conflict.active_job_uniqueness"=>160} There were eight unique jobs successfully enqueued and another 160 conflicts that triggered the 600–750 ms retry penalty. That equals 1:36–2 minutes of sleep time. Recall that this test normally ran in 20 seconds, but was now running for two minutes. We've accounted for the aforementioned slowdown!
Considering production
The job uniqueness check is not isolated to this one test. It occurs constantly throughout the application. If we saw this much of a performance degradation for a single test, imagine the impact this could have had in production at scale. According to our production metrics, the app enqueues about 10 jobs that perform a uniqueness check every second. Not all of these jobs would hit the retry behavior, but even a small subset that did would have a significant impact — and all this from a one-line change!
Fortunately, we quickly identified the root cause and reverted the change. The long-term fix is to merge our custom options into the base options, and I have opened a PR with the activejob-uniqueness gem to help others avoid this pitfall. It sometimes pays to pull on a thread and see where it leads. And in this case, it solved our performance regression mystery.
Learn more about how our engineering team works through tricky problems on the Aha! engineering blog.